
Recommended
More Related Content
Similar to that is associated with broad upwarping of the overlying litho.docx
Similar to that is associated with broad upwarping of the overlying litho.docx (20)
More from mattinsonjanel
More from mattinsonjanel (20)
Recently uploaded
Recently uploaded (20)
that is associated with broad upwarping of the overlying litho.docx
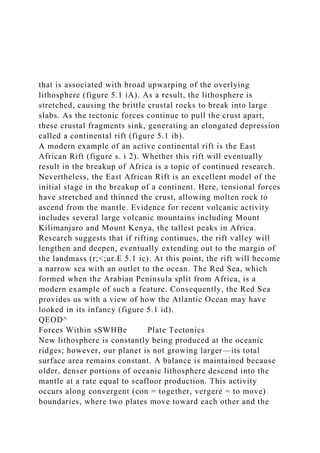
- 1. that is associated with broad upwarping of the overlying lithosphere (figure 5.1 iA). As a result, the lithosphere is stretched, causing the brittle crustal rocks to break into large slabs. As the tectonic forces continue to pull the crust apart, these crustal fragments sink, generating an elongated depression called a continental rift (figure 5.1 ib). A modern example of an active continental rift is the East African Rift (figure s. i 2). Whether this rift will eventually result in the breakup of Africa is a topic of continued research. Nevertheless, the East African Rift is an excellent model of the initial stage in the breakup of a continent. Here, tensional forces have stretched and thinned the crust, allowing molten rock to ascend from the mantle. Evidence for recent volcanic activity includes several large volcanic mountains including Mount Kilimanjaro and Mount Kenya, the tallest peaks in Africa. Research suggests that if rifting continues, the rift valley will lengthen and deepen, eventually extending out to the margin of the landmass (r;<;ur.E 5.1 ic). At this point, the rift will become a narrow sea with an outlet to the ocean. The Red Sea, which formed when the Arabian Peninsula split from Africa, is a modern example of such a feature. Consequently, the Red Sea provides us with a view of how the Atlantic Ocean may have looked in its infancy (figure 5.1 id). QEOD^ Forces Within sSWHBe Plate Tectonics New lithosphere is constantly being produced at the oceanic ridges; however, our planet is not growing larger—its total surface area remains constant. A balance is maintained because older, denser portions of oceanic lithosphere descend into the mantle at a rate equal to seafloor production. This activity occurs along convergent (con = together, vergere = to move) boundaries, where two plates move toward each other and the
- 2. leading edge of one is bent downward, as it slides beneath the other. Convergent boundaries are also called subduction zones, because they are sites where lithosphere is descending (being subducted) into the mantle. Subduction occurs because the density of the descending tectonic plate is greater than the density of the underlying asthenosphere. In general, oceanic lithosphere is more dense than the asthenosphere, whereas continental lithosphere is ( Upwarping figure 5.11 Continental rifting and the formation of a new ocean basin. A. The initial stage of con tinental rifting tends to include upwelling in the mantle that is associated with broad doming of the lith-osphere.Tensional forces and buoyant uplifting of the heated lithosphere cause the crust to be broken into large slabs. b. A s the crust is pulled apart, large slabs of rock sink, generating a rift valley. C. Further spreading generates a narrow sea, similar to the present- day Red Sea. D. Eventually, an expansive ocean basin and ridge system are created. )less dense and resists subduction. As a consequence, only oceanic lithosphere will subduct to great depths. DID YOU KNOW? The remains of some of the earliest humans, Homo habilis and Homo erectus, were discovered by Louis and Mary Leakey in the East African Rift Scientists consider this region to be the "birthplace" of the human race,
- 3. 180 Pg. 152 Convergent Boundaries I 53 ( figure S. 1 2 East African rift valleys and associated features. ) Deep-ocean trenches are the surface manifestations produced as oceanic lithosphere descends into the mantle (figure 5.13). These linear depressions are remarkably long and deep. The Peru-Chile trench along the west coast of South America is more than 4500 kilometers (3000 miles) long and its base is as much as 8 kilometers (5 miles) below sea level. The trenches in the western Pacific, including the Mariana and Tonga trenches, tend to be even deeper than those of the eastern Pacific. Slabs of oceanic lithosphere descend into the mantle at angles that vary from a few degrees to nearly vertical (90 degrees). The angle at which oceanic lithosphere descends depends largely on its density. For example, when a spreading center is located near a subduction zone, as is the case along the Peru- Chile trench, the subducting lithosphere is young and, therefore, warm and buoyant. Because of this, the angle of descent is small, which results in considerable interaction between the descending slab and the overriding plate. Consequently, the
- 4. region around the Peru-Chile trench experiences great earthquakes, including the 1960 Chilean earthquake—the largest on record. As oceanic lithosphere ages (gets farther from the spreading center), it gradually cools, which causes it to thicken and increase in density. In parts of the western Pacific, some oceanic lithosphere is 180 million years old. This is the thickest and densest in today's oceans. The very dense slabs in this region typically plunge into the mantle at angles approaching 90 degrees. This largely explains the fact that most trenches in the western Pacific are deeper than trenches in the eastern Pacific. Although all convergent zones have the same basic characteristics, they are highly variable features. Each is controlled by the type of crustal material involved and the tectonic setting. Convergent boundaries can form between two oceanic plates, one oceanic and one continental plate, or two continental plates. Oceanic-Conti nental Convergence Whenever the leading edge of a plate capped with continental crust converges with a slab of oceanic lithosphere, the buoyant continental block remains "floating," and the denser oceanic slab sinks into the mantle (figure 5.i4a). When a descending oceanic slab reaches a depth of about 100 kilometers (60 miles), melting is triggered within the wedge of hot asthenosphere that lies above it. But how does the subduction of a cool slab of oceanic lithosphere cause mantle rock to melt? The answer lies in the fact that water contained in the descending plate acts like salt does to melt ice. That is, "wet" rock in a high-pressure environment, melts at substantially lower temperatures than does "dry" rock of the same composition. Sediments and oceanic crust contain a large amount of water that is carried to great depths by a subducting plate. As the plate plunges downward, heat and pressure drive water from the voids in the rock. At a depth of roughly 100 kilometers, the wedge of mantle rock is sufficiently hot that the introduction of
- 5. water from the slab below leads to some melting. This process, called partial melting, is thought to generate about 10 percent molten material, which is intermixed with unmelted mantle rock. Being less dense than the surrounding mantle, this hot mobile material gradually rises toward the surface. Depending on the environment, these mantle-derived masses of molten rock may ascend through the crust and give rise to a volcanic eruption. However, much of this material never reaches the surface; rather, it solidifies at depth—a process that thickens the crust. The volcanoes of the towering Andes are the product of molten rock generated by the subduction of the Nazca plate beneath the South American continent (figure 5.i4b). Mountain systems such as the Andes, which are produced in part by volcanic activity associated with the subduction of Measuring the Size of Earthquakes 179 I ij r- rr/r ( Distance in mil es 500 1000 1500 2000 2500 3000 Distance in kilometers figure 6. ii A travel-time graph is used to determine the distance to the epicenter.The difference in arrival times of the first P and S waves in the example is 5 minutes.Thus. the epicenter is roughly 3400 kilometers (2100 miles) away. ) ( figure 6.1 2 Determining an earthquake epicenter using the distances ob tained from three or more siesmic stations—a method called
- 6. trongutat/on. ) Historically, seismologists have employed a variety of methods to determine two fundamentally different measures that describe the size of an earthquake—intensity and magnitude. The first of these to be used was intensity—a measure of the degree of earthquake shaking at a given locale based on observed damage. Later, with the development of seismographs, it became possible to measure ground motion using instruments. This quantitative measurement, called magnitude, relies on data gleaned from seismic records to estimate the amount of energy released at an earthquake's source. Intensity and magnitude provide useful, though different, information about earthquake strength. Consequently, both measures are used to describe earthquake severity. Intensity Scales Until a little more than a century ago, historical records provided the only accounts of the severity of earthquake shaking and destruction. Perhaps the first attempt to "scientifically" describe the aftermath of an earthquake came following the great Italian earthquake of 1857. By systematically mapping effects of the earthquake, a measure of the intensity of ground shaking was established. The map generated by this study employed lines to connect places of equal damage and hence equal ground shaking. Using this technique, zones of intensity were identified, with the zone of highest intensity located near the center of maximum ground shaking and often (but not always) the earthquake epicenter (FIGURE 6.13). VI _ i Oakland San Francisco
- 7. San V|| Jose VIII VI + Epicenter Santa Cruz DID YOU KNOW? During the 1811-1812 New Madrid earthquake, the ground subsided as much as 4.5 meters (15 feet) and created Lake St. Francis *est of the Mississippi and enlarged Reelfoot Lake to the east. Other regions rose, creating temporary waterfalls in the bed of the Mississippi River. Montery figure 6.13 Zones of destruction associated with the Loma Prieta earthquake that devastated portions of California's San Francisco Bay Area, January 1994. Intensity levels based on the Modified Mercalli Intensity Scale. Note the areas of heavy destruction in San Francisco and Oakland, located almost 100 kilometers (60 miles) from the epicenter. I 80 CHAPTER 6 Restless Earth: Earthquakes, Geologic Structures, and Mountain Building ( 24 sec Seismograph record 0 10 20 ) ( Distance, S-R km sec. figure 6. 14
- 8. Illustration showing how the Richter magnitude of an earth quake can be determined graphically using a seismograph record from aWood-Anderson instrument. First, measure the height (amplitude) of the largest wave on the seismogram (23 mm) and then th e distance to the focus using the time inter val between S and P waves (24 seconds). Next, draw a line between the distance scale (left) and the wave amplitude scale (right). By doing this, you should obtain the Richter magnitude (M L ) of S. (Data from Cali fornia Institute of Technology) )In 1902, Giuseppe Mercalli developed a more reliable intensity scale, which in a modified form is still used today. The Modified Mercalli Intensity Scale, shown in Table 6.1, was developed using California buildings as its standard. For example, if some well-built wood structures and most masonry buildings were destroyed by an earthquake, the affected area would be assigned an intensity of X (ten) on the Mercalli scale (Table 6.1). Despite their usefulness in providing seismologists with a tool to compare earthquake severity, intensity scales have significant drawbacks. Such intensity scales are based on effects (largely destruction) that depend not only on the severity of ground shaking but also on factors such as building design and the nature of surface materials. For example, the modest 6.9- magnitude 1988 Armenian earthquake mentioned earlier was extremely destructive, mainly because of inferior building practices. A quake that struck Mexico City in 1985 was deadly because of the soft sediment upon which part of the city rests. Thus, the destruction wrought by an earthquake is frequently not a good measure of the amount of energy that was unleashed. Magnitude Scales To more accurately compare earthquakes across the globe, a
- 9. measure was needed that does not rely on parameters that vary considerably from one part of the world to another. As a consequence, a number of magnitude scales were developed. Richter Magnitude In 1935 Charles Richter of the California Institute of Technology developed the first magnitude scale using seismic records. As shown in hgure 6.14 (top), the Richter scale is based on the amplitude of the largest seismic wave (P, S, or surface wave) recorded on a seismogram. Because seismic waves weaken as the distance between the focus and the seismograph increases, Richter developed a method that accounts for the decrease in wave amplitude with increasing distance. Theoretically, as long as equivalent instruments are used, monitoring stations at various locations will obtain the same Richter magnitude for each recorded earthquake. In practice, however, different recording stations often obtain slightly different Richter magnitudes for the same earthquake— a consequence of the variations in rock types through which the waves travel. Table 6.1 Modified Mercalli Intensity Scale I Not felt except by a very few under especially favorable circumstances. II Felt only by a few persons at rest, especially on upper floors of buildings. III Felt quite noticeably indoors, especially on upper floors of buildings, but many people do not recognize it as an earthquake. IV During the day felt indoors by many, outdoors by few. Sensation like heavy truck striking building. V Felt by nearly everyone, many awakened. Disturbances of trees, poles, and other tall objects sometimes noticed. VI Felt by all; many frightened and run outdoors. Some heavy furniture moved; few instances of fallen plaster or damaged chimneys. Damage slight. VII Everybody runs outdoors. Damage negligible in buildings of
- 10. good design and construction; slight-to-moderate in well-built ordinary structures; considerable in poorly built or badly designed structures. VIII Damage slight in specially designed structures; considerable in ordinary substantial buildings with partial collapse; great in poorly built structures. (Fall of chimneys, factory stacks, columns, monuments, walls.) IX Damage considerable in specially designed structures. Buildings shifted off foundations. Ground cracked conspicuously. X Some well-built wooden structures destroyed. Most masonry and frame structures destroyed. Ground badly cracked. XI Few, if any, (masonry) structures remain standing. Bridges destroyed. Broad fissures in ground. XII Damage total. Waves seen on ground surfaces. Objects thrown upward into air.