SlideShare a Scribd company logo
1 of 2
Download to read offline
NYSE WORLD LEADERS INDEX
NYSE INDEXES
                                                                             S
The NYSE World Leaders Index
takes the NYSE U.S. 100 and NYSE
International 100 Indexes and
combines them to form a global
index of 200 stocks.
With 100 of the New York Stock Exchange’s largest U.S.                     of the New York Stock Exchange and the methodology
company listings and 100 of its largest foreign company                    employed in creating and maintaining the NYSE U.S.
listings, the NYSE World Leaders Index has a float-                         100 and NYSE International 100 Indexes; specifically a
adjusted market cap of $11.8 trillion. This represents                     transparent, rules-based methodology including screens
65% of the market cap of all stocks listed on the NYSE.                    and buffers to ensure liquidity and low turnover. The
The NYSE World Leaders Index is a global index that                        end result is a stable, liquid index of 200 of the world’s
benefits from a combination of the high listing standards                   largest and well known companies providing geographic
                                                                           and sector diversification accessible via a single portal –
                                                                           the New York Stock Exchange.


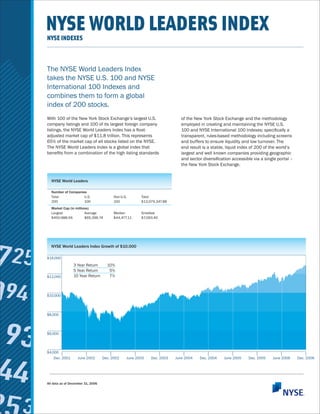
  NYSE World Leaders

  Number of Companies
  Total             U.S.                 Non-U.S.      Total
  200               100                  100           $13,079,347.88
  Market Cap (in millions)
  Largest              Average           Median        Smallest
  $450,988.56          $65,396.74        $44,477.11    $7,093.40


  NYSE World Leaders Index Growth of $10,000

$14,000
                3 Year Return        10%
                5 Year Return         5%
$12,000         10 Year Return        7%


$10,000


$8,000


$6,000


$4,000
    Dec. 2001      June 2002       Dec. 2002    June 2003   Dec. 2003   June 2004   Dec. 2004    June 2005    Dec. 2005   June 2006     Dec. 2006


All data as of December 31, 2006
NYSE INDEXES | NYSE WORLD LEADERS INDEX


             Morningstar Ownership Zone1
             Value     Core   Growth
                                                                                               S
                                                                         NYSE World Leaders Fundamentals
                                                                                                       2006         2005            2004          2003          2002
                                              The fund centroid
    Large


                                              represents weighted        Weighted EPS Growth           23.74        32.46           41.78         56.42        21.57
                                              average of domestic        Median EPS Growth             16.08        16.60           23.49         21.92        15.01
                                              stock holdings             Weighted Revenue Growth       13.65        18.53           15.02         12.44        3.15
    Medium


                                                                         Median Revenue Growth         11.44        12.28           10.83         10.54        3.76
                                              The Ownership
                                                                         Dividend Yield                2.41         2.45            2.26          2.20         2.28
                                              Zone represents 75%
                                              of fund’s domestic         Price to Book                 3.51         3.63            3.25          4.17         3.60
                                                                         PE                            16.62        17.22           19.97         26.61        23.26
    Small


                                              stock holdings
                                                                         Annual Total Return           22.11        13.04           12.74         29.30        -11.31
        *Ownership zone data is as of July 31st


             Risk Measures                                                                     Trailing Total Returns
                                                3 Year                         5 Year                                           %                         Growth $10K
             Standard Deviation                 2.02                          3.57             6-Month                          11.77                     $11,176.61
             Mean                               0.83                          0.49             1-Year                           17.36                     $11,735.91
             Sharpe Ratio                       0.29                          0.08             3-Year Annualized                10.14                     $13,359.65
                                                                                               5-Year Annualized                5.25                      $12,913.95
        *Risk Measures based on monthly returns
                                                                                               Annualized Since Inception       7.76                      $22,751.88


             Geographic Breakdown                                                              Regional Breakdown
             Country              Number             Available Market        Weight            Region/              Number          Available Market         Weight
                                  of Stocks          Cap (in millions)                         Country              of Stocks       Cap (in millions)
             Australia            5                  $208,521.45             1.59%             Europe               61              $4,135,848.00            31.6%
             Brazil               2                  $46,994.35              0.36%             Asia/Pacific          21              $1,091,845.54            8.3%
             Canada               14                 $464,894.85             3.55%             Latin America        3               $87,945.45               0.7%
             Chile                5                  $377,008.34             2.88%             Middle East/Africa   1               $17,474.64               0.1%
             China                2                  $50,280.60              0.38%                                  14
                                                                                               Canada                               $464,894.85              3.6%
             Finland              1                  $83,891.27              0.64%                                  100
                                                                                               United States                        $7,281,339.39            55.7%
             France               8                  $535,177.16             4.09%
             Germany              1                  $583,169.68             4.46%             Total                200             $13,079,347.88           100.00%
             Ireland              2                  $51,538.36              0.39%
             Italy                4                  $186,021.36             1.42%
             Japan                10                 $723,785.42             5.53%
             Mexico               1                  $40,951.10              0.31%
             Netherlands          6                  $299,563.66             2.29%             Top Ten Largest Companies
             Norway               2                  $39,017.68              0.30%
             South Africa         1                  $17,474.64              0.13%             Company                                                         Weight
             South Korea          3                  $65,340.54              0.50%             Exxon Mobil Corp.                                               3.45%
             Spain                5                  $355,406.05             2.72%             General Electric Co.                                            2.98%
             Taiwan               1                  $43,917.53              0.34%             Citigroup Inc.                                                  2.12%
             United Kingdom       19                 $1,625,054.43           12.42%            Bank of America Corp.                                           1.85%
             United States        100                $7,281,339.39           55.67%            BP PLC ADS                                                      1.67%
             Total                200                $13,079,347.88          100.00%           HSBC Holdings PLC ADS                                           1.62%
                                                                                               Procter & Gamble Co.                                            1.57%
                                                                                               Toyota Motor Corp. ADS                                          1.55%
                                                                                               Johnson & Johnson                                               1.47%
                                                                                               Pfizer Inc.                                                      1.44%
                                                                                               % Weight Top 10 Holdings                                        19.72%


    All data as of December 31, 2006 unless otherwise indicated.


1
    ®2007 Morningstar, Inc. All Rights Reserved. The information contained herein:          NYSE Euronext, Inc.
    (1) is proprietary to Morningstar and/or its content providers; (2) may not be          11 Wall Street
    copied or distributed; and (3) is not warranted to be accurate, complete or timely.     New York, NY 10005
    Neither Morningstar nor its content providers are responsible for any damages or        212.656.3000
    losses arising from any use of this information. Past performance is no guarantee       www.nyse.com
    of future results.

More Related Content

What's hot

dollar general annual reports 2002
dollar general annual reports 2002dollar general annual reports 2002
dollar general annual reports 2002finance41
 
brunswick annual reports 2005
brunswick annual reports 2005brunswick annual reports 2005
brunswick annual reports 2005finance36
 
BT Financial Monthly Market Chart - June 2010
BT Financial Monthly Market Chart - June 2010BT Financial Monthly Market Chart - June 2010
BT Financial Monthly Market Chart - June 2010BT Financial
 
Portfolio management
Portfolio managementPortfolio management
Portfolio managementHarsha Matta
 
Q1 2009 Earning Report of Northern Trust Corporation
Q1 2009 Earning Report of Northern Trust CorporationQ1 2009 Earning Report of Northern Trust Corporation
Q1 2009 Earning Report of Northern Trust Corporationearningreport earningreport
 
leggett & platt 2006_fin_add
leggett & platt 2006_fin_addleggett & platt 2006_fin_add
leggett & platt 2006_fin_addfinance39
 
Rethink The Way You Invest Wealth Smart Version
Rethink The Way You Invest Wealth Smart VersionRethink The Way You Invest Wealth Smart Version
Rethink The Way You Invest Wealth Smart Versionvetter
 
Banco ABC - 4th Quarter 2007 Earnings Presentation
Banco ABC - 4th Quarter 2007 Earnings PresentationBanco ABC - 4th Quarter 2007 Earnings Presentation
Banco ABC - 4th Quarter 2007 Earnings PresentationBanco ABC Brasil
 
allstate Quarterly Investor Information 2005 4th Earnings Press Release
allstate Quarterly Investor Information 2005 4th Earnings Press Releaseallstate Quarterly Investor Information 2005 4th Earnings Press Release
allstate Quarterly Investor Information 2005 4th Earnings Press Releasefinance7
 
Progressive-3Q06QSR
Progressive-3Q06QSRProgressive-3Q06QSR
Progressive-3Q06QSRfinance18
 
Moneyweb Investment Seminars - David Shapiro
Moneyweb Investment Seminars - David ShapiroMoneyweb Investment Seminars - David Shapiro
Moneyweb Investment Seminars - David Shapiromoneyweb
 
Theories of international trade
Theories of international tradeTheories of international trade
Theories of international trademeg03
 

What's hot (15)

Tom Russo VIF 2009.
Tom Russo VIF 2009.Tom Russo VIF 2009.
Tom Russo VIF 2009.
 
Intl fin mkts chap iii
Intl fin mkts chap iiiIntl fin mkts chap iii
Intl fin mkts chap iii
 
dollar general annual reports 2002
dollar general annual reports 2002dollar general annual reports 2002
dollar general annual reports 2002
 
brunswick annual reports 2005
brunswick annual reports 2005brunswick annual reports 2005
brunswick annual reports 2005
 
BT Financial Monthly Market Chart - June 2010
BT Financial Monthly Market Chart - June 2010BT Financial Monthly Market Chart - June 2010
BT Financial Monthly Market Chart - June 2010
 
Houston Market Report April 2010
Houston Market Report April 2010Houston Market Report April 2010
Houston Market Report April 2010
 
Portfolio management
Portfolio managementPortfolio management
Portfolio management
 
Q1 2009 Earning Report of Northern Trust Corporation
Q1 2009 Earning Report of Northern Trust CorporationQ1 2009 Earning Report of Northern Trust Corporation
Q1 2009 Earning Report of Northern Trust Corporation
 
leggett & platt 2006_fin_add
leggett & platt 2006_fin_addleggett & platt 2006_fin_add
leggett & platt 2006_fin_add
 
Rethink The Way You Invest Wealth Smart Version
Rethink The Way You Invest Wealth Smart VersionRethink The Way You Invest Wealth Smart Version
Rethink The Way You Invest Wealth Smart Version
 
Banco ABC - 4th Quarter 2007 Earnings Presentation
Banco ABC - 4th Quarter 2007 Earnings PresentationBanco ABC - 4th Quarter 2007 Earnings Presentation
Banco ABC - 4th Quarter 2007 Earnings Presentation
 
allstate Quarterly Investor Information 2005 4th Earnings Press Release
allstate Quarterly Investor Information 2005 4th Earnings Press Releaseallstate Quarterly Investor Information 2005 4th Earnings Press Release
allstate Quarterly Investor Information 2005 4th Earnings Press Release
 
Progressive-3Q06QSR
Progressive-3Q06QSRProgressive-3Q06QSR
Progressive-3Q06QSR
 
Moneyweb Investment Seminars - David Shapiro
Moneyweb Investment Seminars - David ShapiroMoneyweb Investment Seminars - David Shapiro
Moneyweb Investment Seminars - David Shapiro
 
Theories of international trade
Theories of international tradeTheories of international trade
Theories of international trade
 

Similar to World Leaders Brochure

northan trust corp.2005SummaryAnnual
northan trust corp.2005SummaryAnnualnorthan trust corp.2005SummaryAnnual
northan trust corp.2005SummaryAnnualfinance38
 
WorldFuel 2003AnnualReport
WorldFuel 2003AnnualReportWorldFuel 2003AnnualReport
WorldFuel 2003AnnualReportfinance19
 
WorldFuel 2003AnnualReport
WorldFuel 2003AnnualReportWorldFuel 2003AnnualReport
WorldFuel 2003AnnualReportfinance19
 
northan trust corp._Financial_web_2006
northan trust corp._Financial_web_2006northan trust corp._Financial_web_2006
northan trust corp._Financial_web_2006finance38
 
Progressive 1Q 04 QSR
Progressive 1Q 04 QSRProgressive 1Q 04 QSR
Progressive 1Q 04 QSRfinance18
 
Progressive 1Q 04 QSR
Progressive 1Q 04 QSRProgressive 1Q 04 QSR
Progressive 1Q 04 QSRfinance18
 
northan trust corp.FINALNTSummary
northan trust corp.FINALNTSummarynorthan trust corp.FINALNTSummary
northan trust corp.FINALNTSummaryfinance38
 
brunswick annual reports 2006
brunswick annual reports 2006brunswick annual reports 2006
brunswick annual reports 2006finance36
 
Progressive 2Q04 QSR
Progressive  2Q04 QSRProgressive  2Q04 QSR
Progressive 2Q04 QSRfinance18
 
Progressive 2Q04 QSR
Progressive 2Q04 QSRProgressive 2Q04 QSR
Progressive 2Q04 QSRfinance18
 
WorldFuel 2002 Transition AnnualReport
WorldFuel 2002 Transition AnnualReportWorldFuel 2002 Transition AnnualReport
WorldFuel 2002 Transition AnnualReportfinance19
 
WorldFuel2002 Transition Annual Report
WorldFuel2002 Transition Annual ReportWorldFuel2002 Transition Annual Report
WorldFuel2002 Transition Annual Reportfinance19
 
HCL Technologies financial reports
HCL Technologies financial reportsHCL Technologies financial reports
HCL Technologies financial reportsParnavi Chakraborty
 
Progressive 3Q 04 QSR
Progressive 3Q 04 QSRProgressive 3Q 04 QSR
Progressive 3Q 04 QSRfinance18
 
coventry health care annual reports 2007
coventry health care annual reports 2007coventry health care annual reports 2007
coventry health care annual reports 2007finance27
 
leggett & platt 2006_fin_add
leggett & platt 2006_fin_addleggett & platt 2006_fin_add
leggett & platt 2006_fin_addfinance39
 
Julho-2008 Theodore M. Helms, Marcos Vinicius Guimarães - Petrobras at a gla...
Julho-2008 Theodore M. Helms, Marcos Vinicius Guimarães -  Petrobras at a gla...Julho-2008 Theodore M. Helms, Marcos Vinicius Guimarães -  Petrobras at a gla...
Julho-2008 Theodore M. Helms, Marcos Vinicius Guimarães - Petrobras at a gla...Petrobras
 
c.h. robinson worldwide_ar07a
c.h. robinson worldwide_ar07ac.h. robinson worldwide_ar07a
c.h. robinson worldwide_ar07afinance31
 

Similar to World Leaders Brochure (20)

northan trust corp.2005SummaryAnnual
northan trust corp.2005SummaryAnnualnorthan trust corp.2005SummaryAnnual
northan trust corp.2005SummaryAnnual
 
WorldFuel 2003AnnualReport
WorldFuel 2003AnnualReportWorldFuel 2003AnnualReport
WorldFuel 2003AnnualReport
 
WorldFuel 2003AnnualReport
WorldFuel 2003AnnualReportWorldFuel 2003AnnualReport
WorldFuel 2003AnnualReport
 
Annual Report 2009
Annual Report 2009Annual Report 2009
Annual Report 2009
 
northan trust corp._Financial_web_2006
northan trust corp._Financial_web_2006northan trust corp._Financial_web_2006
northan trust corp._Financial_web_2006
 
Progressive 1Q 04 QSR
Progressive 1Q 04 QSRProgressive 1Q 04 QSR
Progressive 1Q 04 QSR
 
Progressive 1Q 04 QSR
Progressive 1Q 04 QSRProgressive 1Q 04 QSR
Progressive 1Q 04 QSR
 
northan trust corp.FINALNTSummary
northan trust corp.FINALNTSummarynorthan trust corp.FINALNTSummary
northan trust corp.FINALNTSummary
 
brunswick annual reports 2006
brunswick annual reports 2006brunswick annual reports 2006
brunswick annual reports 2006
 
Progressive 2Q04 QSR
Progressive  2Q04 QSRProgressive  2Q04 QSR
Progressive 2Q04 QSR
 
Progressive 2Q04 QSR
Progressive 2Q04 QSRProgressive 2Q04 QSR
Progressive 2Q04 QSR
 
WorldFuel 2002 Transition AnnualReport
WorldFuel 2002 Transition AnnualReportWorldFuel 2002 Transition AnnualReport
WorldFuel 2002 Transition AnnualReport
 
WorldFuel2002 Transition Annual Report
WorldFuel2002 Transition Annual ReportWorldFuel2002 Transition Annual Report
WorldFuel2002 Transition Annual Report
 
HCL Technologies financial reports
HCL Technologies financial reportsHCL Technologies financial reports
HCL Technologies financial reports
 
Progressive 3Q 04 QSR
Progressive 3Q 04 QSRProgressive 3Q 04 QSR
Progressive 3Q 04 QSR
 
coventry health care annual reports 2007
coventry health care annual reports 2007coventry health care annual reports 2007
coventry health care annual reports 2007
 
leggett & platt 2006_fin_add
leggett & platt 2006_fin_addleggett & platt 2006_fin_add
leggett & platt 2006_fin_add
 
Julho-2008 Theodore M. Helms, Marcos Vinicius Guimarães - Petrobras at a gla...
Julho-2008 Theodore M. Helms, Marcos Vinicius Guimarães -  Petrobras at a gla...Julho-2008 Theodore M. Helms, Marcos Vinicius Guimarães -  Petrobras at a gla...
Julho-2008 Theodore M. Helms, Marcos Vinicius Guimarães - Petrobras at a gla...
 
chrw ar07a
chrw ar07achrw ar07a
chrw ar07a
 
c.h. robinson worldwide_ar07a
c.h. robinson worldwide_ar07ac.h. robinson worldwide_ar07a
c.h. robinson worldwide_ar07a
 

Recently uploaded

Cash Payment 9602870969 Escort Service in Udaipur Call Girls
Cash Payment 9602870969 Escort Service in Udaipur Call GirlsCash Payment 9602870969 Escort Service in Udaipur Call Girls
Cash Payment 9602870969 Escort Service in Udaipur Call GirlsApsara Of India
 
Sales & Marketing Alignment: How to Synergize for Success
Sales & Marketing Alignment: How to Synergize for SuccessSales & Marketing Alignment: How to Synergize for Success
Sales & Marketing Alignment: How to Synergize for SuccessAggregage
 
Tech Startup Growth Hacking 101 - Basics on Growth Marketing
Tech Startup Growth Hacking 101  - Basics on Growth MarketingTech Startup Growth Hacking 101  - Basics on Growth Marketing
Tech Startup Growth Hacking 101 - Basics on Growth MarketingShawn Pang
 
VIP Call Girl Jamshedpur Aashi 8250192130 Independent Escort Service Jamshedpur
VIP Call Girl Jamshedpur Aashi 8250192130 Independent Escort Service JamshedpurVIP Call Girl Jamshedpur Aashi 8250192130 Independent Escort Service Jamshedpur
VIP Call Girl Jamshedpur Aashi 8250192130 Independent Escort Service JamshedpurSuhani Kapoor
 
Pitch Deck Teardown: NOQX's $200k Pre-seed deck
Pitch Deck Teardown: NOQX's $200k Pre-seed deckPitch Deck Teardown: NOQX's $200k Pre-seed deck
Pitch Deck Teardown: NOQX's $200k Pre-seed deckHajeJanKamps
 
Call Girls In Sikandarpur Gurgaon ❤️8860477959_Russian 100% Genuine Escorts I...
Call Girls In Sikandarpur Gurgaon ❤️8860477959_Russian 100% Genuine Escorts I...Call Girls In Sikandarpur Gurgaon ❤️8860477959_Russian 100% Genuine Escorts I...
Call Girls In Sikandarpur Gurgaon ❤️8860477959_Russian 100% Genuine Escorts I...lizamodels9
 
Lowrate Call Girls In Sector 18 Noida ❤️8860477959 Escorts 100% Genuine Servi...
Lowrate Call Girls In Sector 18 Noida ❤️8860477959 Escorts 100% Genuine Servi...Lowrate Call Girls In Sector 18 Noida ❤️8860477959 Escorts 100% Genuine Servi...
Lowrate Call Girls In Sector 18 Noida ❤️8860477959 Escorts 100% Genuine Servi...lizamodels9
 
CATALOG cáp điện Goldcup (bảng giá) 1.4.2024.PDF
CATALOG cáp điện Goldcup (bảng giá) 1.4.2024.PDFCATALOG cáp điện Goldcup (bảng giá) 1.4.2024.PDF
CATALOG cáp điện Goldcup (bảng giá) 1.4.2024.PDFOrient Homes
 
M.C Lodges -- Guest House in Jhang.
M.C Lodges --  Guest House in Jhang.M.C Lodges --  Guest House in Jhang.
M.C Lodges -- Guest House in Jhang.Aaiza Hassan
 
(8264348440) 🔝 Call Girls In Keshav Puram 🔝 Delhi NCR
(8264348440) 🔝 Call Girls In Keshav Puram 🔝 Delhi NCR(8264348440) 🔝 Call Girls In Keshav Puram 🔝 Delhi NCR
(8264348440) 🔝 Call Girls In Keshav Puram 🔝 Delhi NCRsoniya singh
 
VIP Kolkata Call Girl Howrah 👉 8250192130 Available With Room
VIP Kolkata Call Girl Howrah 👉 8250192130  Available With RoomVIP Kolkata Call Girl Howrah 👉 8250192130  Available With Room
VIP Kolkata Call Girl Howrah 👉 8250192130 Available With Roomdivyansh0kumar0
 
RE Capital's Visionary Leadership under Newman Leech
RE Capital's Visionary Leadership under Newman LeechRE Capital's Visionary Leadership under Newman Leech
RE Capital's Visionary Leadership under Newman LeechNewman George Leech
 
Call Girls in DELHI Cantt, ( Call Me )-8377877756-Female Escort- In Delhi / Ncr
Call Girls in DELHI Cantt, ( Call Me )-8377877756-Female Escort- In Delhi / NcrCall Girls in DELHI Cantt, ( Call Me )-8377877756-Female Escort- In Delhi / Ncr
Call Girls in DELHI Cantt, ( Call Me )-8377877756-Female Escort- In Delhi / Ncrdollysharma2066
 
The CMO Survey - Highlights and Insights Report - Spring 2024
The CMO Survey - Highlights and Insights Report - Spring 2024The CMO Survey - Highlights and Insights Report - Spring 2024
The CMO Survey - Highlights and Insights Report - Spring 2024christinemoorman
 
Vip Female Escorts Noida 9711199171 Greater Noida Escorts Service
Vip Female Escorts Noida 9711199171 Greater Noida Escorts ServiceVip Female Escorts Noida 9711199171 Greater Noida Escorts Service
Vip Female Escorts Noida 9711199171 Greater Noida Escorts Serviceankitnayak356677
 
Islamabad Escorts | Call 03274100048 | Escort Service in Islamabad
Islamabad Escorts | Call 03274100048 | Escort Service in IslamabadIslamabad Escorts | Call 03274100048 | Escort Service in Islamabad
Islamabad Escorts | Call 03274100048 | Escort Service in IslamabadAyesha Khan
 
Call Girls In Sikandarpur Gurgaon ❤️8860477959_Russian 100% Genuine Escorts I...
Call Girls In Sikandarpur Gurgaon ❤️8860477959_Russian 100% Genuine Escorts I...Call Girls In Sikandarpur Gurgaon ❤️8860477959_Russian 100% Genuine Escorts I...
Call Girls In Sikandarpur Gurgaon ❤️8860477959_Russian 100% Genuine Escorts I...lizamodels9
 
Lean: From Theory to Practice — One City’s (and Library’s) Lean Story… Abridged
Lean: From Theory to Practice — One City’s (and Library’s) Lean Story… AbridgedLean: From Theory to Practice — One City’s (and Library’s) Lean Story… Abridged
Lean: From Theory to Practice — One City’s (and Library’s) Lean Story… AbridgedKaiNexus
 
2024 Numerator Consumer Study of Cannabis Usage
2024 Numerator Consumer Study of Cannabis Usage2024 Numerator Consumer Study of Cannabis Usage
2024 Numerator Consumer Study of Cannabis UsageNeil Kimberley
 
Investment analysis and portfolio management
Investment analysis and portfolio managementInvestment analysis and portfolio management
Investment analysis and portfolio managementJunaidKhan750825
 

Recently uploaded (20)

Cash Payment 9602870969 Escort Service in Udaipur Call Girls
Cash Payment 9602870969 Escort Service in Udaipur Call GirlsCash Payment 9602870969 Escort Service in Udaipur Call Girls
Cash Payment 9602870969 Escort Service in Udaipur Call Girls
 
Sales & Marketing Alignment: How to Synergize for Success
Sales & Marketing Alignment: How to Synergize for SuccessSales & Marketing Alignment: How to Synergize for Success
Sales & Marketing Alignment: How to Synergize for Success
 
Tech Startup Growth Hacking 101 - Basics on Growth Marketing
Tech Startup Growth Hacking 101  - Basics on Growth MarketingTech Startup Growth Hacking 101  - Basics on Growth Marketing
Tech Startup Growth Hacking 101 - Basics on Growth Marketing
 
VIP Call Girl Jamshedpur Aashi 8250192130 Independent Escort Service Jamshedpur
VIP Call Girl Jamshedpur Aashi 8250192130 Independent Escort Service JamshedpurVIP Call Girl Jamshedpur Aashi 8250192130 Independent Escort Service Jamshedpur
VIP Call Girl Jamshedpur Aashi 8250192130 Independent Escort Service Jamshedpur
 
Pitch Deck Teardown: NOQX's $200k Pre-seed deck
Pitch Deck Teardown: NOQX's $200k Pre-seed deckPitch Deck Teardown: NOQX's $200k Pre-seed deck
Pitch Deck Teardown: NOQX's $200k Pre-seed deck
 
Call Girls In Sikandarpur Gurgaon ❤️8860477959_Russian 100% Genuine Escorts I...
Call Girls In Sikandarpur Gurgaon ❤️8860477959_Russian 100% Genuine Escorts I...Call Girls In Sikandarpur Gurgaon ❤️8860477959_Russian 100% Genuine Escorts I...
Call Girls In Sikandarpur Gurgaon ❤️8860477959_Russian 100% Genuine Escorts I...
 
Lowrate Call Girls In Sector 18 Noida ❤️8860477959 Escorts 100% Genuine Servi...
Lowrate Call Girls In Sector 18 Noida ❤️8860477959 Escorts 100% Genuine Servi...Lowrate Call Girls In Sector 18 Noida ❤️8860477959 Escorts 100% Genuine Servi...
Lowrate Call Girls In Sector 18 Noida ❤️8860477959 Escorts 100% Genuine Servi...
 
CATALOG cáp điện Goldcup (bảng giá) 1.4.2024.PDF
CATALOG cáp điện Goldcup (bảng giá) 1.4.2024.PDFCATALOG cáp điện Goldcup (bảng giá) 1.4.2024.PDF
CATALOG cáp điện Goldcup (bảng giá) 1.4.2024.PDF
 
M.C Lodges -- Guest House in Jhang.
M.C Lodges --  Guest House in Jhang.M.C Lodges --  Guest House in Jhang.
M.C Lodges -- Guest House in Jhang.
 
(8264348440) 🔝 Call Girls In Keshav Puram 🔝 Delhi NCR
(8264348440) 🔝 Call Girls In Keshav Puram 🔝 Delhi NCR(8264348440) 🔝 Call Girls In Keshav Puram 🔝 Delhi NCR
(8264348440) 🔝 Call Girls In Keshav Puram 🔝 Delhi NCR
 
VIP Kolkata Call Girl Howrah 👉 8250192130 Available With Room
VIP Kolkata Call Girl Howrah 👉 8250192130  Available With RoomVIP Kolkata Call Girl Howrah 👉 8250192130  Available With Room
VIP Kolkata Call Girl Howrah 👉 8250192130 Available With Room
 
RE Capital's Visionary Leadership under Newman Leech
RE Capital's Visionary Leadership under Newman LeechRE Capital's Visionary Leadership under Newman Leech
RE Capital's Visionary Leadership under Newman Leech
 
Call Girls in DELHI Cantt, ( Call Me )-8377877756-Female Escort- In Delhi / Ncr
Call Girls in DELHI Cantt, ( Call Me )-8377877756-Female Escort- In Delhi / NcrCall Girls in DELHI Cantt, ( Call Me )-8377877756-Female Escort- In Delhi / Ncr
Call Girls in DELHI Cantt, ( Call Me )-8377877756-Female Escort- In Delhi / Ncr
 
The CMO Survey - Highlights and Insights Report - Spring 2024
The CMO Survey - Highlights and Insights Report - Spring 2024The CMO Survey - Highlights and Insights Report - Spring 2024
The CMO Survey - Highlights and Insights Report - Spring 2024
 
Vip Female Escorts Noida 9711199171 Greater Noida Escorts Service
Vip Female Escorts Noida 9711199171 Greater Noida Escorts ServiceVip Female Escorts Noida 9711199171 Greater Noida Escorts Service
Vip Female Escorts Noida 9711199171 Greater Noida Escorts Service
 
Islamabad Escorts | Call 03274100048 | Escort Service in Islamabad
Islamabad Escorts | Call 03274100048 | Escort Service in IslamabadIslamabad Escorts | Call 03274100048 | Escort Service in Islamabad
Islamabad Escorts | Call 03274100048 | Escort Service in Islamabad
 
Call Girls In Sikandarpur Gurgaon ❤️8860477959_Russian 100% Genuine Escorts I...
Call Girls In Sikandarpur Gurgaon ❤️8860477959_Russian 100% Genuine Escorts I...Call Girls In Sikandarpur Gurgaon ❤️8860477959_Russian 100% Genuine Escorts I...
Call Girls In Sikandarpur Gurgaon ❤️8860477959_Russian 100% Genuine Escorts I...
 
Lean: From Theory to Practice — One City’s (and Library’s) Lean Story… Abridged
Lean: From Theory to Practice — One City’s (and Library’s) Lean Story… AbridgedLean: From Theory to Practice — One City’s (and Library’s) Lean Story… Abridged
Lean: From Theory to Practice — One City’s (and Library’s) Lean Story… Abridged
 
2024 Numerator Consumer Study of Cannabis Usage
2024 Numerator Consumer Study of Cannabis Usage2024 Numerator Consumer Study of Cannabis Usage
2024 Numerator Consumer Study of Cannabis Usage
 
Investment analysis and portfolio management
Investment analysis and portfolio managementInvestment analysis and portfolio management
Investment analysis and portfolio management
 

World Leaders Brochure

  • 1. NYSE WORLD LEADERS INDEX NYSE INDEXES S The NYSE World Leaders Index takes the NYSE U.S. 100 and NYSE International 100 Indexes and combines them to form a global index of 200 stocks. With 100 of the New York Stock Exchange’s largest U.S. of the New York Stock Exchange and the methodology company listings and 100 of its largest foreign company employed in creating and maintaining the NYSE U.S. listings, the NYSE World Leaders Index has a float- 100 and NYSE International 100 Indexes; specifically a adjusted market cap of $11.8 trillion. This represents transparent, rules-based methodology including screens 65% of the market cap of all stocks listed on the NYSE. and buffers to ensure liquidity and low turnover. The The NYSE World Leaders Index is a global index that end result is a stable, liquid index of 200 of the world’s benefits from a combination of the high listing standards largest and well known companies providing geographic and sector diversification accessible via a single portal – the New York Stock Exchange. NYSE World Leaders Number of Companies Total U.S. Non-U.S. Total 200 100 100 $13,079,347.88 Market Cap (in millions) Largest Average Median Smallest $450,988.56 $65,396.74 $44,477.11 $7,093.40 NYSE World Leaders Index Growth of $10,000 $14,000 3 Year Return 10% 5 Year Return 5% $12,000 10 Year Return 7% $10,000 $8,000 $6,000 $4,000 Dec. 2001 June 2002 Dec. 2002 June 2003 Dec. 2003 June 2004 Dec. 2004 June 2005 Dec. 2005 June 2006 Dec. 2006 All data as of December 31, 2006
  • 2. NYSE INDEXES | NYSE WORLD LEADERS INDEX Morningstar Ownership Zone1 Value Core Growth S NYSE World Leaders Fundamentals 2006 2005 2004 2003 2002 The fund centroid Large represents weighted Weighted EPS Growth 23.74 32.46 41.78 56.42 21.57 average of domestic Median EPS Growth 16.08 16.60 23.49 21.92 15.01 stock holdings Weighted Revenue Growth 13.65 18.53 15.02 12.44 3.15 Medium Median Revenue Growth 11.44 12.28 10.83 10.54 3.76 The Ownership Dividend Yield 2.41 2.45 2.26 2.20 2.28 Zone represents 75% of fund’s domestic Price to Book 3.51 3.63 3.25 4.17 3.60 PE 16.62 17.22 19.97 26.61 23.26 Small stock holdings Annual Total Return 22.11 13.04 12.74 29.30 -11.31 *Ownership zone data is as of July 31st Risk Measures Trailing Total Returns 3 Year 5 Year % Growth $10K Standard Deviation 2.02 3.57 6-Month 11.77 $11,176.61 Mean 0.83 0.49 1-Year 17.36 $11,735.91 Sharpe Ratio 0.29 0.08 3-Year Annualized 10.14 $13,359.65 5-Year Annualized 5.25 $12,913.95 *Risk Measures based on monthly returns Annualized Since Inception 7.76 $22,751.88 Geographic Breakdown Regional Breakdown Country Number Available Market Weight Region/ Number Available Market Weight of Stocks Cap (in millions) Country of Stocks Cap (in millions) Australia 5 $208,521.45 1.59% Europe 61 $4,135,848.00 31.6% Brazil 2 $46,994.35 0.36% Asia/Pacific 21 $1,091,845.54 8.3% Canada 14 $464,894.85 3.55% Latin America 3 $87,945.45 0.7% Chile 5 $377,008.34 2.88% Middle East/Africa 1 $17,474.64 0.1% China 2 $50,280.60 0.38% 14 Canada $464,894.85 3.6% Finland 1 $83,891.27 0.64% 100 United States $7,281,339.39 55.7% France 8 $535,177.16 4.09% Germany 1 $583,169.68 4.46% Total 200 $13,079,347.88 100.00% Ireland 2 $51,538.36 0.39% Italy 4 $186,021.36 1.42% Japan 10 $723,785.42 5.53% Mexico 1 $40,951.10 0.31% Netherlands 6 $299,563.66 2.29% Top Ten Largest Companies Norway 2 $39,017.68 0.30% South Africa 1 $17,474.64 0.13% Company Weight South Korea 3 $65,340.54 0.50% Exxon Mobil Corp. 3.45% Spain 5 $355,406.05 2.72% General Electric Co. 2.98% Taiwan 1 $43,917.53 0.34% Citigroup Inc. 2.12% United Kingdom 19 $1,625,054.43 12.42% Bank of America Corp. 1.85% United States 100 $7,281,339.39 55.67% BP PLC ADS 1.67% Total 200 $13,079,347.88 100.00% HSBC Holdings PLC ADS 1.62% Procter & Gamble Co. 1.57% Toyota Motor Corp. ADS 1.55% Johnson & Johnson 1.47% Pfizer Inc. 1.44% % Weight Top 10 Holdings 19.72% All data as of December 31, 2006 unless otherwise indicated. 1 ®2007 Morningstar, Inc. All Rights Reserved. The information contained herein: NYSE Euronext, Inc. (1) is proprietary to Morningstar and/or its content providers; (2) may not be 11 Wall Street copied or distributed; and (3) is not warranted to be accurate, complete or timely. New York, NY 10005 Neither Morningstar nor its content providers are responsible for any damages or 212.656.3000 losses arising from any use of this information. Past performance is no guarantee www.nyse.com of future results.