Calgary Church Appraisal Report
•
1 like•653 views

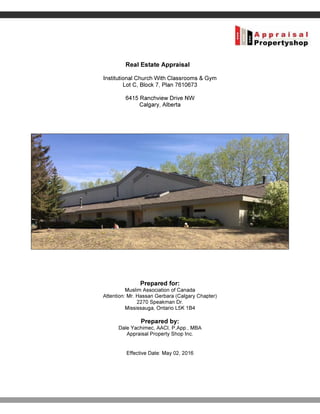
Real estate appraisal of the following property: Institutional Church With Classrooms & Gym Located at: 6415 Ranchview Drive NW Calgary, Alberta which the Muslim Association of Canada is fundraising to purchase it to establish Al-Salam Centre.

Recommended
Recommended
More Related Content
Similar to Calgary Church Appraisal Report
Similar to Calgary Church Appraisal Report (10)
Recently uploaded
Recently uploaded (20)
Calgary Church Appraisal Report
- 1. Real Estate Appraisal Institutional Church With Classrooms & Gym Lot C, Block 7, Plan 7610673 6415 Ranchview Drive NW Calgary, Alberta Prepared for: Muslim Association of Canada Attention: Mr. Hassan Gerbara (Calgary Chapter) 2270 Speakman Dr. Mississauga, Ontario L5K 1B4 Prepared by: Dale Yachimec, AACI, P.App., MBA Appraisal Property Shop Inc. Effective Date: May 02, 2016
- 2. Page 2 Appraisal Property Shop Inc. 7239A Flint Road SE Calgary, Alberta, T2Z 2X1 Ph.: 403.767.9999 • Fax: 1.888.845.2886 Email: karen.barry@appraisalpropertyshop.com Our Invoice No. #6261002 Client File No. May 11, 2016 Muslim Association of Canada 2270 Speakman Dr. Mississauga, Ontario L5K 1B4 Attention: Hassan Gerbara (Calgary Chapter) RE: Current Real Estate Appraisal Presented in a Full Narrative Report of the Institutional Church Located at 6415 Ranchview Drive NW, Calgary, Alberta Dear Mr. Gerbara: As requested, the above referenced property has been examined for factors deemed pertinent in arriving at an estimated market value. The purpose of this appraisal is to estimate the Current Market Value of the Fee Simple Interest of the above property legally described as Lot C, Block 7, Plan 7610673. The following pages constitute my appraisal report, including the data and analyses utilized in forming an estimate of market value, which is summarized in the Executive Summary of Salient Facts and Conclusions section of the appraisal report. This appraisal report was requested by Hussan Gerbara on behalf of the Muslim Association of Canada for confirmation of the property value in relation to a pending offer to purchase the property and for first mortgage financing purposes following purchase of the property. Therefore, the client and intended user of this report is who requested this appraisal report, or the Muslim Association of Canada, Calgary Chapter, Attention: Hussan Gerbara and the selected financial institution identified in a separate transmittal letter signed by the Appraiser. In order to carry out this assignment, the subject property was inspected on May 02, 2016 and a market study of real estate activity in the vicinity of the subject property has been conducted. This investigation included the collection and analysis of real estate market transactions, listings, offerings and information pertaining to other transactions that have occurred in the area in the recent past. Based upon the data, analyses and conclusions contained in this report, the following Current Market Value estimate has been concluded effective May 02, 2016. * - See Extraordinary Assumptions & Hypothetical/Limiting Conditions
- 3. Page 3 The estimated market value stated above, as well as every other element of this appraisal, are qualified in their entirety by the Fundamental Assumptions and Limiting Conditions set forth in this report, which are an integral part of this appraisal. Should you have any questions concerning this report, please do not hesitate to call me directly at 780-902-2522. Respectfully submitted, Dale Yachimec, AACI, P.App., MBA Appraisal Property Shop Inc. Inspected Property: _√_Yes __No
- 4. Page 4 TABLE OF CONTENTS Page Title Page........................................................................................................................................ 1 Cover Letter .................................................................................................................................... 2 Table of Contents............................................................................................................................ 4 INTRODUCTION ................................................................................................................................................5 EXECUTIVE SUMMARY OF SALIENT FACTS AND CONCLUSIONS.........................................................5 FUNDAMENTAL ASSUMPTIONS AND LIMITING CONDITIONS................................................................6 EXTRAORDINARY ASSUMPTIONS & HYPOTHETICAL/LIMITING CONDITIONS ....................................8 EFFECTIVE DATE OF THE APPRAISAL/DATE OF THE REPORT .............................................................9 PURPOSE OF THE APPRAISAL...................................................................................................................9 INTENDED USE OF THE APPRAISAL..........................................................................................................9 PROPERTY RIGHTS DEFINED.....................................................................................................................9 LOCAL MARKET AREA DEFINED ...............................................................................................................9 ARMS LENGTH TRANSACTION DEFINED..................................................................................................9 MARKET VALUE DEFINED.........................................................................................................................10 EXPOSURE PERIOD DEFINED ..................................................................................................................10 PROPERTY RIGHTS APPRAISED..............................................................................................................11 PROPERTY IDENTIFICATION ....................................................................................................................11 SCOPE OF THE APPRAISAL......................................................................................................................11 FACTUAL DATA...............................................................................................................................................12 REGIONAL/MUNICIPAL ECONOMIC ANALYSIS......................................................................................12 ALBERTA ECONOMIC ANALYSIS..........................................................................................................12 CITY OF CALGARY/RANCHLANDS DISTRICT AREA ANALYSIS ........................................................18 MARKET AREA ANALYSIS ........................................................................................................................25 SITE DESCRIPTION & ANALYSIS..............................................................................................................26 TAXES AND ASSESSMENT INFORMATION .............................................................................................30 OWNERSHIP/SALES HISTORY..................................................................................................................30 TITLE ENCUMBRANCES............................................................................................................................31 MUNICIPAL PLANNING & LAND USE OVERVIEW ...................................................................................32 IMPROVEMENTS DESCRIPTION ...............................................................................................................35 ANALYSIS OF DATA AND OPINIONS OF THE APPRAISER ........................................................................37 HIGHEST AND BEST USE ANALYSIS .......................................................................................................37 APPRAISAL METHODOLOGY....................................................................................................................39 COST APPROACH ......................................................................................................................................40 DIRECT COMPARISON APPROACH TO VALUE ......................................................................................59 RECONCILIATION AND SUMMARY OF THE FINAL MARKET VALUE ESTIMATE.................................72 CERTIFICATION OF APPRAISER ..............................................................................................................74 ADDENDA ........................................................................................................................................................76 Exhibit Subject Photographs...................................................................................................................................A Title Certificate .............................................................................................................................................B Land use Bylaw............................................................................................................................................C
- 5. Page 5 INTRODUCTION EXECUTIVE SUMMARY OF SALIENT FACTS AND CONCLUSIONS Client: Muslim Association of Canada, Attention: Hussan Gerbara (Calgary Chapter) Property Owner: The Reorganized Church of Jesus Christ of Latter Day Saints (Canada) Intended Use and User(s): For confirmation of the property value and first mortgage financing purposes following the purchase of the property by the client, or the Muslim Association of Canada, Attention: Hussan Gerbara (Calgary Chapter) and the selected financial institution as identified in a separate transmittal letter signed by the Appraiser Property Address: 6415 Ranchview Drive NW, Calgary, Alberta Legal Address: Lot C, Block 7, Plan 7610673 Property Type/Use: Institutional Church With School Classrooms & Gym Land Use Designation/Zoning: S-CI – Special Purpose - Community Institution Inspection Date: May 02, 2016 Effective Date of Appraisal: May 02, 2016 Report Date: May 11, 2016 Property Rights Appraised: Fee Simple Interest Classification of Report and Appraisal: Current Market Value Presented in a Full Narrative Report Land Size: 1.35 Acres, or 58,806 Square Feet Gross Building Footprint Area: 14,275 Square Feet Gross Usable Area: 15,287 Square Feet, Includes Developed Mezzanine Office Space Highest and Best Use as Vacant: Public/Institutional Usage Highest and Best Use as Improved: Community Church and Children's School * - See Extraordinary Assumptions & Hypothetical/Limiting Conditions Exposure Time (as defined in this report): 12 to 15 months given market conditions within Calgary, the larger size of the church and observed exposure periods of similar sized churches that have recently sold within Calgary
- 6. Page 6 FUNDAMENTAL ASSUMPTIONS AND LIMITING CONDITIONS The certification of the appraiser in this appraisal report is subject to the following assumptions and limiting conditions and any other specific conditions set forth by the appraiser elsewhere in the report. General 1. The effective date to which the opinions expressed in this report apply is set forth in the Cover Letter. The appraiser assumes no responsibility for economic or physical factors occurring at some later date that may affect the opinions stated herein. No opinion is expressed regarding legal matters that require specialized investigation or knowledge beyond that ordinarily employed by real estate appraisers. 2. Information, estimates, and opinions contained in this report were obtained from sources considered reliable and believed to be true and correct. However, the appraiser assumes no responsibility for accuracy of such items furnished by the appraiser obtained from other parties. 3. The appraiser assumes no responsibility for legal matters affecting the property appraised or the title thereto, nor does the appraiser render any opinion as to the title, which is assumed to be marketable. The property is appraised as though under responsible ownership and management and free and clear of any or all liens or encumbrances unless otherwise stated. 4. The appraiser is not required to give testimony or appear in court because of having prepared this appraisal of the subject property unless arrangements have been made otherwise. 5. Disclosure of the contents of this appraisal is governed by the by-laws and regulations of the professional appraisal organizations with which the appraiser is affiliated. 6. Neither all nor any part of the contents of this report or copy thereof (including conclusions as to property value, the identity of the appraiser, professional designations, reference to any professional appraisal organizations, or the firm with which the appraisers are connected) shall be used for any purpose other than the intended use of this appraisal outlined in this report by anyone but the client or the client's assigns without the prior written consent of the appraiser. Nor shall this report be conveyed by anyone to the public through advertising, public relations, news, sales, or other media without the prior written consent and approval of the appraiser. 7. No engineering survey has been made by the appraiser. Except as specifically stated, data relative to sizes and areas were either estimated through measurement or taken from sources considered reliable, and no encroachment of any real improvements present is assumed to exist other than specified. All maps, plats and exhibits included are for illustration only, as an aid in visualizing matters discussed within the report and should not be considered as surveys or relied upon for any other purpose. All engineering and other information obtained from the client regarding the subject property are assumed to be correct. 8. It is assumed that all applicable zoning regulations and restrictions have been complied with, unless nonconformity has been stated, defined, and considered in the appraisal report. 9. No changes of any item of the appraisal report shall be made by anyone other than the appraiser, and the appraiser shall have no responsibility for any such unauthorized changes. Site 10. The appraiser inspected the subject land and found no obvious evidence of soil deficiencies except as stated in the report. However, no responsibility can be assumed for hidden soil deficiencies, such as weight bearing capacity limitations, or conformity to specific government requirements, without the provision of specific professional or governmental inspections. For purposes of this appraisal, the appraiser assumes that there are no hidden or unapparent soil deficiencies of the property, subsoil, or structures if present, which would render it more or less valuable. The appraiser assumes no responsibility for such conditions or for engineering that might be required to discover the factors. 11. The completion of an environmental assessment was not within the scope of this analysis. Unless otherwise stated in this report, the existence of petroleum leakage, chemicals or toxic waste, which may or may not be present on the property or adjacent properties, were not called to the attention of, nor were they observed by the appraiser. Therefore, the assumption is being made that no environmental hazard problems are evident on the subject land except those discussed within the context of this report. 12. The value concluded herein is entirely contingent upon the subject property not being within or subject to any unknown provincial or federal regulations not identified on the title, such as building height restrictions, nature reserves, etc., which, as a result might limit, restrict, and/or prevent development of the subject land to its highest and best use.
- 7. Page 7 Building Improvements 13. The appraiser inspected the buildings on the subject lands, and found no obvious evidence of structural deficiencies except as stated in the report. However, again no responsibility for hidden defects or conformity to specific government requirements, such as fire, building and safety, earthquake, or occupancy codes, can be assumed without provision of specific professional or governmental inspections. 14. Unless otherwise stated in this report, the existence of hazardous materials within the buildings present on the subject land, if any, including, but not limited to, asbestos, urea-formaldehyde foam insulation, polychlorinated biphenyls, were not called to the attention of, nor were they observed by the appraiser. The appraiser has no knowledge of the existence of such materials on or in the property. The appraiser, however, is not qualified to detect such substances. The presence of substances as listed above or any other potentially hazardous materials may affect the value of the property. The value opinion is predicted on the assumption that there is no such material on or in the property, or on or in adjoining properties that would cause a loss in value to the property being appraised. No responsibility is assumed for any such conditions or for any expertise or engineering knowledge required discovering them. The client is urged to retain an expert in this field, if desired. In the event that a conclusion is reached whereby corrective action will be required to clean up any environmental contamination, the appraiser will at that time retain the right to modify and/or change the value conclusions presented herein. 15. On any appraisals involving proposed construction, the appraisal report and value conclusions are contingent upon completion of the proposed improvements, in accordance with the plans and specifications the appraiser obtained from the client. 16. The distribution of the total valuation in this report between land and improvements present, if any, applies only under the existing program of utilization. The separate valuations for land and building, if applicable, must not be used in conjunction with any other appraisal and are invalid if so used. 17. It is assumed that all required licenses, certificates of occupancy, consents, or other legislative or administrative authority from any local, provincial, or federal government or private entity or organization associated with the uses of buildings present, if any, have been or can be obtained or renewed for any use on which the value opinion contained in this report is based. 18. It is assumed that the utilization of the land and building improvements, if any, is within the boundaries or property lines of the property described and that there is no encroachment or trespass unless noted in the report. 19. The forecasts, projections, or operating estimates of buildings present, if any, contained herein are based upon current market conditions, anticipated short-term supply and demand factors, and a continued stable economy. These forecasts are, therefore, subject to change as a result of variations in the market. 20. The construction and condition of improvements present, if any mentioned in the body of this report, are based on observations. No engineering study has been provided on the buildings present, if any, which would assist in the discovery of any latent defects. No certification as to any of the physical aspects of the buildings present, if any, could be given unless a proper engineering study was made.
- 8. Page 8 EXTRAORDINARY ASSUMPTIONS & HYPOTHETICAL/LIMITING CONDITIONS Extraordinary Assumptions/Hypothetical Conditions: Extraordinary Assumption is defined as “An assumption, directly related to a specific assignment, which, if found to be false, could alter the appraiser's opinions or conclusions. Extraordinary assumptions presume as fact otherwise uncertain information about physical, legal, or economic characteristics of the subject property; or about conditions external to the property such as market conditions or trends; or about the integrity of data used in an analysis. An extraordinary assumption may be used in an assignment only if: -It is required to properly develop credible opinions and conclusions; -The appraiser has a reasonable basis for the extraordinary assumption; -Use of the extraordinary assumption results in a credible analysis; and -The appraiser complies with the disclosure requirements set forth in the latest Canadian Uniform Standards for extraordinary assumptions. Hypothetical Condition is defined as a hypothetical condition that is known to be contrary to what exists. However, the conditions are asserted by the appraiser for the purposes of the analysis as per the terms of reference provided by the client. An example would be valuing a property as if vacant when building and/or site improvements are present. For every Hypothetical Condition, an Extraordinary Assumption is also required. The following Extraordinary Assumption/Hypothetical Condition(s) is/are being made: None Extraordinary Limiting Conditions: Extraordinary Limiting Conditions is defined as a necessary modification or exclusion of a Standard Rule, which may diminish the reliability of the report. An example would be the appraiser's inability to inspect the interior of a building being appraised. The following Extraordinary Limiting Conditions are being made: None
- 9. Page 9 EFFECTIVE DATE OF THE APPRAISAL/DATE OF THE REPORT INSPECTION DATE: May 02, 2016 EFFECTIVE DATE: May 02, 2016 DATE OF THE REPORT: May 11, 2016 PURPOSE OF THE APPRAISAL The purpose of this appraisal is to provide an estimate of the Current Market Value of the Fee Simple Interest of the subject property. INTENDED USE OF THE APPRAISAL The intended use of this appraisal is for confirmation of the property value in relation to a pending offer to purchase the property and for first mortgage financing purposes following purchase of the property by the client. Therefore, the intended user of this appraisal is solely the client, or the Muslim Association of Canada, Attention: Hussan Gerbara (Calgary Chapter) and the selected financial institution as identified in a separate transmittal letter signed by the Appraiser. PROPERTY RIGHTS DEFINED The property rights being appraised are those of the “Fee Simple Interest”. Fee Simple interest includes a “bundle of rights”, which embraces the right to use the property, to sell it, to lease it, to enter it, or to give it away. It also includes the right to refuse to take any of these actions. These rights and privileges are limited by powers of government that relate to taxation, eminent domain, police power and escheat. LOCAL MARKET AREA DEFINED Local Market Area is an area or region in which real estate properties generally share similar location and/or economic characteristics, such as a municipal neighbourhood or district, an entire municipality or a region within a municipality, or a region within a province. A local market area can be broad or specific depending on the type of property. ARMS LENGTH TRANSACTION DEFINED An arms length transaction is a sale transaction in which both parties of the transaction acted in their own self- interest and thus were not subject to any pressure, duress or favoritism from the other party. An arms length transaction can involve a sale transaction resulting from an open market sale of a property involving a real estate agent or involve a private sale transaction between unrelated parties.
- 10. Page 10 MARKET VALUE DEFINED The latest edition of the Canadian Uniform Standards defines market value as follows: “The most probable price in terms of money which a property should bring in a competitive and open market under all conditions requisite to a fair sale, the buyer and seller, each acting prudently, knowledgeably and assuming the price is not affected by undue stimulus. Implicit in this definition is the consummation of a sale as of a specified date and the passing of title from seller to buyer under conditions whereby: 1. Buyer and seller are typically motivated. 2. Both parties are well informed or well advised, and each acted in what they consider their own best interest. 3. A reasonable time is allowed for exposure in the open market. 4. Payment is made in terms of cash in Canadian dollars or in terms of financial arrangements comparable thereto; and 5.The price represents the normal consideration for the property sold unaffected by special or creative financing or sales concessions granted by anyone associated with the sale.” EXPOSURE PERIOD DEFINED The latest edition of the Canadian Uniform Standards defines exposure period as follows: “The estimated length of time the property interest being appraised would have been offered on the market prior to the hypothetical consummation of a sale at market value on the effective date of the appraisal; a current estimate based upon an analysis of past events assuming a competitive and open market." Exposure time is different for various types of real estate and under various market conditions. It is noted that the overall concept of reasonable exposure encompasses not only adequate, sufficient and reasonable time but also adequate, sufficient and reasonable effort. This statement focuses on the time component. The fact that exposure time is always presumed to occur prior to the effective date of the appraisal is substantiated by related facts in the appraisal process: the supply/demand conditions as of the effective date of the appraisal; the use of current cost information; the analysis of historical sales information (sold after exposure and after completion of negotiations between the seller and buyer); and the analysis of future income expectancy estimated from the effective date of appraisal. The estimate of the most probable exposure time is based upon consideration of one or more of the following: • Statistical information about the time the properties are listed on the open market; • Information gathered through sales verification; and, • Interviews of market participants.
- 11. Page 11 PROPERTY RIGHTS APPRAISED The subject property rights being appraised are Fee Simple Interest. PROPERTY IDENTIFICATION The subject property is legally described as Lot C, Block 7, Plan 7610673. SCOPE OF THE APPRAISAL As part of the valuation process, the appraiser inspected the subject property, viewed the surrounding properties, viewed the market area and inspected those comparables deemed necessary. The highest and best uses were analyzed and determined for the subject property. A search for comparables was made based upon, but not limited to the following search criteria: 1) Similarly located comparable sales within the general area. 2) Date of sale within the past several years and 3) Similar potential use. The most comparable sales were then selected from those transactions that met these criteria. The sources of comparables used in this analysis included use of an in-house developed database of market transactions obtained from a variety of sources including but not limited to land title transfers obtained from Alberta Land Titles, pending and/or sold comparable sales obtained from Commercial Edge or the Multiple Listings Systems provided by the local Real Estate Board, or CREB in this case, and/or through discussions with local Realtors, property owners and appraisers knowledgeable of the area that were verified by the appraiser. The appraiser is responsible for the researching and analysis of all data and conclusions utilized within this report. Any exterior photographs in this report of comparables that were obtained from Sale/Listing sheets, Assessment Reports or from other sources that are considered reliable and relevant. Unless otherwise stated herein, the appraiser believes that the selected photographs are an accurate illustration of the property as of the listed, sale or assessed date and complies with the Personal Information Protection and Electronic Documents Act (PIPEDA). To arrive at the value estimate, the appraiser researched the assessed value, land use designation and potential future uses of the subject property. All applicable current land use and planning documents were obtained from the municipality and reviewed as applicable to the subject property. A copy of the current Title Certificate for the subject property was obtained and all encumbrances were reviewed. Also, the appraiser reviewed all documentation made available for the subject property, such as studies, surveys as well as the property history and key characteristics. All valuation techniques were considered during the valuation of the subject property, however only those techniques deemed appropriate were selected and applied. The three key approaches considered are outlined later in this report.
- 12. Page 12 FACTUAL DATA REGIONAL/MUNICIPAL ECONOMIC ANALYSIS ALBERTA ECONOMIC ANALYSIS Regional Location Map The subject property is located within the northwestern part of Calgary, which is within the south central part of Alberta, as shown in the above map.
- 13. Page 13 2014 GDP Growth Source: AlbertaCanada.com Economic Dashboard January 2016 Alberta’s economy had shown positive GDP growth since economic growth contracted in 2009 following the global financial crisis during the fall of 2008 and had the highest GDP growth of all provinces during 2014, as shown in the above graph. Alberta’s real GDP rebounded 3.3% during 2010 and advanced 5.2% in 2011, which represents the province’s highest economic growth rate since 6.2% reported in 2006. In 2013, Alberta experienced a GDP growth of 3.9% and in 2014 experienced 4.4%. However, However, The Conference Board of Canada reported during 1Q 2016 that Alberta’s GDP is expected to have contracted by 1.8% during 2015 and forecasted Alberta’s GDP to contract a further 1.3% during 2016 and then will rebound in 2017 to have 1.7% GDP growth during 2017 and then have 2.7% GDP growth during 2018. Historical Oil Prices Source: AlbertaCanada.com Economic Dashboard
- 14. Page 14 Contributing towards Alberta’s past economic growth was that the price of West Texas Intermediate (WTI) oil, often a world reference price for light synthetic crude oil quoted in the media, had trended upward from $50 US to $100 US per barrel between January 2009 and December 2014 until dropping to near $50 US per barrel during 1Q 2015. Oil prices rebounded to the $60 per barrel mark later in 2015 but then dropped below $50 US per barrel in August 2015 and then later further dropped to below $40 US per barrel in December 2015 and then to below $30 US per barrel in February 2016 and then rebounded again to near the $40 US per barrel mark in April 2016. The price of Western Canada Select (WCS) oil, the lower price obtained by 50% of Alberta’s exports due to having a heavier synthetic crude oil blend, was also down substantially on a year over year basis. In view of the recent decline in oil prices, the Government of Alberta forecasted in March 2015 a real GDP growth of 0.4% for 2015. Also, Stephen Poloz, governor of the Bank of Canada, announced in December 2015 that the bank would consider cutting its interest rate to below zero per cent if Canada is faced with a major economic shock in 2016. Three key factors are contributing towards lower oil prices due to over supplies, which are anticipated not to change over the short term. One, the end of the US-led embargo on Iran resulted in a surplus of oil in Iran. The financial embargo on that country had damaged its economy. Iran is now in extreme need for cash, which is resulting in the country pumping out as much oil as physically possible no matter how low oil prices drop. Two, Libya had suffered a lot of damage to its oil infrastructure during the overthrow of Gadaffi years ago. However, Libya’s oil terminals are now under attack by the Islamic State. Like Iran, Libya is desperate for cash and is selling as much oil as it can no matter how low the oil price goes. And three, fracking in the US is increasing oil supplies.1 However, in February 2016, Qatar, Saudi Arabia, Russia and Venezuela agreed to freeze oil production levels at January levels in an attempt to help stabilize prices. Positive overall increases to Alberta’s monthly building permit values between 2011 and 2014 support evidence of strong economic growth in Alberta during those three years, as shown in the following first chart. However, during 2015, it became evident that Alberta’s overall monthly total permit values began trending downward with a significant drop observed in January 2016, also shown in the following first chart. Building permits appear to have rebounded in February 2016 as shown on the following second chart. In February 2016, Alberta municipalities issued $1.6 billion in building permits, up 25.6% from February 2015. Alberta led all provinces in year-over-year growth in the value of building permits in February 2016, with its 25.6% rate2 . 1 Oil-Price.net, Oil Price Drops on Oversupply, Steve Austin, 2014/10/06 2 Albertacanada.com Economic Dashboard, http://economicdashboard.albertacanada.com/BuildingPermit
- 15. Page 15 Alberta Monthly Total Permit Value Statistics Source: AlbertaCanada.com Economic Dashboard February 2016
- 16. Page 16 Alberta’s inflation rate as of February 2016 was 1.4% and has generally been fluctuating between 1.4% and 2% since mid-2015. Although Alberta’s inflation rate has been generally fluctuating between 0% and 3% since 2011, several local building construction companies reported that 2015 building construction costs were currently 30% to 40% higher than 2008 construction costs, which equates to a construction inflation rate of closer to 4% to 6% per year between 2008 and 2015. Source: AlbertaCanada.com Economic Dashboard February 2016 Despite the slowdown in Alberta’s economy, Alberta is still leading other provinces in terms of population growth. On October 1, 2015, Alberta’s population reached 4,216,875, up 69,835 or 1.7% from October 1, 2014. The national growth rate was 0.9% over the same period as last quarter. Alberta accounted for 23% of Canada’s population increase over the past year and ranked 1st in the year-over-year population growth rate3 . 3 Albertacanada.com Economic Dashboard, Aug. 2015, http://economicdashboard.albertacanada.com/BuildingPermit
- 17. Page 17 Source: AlbertaCanada.com Economic Dashboard, January 2016 In summary, Alberta’s economy had been experiencing overall positive economic and population growth between 2011 and 2014. However, in response to the recent decline in oil prices beginning in January 2015, downward pressure now exists on real estate property values, particularly within those municipalities whose local economy is strongly influenced by the oil and gas industry.
- 18. Page 18 CITY OF CALGARY/RANCHLANDS DISTRICT AREA ANALYSIS City of Calgary Location Map The subject property is located within the northwest part of the City of Calgary in the Ranchlands residential district, as shown in the above map, which will be discussed at the end of this section. Given the subject general location within Calgary and the specific location within the Ranchlands district influences the subject property, an analysis of Calgary’s economy will be done first followed by a review of the Ranchlands district.
- 19. Page 19 As a national transport centre, Calgary serves as the gateway to two major Rocky Mountain passes, as well as the crossroads of Alberta's rail and road systems. Calgary is also a major business centre for Southern Alberta and Western Canada with over 135 head offices. With an abundance of major services and cultural amenities fitting a city of over one million, and no provincial sales tax, the City draws new residents from throughout the Province and beyond as exemplified in the steady population growth. Calgary is also Western Canada’s distribution hub. The latter attraction has lead to the development of numerous mega warehouse complexes within the city’s industrial parks and numerous head offices for companies operating in the oil and gas industry. The population of Calgary is reported to be 1,230,915 persons as of April 2015. The City has shown positive growth since 2005 and given net migration into Alberta is still positive and was over 10,000 persons during 3Q 2015, Calgary’s population level continued to grow throughout 2015. The following chart illustrates the population growth from 2005 to 2015: CALGARY’S POPULATION GROWTH CENSUS POPULATION INCREASE/ DECREASE % GROWTH FROM PREVIOUS 2015 1,230,915 35,721 2.99% 2014 1,195,194 45,642 3.97% 2013 1,149,552 29,327 2.62% 2012 1,120,225 30,189 2.77% 2011 1,090,036 18,521 1.69% 2010 1,071,515 6,060 0.57% 2009 1,065,455 22,563 2.16% 2008 1,042,892 22,950 2.25% 2007 1,019,942 28,183 2.84% 2006 991,759 35,681 3.73% 2005 956,078 22,133 2.42% The oil sector has experienced declining prices, as outlined within the previous Alberta Economic Analysis section, which has been having a negative effect on Calgary’s unemployment level. The city’s unemployment level jumped from 4.25% in December 2014 when oil prices were still relatively high to near 7.5% in January 2016 when oil prices dropped to below $30 US per barrel, as shown in the following unemployment chart.
- 20. Page 20 The following Permit Statistics were obtained from the City of Calgary’s web site: Total construction activity trended upward between 2013 and 2014 due to growth within the residential sector. However, total construction activity in 2015 was reported to be 3.4% below the 2014 level but still remained above the 2013 level. The above chart exemplifies that Calgary’s total construction activity is over 50% residential in nature and construction within this sector was still relatively strong during 2015 despite the price of oil beginning to significantly decline in January 2015.
- 21. Page 21 Analysis of Churches within Calgary Given the Highest and Best subject property is institutional/church usage, as concluded later in this report, the following market information provides some insight as to the number of churches present within Calgary as a whole and within Calgary’s different sectors and how often churches change ownership.
- 22. Page 22 From the previous map, it is observed that a higher concentration of churches are located within the central parts of Calgary but churches are present within almost every residential district of the city. The following chart summarizes the number of churches located within each sector of Calgary along with the total number of churches listed on Canada’s on-line Yellow Pages. Calgary Sector Number of Churches Listed on Yellow Pages Northeast Calgary 114 Northwest Calgary 103 Southeast Calgary 150 Southwest Calgary 139 Calgary City 506 From the above chart, it is observed that the greatest number of churches are located within southwest Calgary and the least number of churches are located within northwest Calgary. Commercial Edge is a local service affiliated with the Calgary Real Estate Board (CREB) that tracks commercial sales within the Greater Calgary Area that includes church sales. The following chart summarizes the volumes and sale prices of churches that Commercial Edge Reported to have sold within Calgary during the past 10 years. Sale Price Range Number of Churches Sold Since 2006 Less than $1M 8 From $1M to $2M 14 From $2M to $3M 2 From $3M to $4M 1 From $4M to $5M 1 From $5M to $6M 1 From $6M to $7M 1 Total Church Sales: 28 From the above sales data, it is observed that nearly 80% of the 28 churches that have sold during the past 10 years had sold for less than $2,000,000. The remaining 20% of the churches that had sold within Calgary had sold for between $2,000,000 and $7,000,000. City of Calgary Summary In summary, Calgary’s population is still growing despite the significant decline in oil prices that began in January 2015. A review of the number of churches that exist within Calgary, or over 500 churches, and that 28 churches have sold within the past 10 years, or 2 to 3 churches per year on average that range from less than $1,000,000 to $7,000,000, a market exists for churches within Calgary with the strongest market being for churches less than $2,000,000 and the most limited market being for churches worth from between $2,000,000 and $7,000,000.
- 23. Page 23 RANCHLANDS AREA ANALYSIS As indicated earlier in this report, the subject property is located within the northwest part of Calgary, as shown in the map below that shows the boundaries of this district. The subject property is located within the southeast part of the Ranchlands district, also illustrated in the map below. Ranchlands Boundary Map and Subject Location within the District The population of the Ranchlands district was reported to be 7,926 persons during 2014, which is up 3.6% from the population level of 7,654 persons reported during 2009. As such, Ranchlands represents a mature neighbourhood with a low annual population growth of 0.7%. Although the neighbourhood is adjacent to four arterial roadways, most notably Crowchild Trail NW, access to the district is limited to being via Ranchlands Boulevard NW that interect with Nose Hill Drive NW and Jogh Laurie Boulevard NW that border the district on the west and north boundaries, respectively. Access to the subject church is via Ranchview Drive NW that intersects Ranchlands Boulevard NW at two points. As such, users of the church located outside of the district have to travel through half to three quarters of the district to reach the subject church.
- 24. Page 24 Churches within Ranchland The above map illustrates that five churches are located within the Ranchlands district of which one is adjacent to the subject church and the other three churches are located within the northern and western parts of the district and thus have moderately better accessibility from outside the district. Overall, access to the subject church is relatively quick from the north via John Laurie Boulevard NW and via Ranchlands Boulevard NW. Ranchlands Summary In summary, the subject church is located within the Ranchlands residential district that is a mature district with nominal annual population growth. Access to the subject church is somewhat secondary within the district given the location within the southeast part of the district, which is at the opposite ends of the district that have access from the arterial roadways that border the district. the west part of the district is deemed to have the best accessibility given the two access points are in close proximity to Crowchild Trail NW, which represents the most major roadway bordering the district.
- 25. Page 25 MARKET AREA ANALYSIS Market Area Map The subject land under analysis a consists of an institutional church with classrooms located on 1.35 acres of land zoned SCI-Special Purpose Community Institution that is located within the southeastern part of the Ranchlands district within northwest Calgary, as shown in the above map. The land is near Crowchild Trail NW/Highway 1A but the district is accessed via the roadways that run along the west and north boundaries of the district. In view of the preceding, the subject local market area is generally defined as SCI-Special Purpose Community Institution zoned land designated located within northwest Calgary, as outlined in red on the above map. The latter recognizes that a more specific local market area would be the southeastern part of the Ranchlands District that would have highly similar locational attributes, and a more general local market area would be the entire City of Calgary. SCI-Special Purpose Community Institution zoned properties within northwest Calgary would generally have similar accessibility and locational characteristics from a Calgary-wide accessibility perspective.
- 26. Page 26 SITE DESCRIPTION & ANALYSIS Subject Land Titles System Map
- 27. Page 27 Subject Building Footprint and Mezzanine Measured Areas
- 28. Page 28 Aerial Satellite Photo of the Subject Property and Adjacent Surrounding Area
- 29. Page 29 The reader is referred to the previous information that pertains to the subject property. Below are key features and characteristics of the subject land: Municipal/Legal Address: 6415 Ranchview Drive NW, Calgary, Lot C, Block 7, Plan 7610673 Land Area: Gross Land Area: 1.35 Acres 58,806 SF Primary Road Frontage: 330 ’- Ranchview Drive NW Access: Direct by Ranchview Drive NW. Shape: Triangular Corner Lot: No Visibility: Visibility from Ranchview Drive NW and surrounding development is rated as Average. Paved Road Access: Yes Sidewalk: Yes Curb And Gutter: Yes Storm Sewer: Yes Availability of Utilities Electricity: Yes Municipal Water: Yes Municipal Sewer: Yes Natural Gas: Yes Telephone: Yes Underground Utilities: Yes Adequacy of Utilities: Average Street Lighting: Yes Topography: Level to sloped Flood Plain: No Adjacent Uses: The surrounding uses are predominantly a mixture of low and medium density residential usage intermixed with institutional and public park usage and some neighbourhood commercial usage along Ranchlands Boulevard NW, which is the main arterial roadway leading through the Ranchlands district. Easements/Encumbrances Issues: None deemed detrimental Environmental Issues: None noted Engineering Study: No Summary: The subject land consists of a triangular interior lot that is overall level with the front yard a bit hilly. The lot is surrounded by mature trees on three sides and a public walkway runs along the east side of the land that makes the subject land more accessible by foot. The larger size of the lot is such that the triangular shape does not significantly reduce the amount of usable land, as a sizable building is present on the building along with a large amount of paved parking space and landscaped yard space. The building and site improvements will be discussed further later in this appraisal report within the Improvements Description section.
- 30. Page 30 TAXES AND ASSESSMENT INFORMATION A summary of the assessment of the subject is provided in the following table, which was obtained from the municipality’s Assessment Department. ASSESSMENT FOR TAX YEAR 2015 Subject Assessed Other/Combined Value $1,050,000 Total Other/Combined Value $1,050,000 Total Assessment $1,050,000 OWNERSHIP/SALES HISTORY The most recent transfer of the subject land title was on July 9, 1979 when the subject land was transferred to the current owner with a reported value of $150,000. The appraiser is aware that the subject property is currently listed for sale at Market with no asking price specified and that the client has a pending offer to purchase the subject property for $3,850,000 and several other lower bids were received to purchase the property. To the best of the writer’s knowledge, the subject property was not involved in any other sales related activity during the three years preceding the effective date of this appraisal.
- 31. Page 31 TITLE ENCUMBRANCES Reference is made to Exhibit B of the addenda of this report that contains a current copy of the subject Title Certificate that identifies the encumbrances registered against the subject title. An encumbrance can have a positive, negative or no effect on the value of the subject property depending on the nature of the encumbrance. Encumbrances that have a positive effect on value would typically include those encumbrances that generate revenue, such as surface leases, or encumbrances that enhance the use of the property, such as access easements registered on the subject property that affect adjoining properties that are beneficial to subject property in terms of increased accessibility and/or yard size. Encumbrances that have a negative effect on value would typically include those encumbrances that generate costs or diminish the use of the property, such as easements or right of ways located within the interior parts of a property that could be detrimental to the property in terms of limiting the size and/or location of buildings that could be constructed. Lastly, encumbrances that have no effect on value would typically include those encumbrances that have no effect on the use of the subject property, such as farmland with underground facilities that can be cultivated over top, or any encumbrances that are temporary in nature and can readily be removed without any significant cost, such as mortgage financing caveats. Title Encumbrances Comments A total of four encumbrances are registered against the subject land title that involve two utility right of way agreements and two restrictive covenants. The two utility right of way encumbrances are of no concern as the right of ways are to provide utility services to the area. Regarding the two restrictive covenants, review of the documentation associated with these encumbrances obtained from Alberta Land Titles revealed that one encumbrance surrounds forbidding the construction of structures on any of the utility or public sidewalk easements present on the subject land. The second restrictive covenant surrounds and old encumbrance registered prior to when the subject building was built that had provided temporary building sites and access routes across the subject land when the area was being developed and accessibility was limited. Given all of the required subject building and site improvements are already present to operate as a church and school and these improvements comply with the first restrictive covenant that is still applicable, these two encumbrances are of no concern as well. In summary, all four encumbrances are deemed not to have any significant positive or negative effect on the use and value of the subject property as it stands.
- 32. Page 32 MUNICIPAL PLANNING & LAND USE OVERVIEW Municipal Development Plan Usage Map
- 33. Page 33 Land Use Map
- 34. Page 34 The reader is referred to the previous information obtained from the municipality's planning department surrounding the City of Calgary urban usage structure and current land uses of the subject property and the immediate surrounding area. There are a series of municipal planning documents that affect the future and current uses of the subject property, or the Municipal Development Plan, the Area Structure Plan and the Land Use Bylaw. The Municipal Development Plan and an Area Structure Plan, where applicable, were reviewed primarily from the perspective of future land usage regulations that would apply to the subject property and the immediate surrounding area. Conversely, the Land Use Bylaw was reviewed primarily from a current use perspective of the subject property and the immediate surrounding area. Below are the aspects of the existing planning documents reviewed that apply to the subject property: Current Land Use Designation: S-CI – Special Purpose - Community Institution Purpose: The purpose of the S-CI zoning is to: (a) provide for large scale culture, worship, education, health and treatment facilities; (b) provide for a wide variety of building(forms located throughout the city; and (c) be sensitive to the context when located within residential areas. Current Use: The subject building is currently used as a community church and a children's school. Legally Conforming: Yes. The church and school usage of the subject property complies with the discretionary uses of the SCI land use designation, most notably Pace of Worship - Large and School - Private. Zoning Change Requested: Likely: New Zoning: No No N/A Potential Future Uses: The future use of the subject property coincides with the current institutional zoning and use of the property given the location within a mature residential neighbourhood as identified in the previous Municipal Development Plan Calgary usage map and the relatively low population growth levels of the Ranchlands district, which is resulting in no significant pressure to re-zone and redevelop the subject property into some form of medium or high density multi family residential development. Permitted/Discretionary Uses: Permitted uses of the S-CI include the following: - Home Occupation; - Natural area or park; - Small power generation facility; - Emergency services; - Signs; and - Utilities A wide range of discretionary uses of the S-CI zoning generally include the following: - Wide range of public services, such as hospital, cemetery, museum and alike; - Wide range of sizes of places of worship; - Private and post-secondary schools; and - Other forms of public and utility uses From the above permitted and discretionary uses, the City of Calgary has a strong degree of control as to how S-CI zoned land is used to ensure that the use is in the public's best interests. Refer to Exhibit C of the addenda for a full list of permitted and discretionary uses and all regulations associated with this land use designation.
- 35. Page 35 IMPROVEMENTS DESCRIPTION Below is a summary of the key characteristics of the subject property building improvements:
- 36. Page 36 Improvements Comments: The reader is referred to Exhibit A of the addenda containing photos of the subject exterior and interior finish. The subject building consists of a wood frame church that has the following estimated key areas measured by the appraiser and key features: - Overall building footprint of 14,275 SF - 1,012 SF of modernly finished mezzanine office space added in 2004 with 5 partitioned rooms - Total usable floor area of 15,287 SF including mezzanine office space - 3,571 SF gym with hardwood flooring, 20' ceiling, high intensity lighting and team washrooms - 2,484 SF 200 person chapel with an abundance of woodwork, a skylight above a baptismal font, raised wooden choir section, indirect fluorescent lighting, and an entrance with tall windows - 8,220 SF of highly partitioned office-like space consisting of a reception area, multiple smaller sized classrooms some with sinks, large reading room with indoor fire place, kitchen room and multiple men's and lady's washrooms. Interior finish varies from carpet, linoleum and ceramic tile flooring, painted drywall walls and stipple and suspended tile ceilings with a mixture of fluorescent and incandescent lighting. New asphalt shingles were installed in 2011 on the building, which occupies 10,700 square feet, or 75% of the building. The building has above average heating and cooling systems in the form of three rooftop HVAC systems that have been maintained by a property management company and several natural gas furnaces to provide further zone heating. The power system is also above average given the 600 amp service to the building. The subject building is rated as being in overall average condition with the asphalt roofing and three rooftop HVAC systems being rated in good condition. The appraiser has concluded that a degree of deferred maintenance is present in the form of repainting some areas, replacing flooring in some areas and other minor cosmetic repairs and eventual replacement of the roofing over the gym that has not been recently replaced. The subject property has several site improvements present as well that include the following: - 16,000 SF of paved parking space with 42 counted parking stalls - 370 linear feet of concrete sidewalks ranging from 3.0 to 4.5 feet wide - Landscaped front yard with planted trees along three sides of the property - Extension of commercial grade servicing to the building including 600 ampere power service The paved parking space was observed to be in good condition and the sidewalks were observed to be in average condition but not designed for wheel chair access. The landscaped front lawn was observed to be in fair condition with areas of little to no grass growth due to the front yard being heavily trampled during children playing on the lawn. However, all of the trees were observed to be in good health.
- 37. Page 37 ANALYSIS OF DATA AND OPINIONS OF THE APPRAISER HIGHEST AND BEST USE ANALYSIS Highest and Best Use Four criteria are examined in order to determine the highest and best use of the subject property. The criteria and their applicability to the subject, both “as vacant” and “as improved” are as follows: Physically Possible: the size, shape and topography affect the uses to which land may be developed. The utility of a parcel is dependent on its frontage and depth. Sites with irregular shapes may be more expensive to develop, and topography or subsoil conditions may make utilization too costly or restrictive. Highest and best use as improved also depends on physical characteristics such as condition and utility. Legally Permissible: a legally permissible use is determined primarily by current zoning regulations. However, other considerations such as long-term leases, deed restrictions, and environmental regulations may preclude some possible highest and best uses. Financially Feasible: the use of the property is analyzed to make a determination as to the likelihood that the property is capable of producing a return which is greater than the combined income needed to satisfy operation expenses, debt service, and capital amortization. Any use that is expected to produce a positive return is classified as financially feasible. Maximally Productive: the use that provides the highest rate of return among financially feasible uses is the highest and best use. The use of the land must yield a profitable net return, and the quantity of land devoted to any specific use must be limited to that quantity which will yield a maximum return to each owner. Current/Historic Use The subject building is currently used as a community church and a children's school with a three quarter size gym.
- 38. Page 38 Highest and Best as Vacant Physically Possible Commercial, Industrial, Institutional/Public, Recreational or Residential Usage Legally Permissible Institutional/Public, Recreational or Utility Usage Financially Feasible Institutional/Public, Recreational or Utility Usage Maximally Productive/Assemblage Institutional/Public or Utility Usage. Assemblage with additional land is not required to realize the optimal use of the subject property given the size of the land. HIGHEST AND BEST USE AS VACANT: Public/Institutional Usage The optimal use of the subject land as vacant would be some form of permitted Institutional/Public or Utility usage given the location, surrounding uses, the institutional zoning and that the Ranchlands district has a relatively low annual population growth rate and that Calgary’s residential market is currently suppressed, which reduces the demand for the subject institutionally zoned land to be purchased and later rezoned for multi-family residential development given the high risks present at this time to do so. Highest and Best as Improved Physically Possible Commercial, Industrial, Institutional/Public, Recreational or Residential Usage Legally Permissible Institutional/Public, Recreational or Utility Usage Financially Feasible Institutional/Public or Recreational Usage Maximally Productive/Assemblage Institutional/Public Usage. Assemblage with additional land is not required to realize the optimal use of the subject property given the size of the land. HIGHEST AND BEST USE AS IMPROVED: Community Church and Children's School The optimal use of the subject land as improved would Community Church and Children's School given the building and site improvements in place, the subject location, surrounding uses and institutional zoning. Furthermore, the significant amount of improvements present on the land that are in overall average condition with the roof and heating/cooling systems rated as being in good condition, residential land values within the Ranchlands district are not yet to the extent that the subject property would have a higher value as residential development land in relation to the value of the subject land as is given the larger sized church with classrooms and the three quarter sized gym present.
- 39. Page 39 APPRAISAL METHODOLOGY There are three main approaches to value that can be applied for properties of this type, or the Cost Approach, Income Approach and Direct Comparison Approach. COST APPROACH The Cost Approach is a method in which the value of a property is developed by adding the value of the site as vacant to the depreciated value of the building and site improvements. The Cost Approach is most applicable to newer properties and becomes subjective for older properties due to the approach involving estimating a large amount of depreciation. However, the Cost Approach becomes more applicable to older properties that are unique, owner occupied properties. DIRECT COMPARISON APPROACH The Direct Comparison Approach consists of the comparison of similar properties that have recently sold or currently offered for sale. This comparison process involves making adjustments between the subject property and the comparable properties on an item-by-item basis and is highly reliant on the availability of suitable recent comparable sales. As such, this approach is most applicable to vacant land and owner occupied properties that are relatively common in design. INCOME APPROACH The Income Approach converts an anticipated annual net income into an indication of value. This approach is predicated upon the relationship between income and value. As such, the Income Approach is most applicable when financial information is available for the appraised property or could be estimated relatively accurately through the use of market data. Given the unique characteristics of the subject property, availability of market data and that the subject building is owner occupied, the following approaches will be applied commencing with the first approach listed below: Cost Approach Direct Comparison Approach Each selected approach is explained in detail at the beginning of the application of the approach. The applicability and reliability of each approach considered are briefly reviewed again during the reconciliation and summary of the subject property final market value estimate at the end of this appraisal report.
- 40. Page 40 COST APPROACH The Cost Approach has been defined as: “That approach in appraisal analysis which is based on the proposition that the informed purchaser would pay no more than the cost of producing a substitute property with the same utility as the subject property. The approach is particularly applicable when the property being appraised involves a relatively new improvement which also represents the highest and best use of the land or when relatively unique or specialized improvements are located on the site for which there exists no comparable properties on the market.” Cost is essentially defined as the amount of money necessary to produce a commodity, whereas value is thought of as the relationship between a thing desired and a potential purchaser. A property can be less or more valuable than its cost immediately after construction of the improvement has been completed, and it is also possible that structures of similar cost could have different value. Therefore, it is emphasized that the cost and market value are not necessarily synonymous. The Cost Approach is most applicable to newer properties and becomes partially subjective for older properties due involving estimating the depreciated value of a property, which depends on estimating the effective age and the economic life of the property. However, the Cost Approach becomes the only approach applicable to non-income producing properties that are highly unique. In the application of the “Cost Approach”, the property being appraised is treated as a physical entity that is separated into site and improvements for valuation purposes. As such, the Cost Approach develops the value of a property by 1) estimating the market value of the subject site as vacant, 2) estimating the replacement or reproduction cost new of the subject improvements, 3) deducting the estimated depreciation from all sources, 4) adding this depreciated reproduction or replacement cost of the building and site improvements to the site value as vacant. The site value is based upon a vacant site being used to its highest and best use. Generally speaking, the site value is estimated by the Direct Comparison Approach. The difference between the cost of a new building and its value (if less than cost) is depreciation. As such, the depreciated value of improvements is estimated by deducting from the reproduction cost or replacement cost new the amount of diminished utility known as accrued depreciation. Replacement or reproduction cost new can be derived from reliable cost manuals or from interviews with reputable local contractors. Depreciation can be from physical, functional, or economic causes. Physical depreciation is simply the percentage of life past due to physical wear and tear of the improvements. Functional depreciation is based upon the “cost to cure” outdated and inferior designs. Economic depreciation is based on the revenue or value losses incurred due to negative external influences. Ideally, depreciation is estimated from the market by observing comparable properties.
- 41. Page 41 ESTIMATE OF LAND VALUE The Cost Approach generally begins with valuation of the land as if vacant. There are several methods appraisers can employ when developing an opinion of land value is if vacant. The six basic procedures are the (1) Direct Comparison Approach, (2) Allocation Method, (3) Extraction, (4) Subdivision Approach, (5) Land Residual Technique, and (6) Ground Rent Capitalization Method. All six methods are derived from the three basic approaches to value. Direct Comparison and income capitalization (i.e. Ground Rent Capitalization) can be directly applied to a land valuation with the latter applicable when land is leased. Allocation and Extraction procedures reflect the influence of the Direct Comparison and Cost approaches; the Land Residual Technique is based on the income capitalization and the Cost Approach. The Subdivision Approach draws on elements of all three approaches and estimates the present value of development land based on subdivided lot sales over an estimated absorption period less costs and an expected developer’s profit. The most appropriate valuation technique for vacant land of this type is the “Direct Comparison Approach”, as it most reflects the behaviors of the buyers and sellers of this type of land. Therefore, the Direct Comparison Approach was used to value the subject land as if vacant. Direct Comparison Approach (Land Valuation) The Direct Comparison Approach is a process of comparing actual comparable property sales. This approach to value is based upon the Principle of Substitution, which holds that "the value of a property tends to be set by the price that would be paid to acquire a substitute property of similar utility and desirability within a reasonable amount of time. This principle implies that the reliability of the Direct Comparison Approach is diminished if substitute properties are not available in the market." (The Appraisal of Real Estate, 13th Edition). This approach is based upon the collection of similar sales and offering data for comparison. Market- derived adjustments for relevant factors can sometimes be extracted from these and other sales. The sales data is compared to the subject on the basis of those elements of comparison, which include real property rights conveyed, financing terms, conditions of sale, and date of sale. Location and other physical characteristics are then considered. Physical characteristics typically used in comparison are size, shape, topography, street frontage, services, zoning, title encumbrances and alike. Because adjustments for these relevant factors are market derived, the desires and actions of typical buyers and sellers are reflected in the comparison process. Listed on the following pages are those comparables, which were considered to be the most similar to the subject land as vacant. Emphasis was initially placed on searching for recent open market sales of institutional land within the subject local market area. However, due to a limited number of such sales being available for analysis, research was extended to consider a broader area, an extended period, sales of residential zoned land given place of worship usage is a discretionary use of residential zoned land. Also, research was also extended to consider private arms length transactions as defined earlier in this report and withdrawn and/or rejected offers.
- 42. Page 42
- 43. Page 43
- 44. Page 44
- 45. Page 45
- 46. Page 46
- 47. Page 47 Land Sales Analysis Land Sales Location Map
- 48. Page 48 The reader is referred to the Site Description & Analysis section earlier in this report that contains the key features of this subject land parcel being valued. For purposes of this analysis, the value per acre was chosen as the unit of comparison, which reflects what buyers and sellers use in the market place for this type and size of land. Consideration was also given to overall values. The following discusses the adjustments required to the comparable sales to account for differences in key features and characteristics in comparison to the subject property. Discussion of Adjustments Property Rights - The transaction price of a comparable sale is always based on the real property interest conveyed. In this instance, an adjustment for this attribute was not considered necessary for any of the comparables. Financing/Sale Terms - The price paid in acquiring a property may be influenced by atypical financing and/or sale terms involved, if any. Above or below market financing or special sale terms could have a negative or positive affect on the price paid. Therefore, some method of converting these financing and/or sale terms to cash must occur so that the adjustment process may be applied to the affected sales. In reviewing the comparables, an adjustment was not required for atypical financing or sale terms to any of the comparables. Conditions of Sale - Adjustments made for conditions of sale usually reflect atypical motivations of the buyer and seller at the time of conveyance. A sale may be transacted at a below market price if the seller needs cash in a hurry. A financial, business, or family relationship between the parties may also affect the price of property. Interlocking corporate entities may record a sale at a non-market price to serve their business interest. When non-market conditions of sale are detected in a transaction, the sale must be thoroughly researched before an adjustment is made. Within the confirmation process, detailed attention was made to ensure the conditions of each sale. Based upon the research performed, it is believed that all of the comparable sales involved regular arms-length transactions without the presence of duress or adverse market influence. Thus, no adjustments were warranted to any of the comparables. Market Conditions/Time Adjustment Percentage - Market conditions may change between the time of sale of a comparable property and the date of the appraisal of the subject property. Changed market conditions often result from various causes, such as inflation or changes in demand and/or supply. Time itself is not the cause for the adjustment. Historical sales and market trends revealed that the market was trending upward up to January 2015 and then has been trending downward due to low oil prices. Appreciation in land values up to January 2015 are deemed to near equally offset the depreciation in land value since January 2015. Therefore, no significant net timing adjustments were deemed necessary to any of the land sales given the sales had occurred during the past two years.
- 49. Page 49 General Location in Calgary - Location considerations include such factors as location within the municipality and proximity to major urban areas plus accessibility or adjacency to major highways. When reviewing the comparables, it was determined that the locations of all the comparables are similar to the subject property in terms of having locations within the peripheral parts of Calgary and therefore no location adjustments were required for any of the comparables. Land Size/Shape - The subject is 1.35 acres, or 58,806 square feet in size. The shape is triangular. Larger lots tend to have lower unit values than smaller sized lots due to larger sized lots being more capital intensive and that the market for larger lots are more limited than smaller sized lots. The sizes of the five comparables range from 0.71 to 1.00 acres in size. The unit sale prices of the four vacant lots, or Comparables 1, 3, 4, and 5 do not vary significantly with the size of the lots. Therefore, a moderately bigger lot of 1.35 acres in size is deemed not to be significantly less in value on a per acre basis than the comparables that are 1.0 acre in size. Therefore, no size or shape adjustments were required to any of the comparables. Accessibility - Corner located properties generally bring a premium in the marketplace due to ease of access and increased visibility. However, these features are of less value to an institutional church property, particularly if usage of the property is low. Therefore, no adjustments were deemed necessary to any of the comparables given the low usage nature of institutional churches. Topography/Soil Conditions - The subject has a level to sloped topography and has average soil conditions. The less adverse the topography is and the more poor the soil quality, the more usable the land is and the less costly the land is to develop and vice versa. When reviewing the comparables, one comparable, or Comparable 5 was known to have poor soil quality in the form of excessive top soil, which would result in additional soil removal and site preparation work. Therefore, an upward adjustment was applied to Comparable 5 to account for the inferior soil quality. Zoning - The subject is zoned S-CI - Special Purpose - Community Institution. The more limiting the zoning is in terms of development potential, the less valuable the land and vice versa. When reviewing the comparables, two comparables were deemed to have superior more intensive residential zoning and thus were adjusted downwards recognizing that place of worship is a discretionary use of residential zoning and that these two comparables could readily be uses as a less intensive institutional church. Improvements - The subject land is being valued as vacant at this stage of the Cost Approach. The greater the quantity and better condition of the improvements present on a land parcel, the more valuable the land is and vice versa. One comparable, or Comparable 2 was noted to have an old hall present on the land along with a few minor site improvements. Therefore, a downward adjustment was applied to this sale according to an estimated depreciated value of the old building and site improvements present.
- 50. Page 50 Encumbrances – As outlined earlier in this report within the Title Encumbrances section, an encumbrance can have a positive, negative or no effect on a property depending on the nature of the encumbrance. The subject property has no encumbrances registered against the land title that affect the subject property value. None of the comparables required adjustments to reverse the effect the encumbrances would have had on the sale prices. Therefore, no adjustments were required under this heading. The following chart summarizes the overall net adjustment required to each of the comparables and contains further brief comments surrounding the adjustments that were deemed necessary.
- 51. Page 51
- 52. Page 52 Conclusion After making adjustments, the average, minimum and maximum adjusted unit prices for the comparables are as shown in the chart below. In weighing the adjusted sale prices for the three most recent comparables and those comparables that are the most overall similar with the least overall net adjustments, and in considering the average adjusted unit price and current market conditions within Calgary, the concluded market value estimate of the subject land as if vacant is represented in the following table:
- 53. Page 53 CAPITAL COST ANALYSIS The application of the Cost Approach to value involves estimating the total reproduction cost of the improvements as if new. These cost estimates are then depreciated according to the physical deterioration, functional depreciation and external depreciation inherent within the property. This in turn results in a depreciated value of the improvements which is then added to the estimate of land value as if vacant to yield an overall indication of the market value of the subject property via Cost Analysis. To facilitate a review of the reproduction cost new of the subject improvements, the writer's investigations have concentrated on two basic areas. Initially, conversations have been held with various contractors and sub-contractors serving the subject area. A brief description of the improvements was provided and cost estimates thereby extracted. This information is considered to be key, and has been emphasized. As well, Internet research was conducted to determine published costs from various other contractors also serving the subject area. Then, depreciation was estimated, which is discussed in detail next. DEPRECIATION ANALYSIS Depreciation may be defined as a loss in value due to any cause. Further, accrued depreciation may be defined as the actual depreciation existing within a property as at a given date. The following includes a general discussion on the various forms of depreciation considered applicable to the subject improvements. Physical Deterioration The analysis of physical deterioration focuses strictly on incurable items. Two methods exist to estimate depreciation, or a straight line "age/life" analysis or a modified "age/life" analysis. The straight line "age/life" analysis derives a rate of depreciation by contrasting the estimated effective age of the improvements to the projected economic life span. The modified "age/life" analysis derives a rate of depreciation by contrasting the estimated effective age of the improvement to the projected economic life span and referencing these variables to the Marshall & Swift Depreciation Tables. The straight line "age/life" analysis typically applies to buildings located within rural areas or small urban communities where building values depreciate at a more constant rate with time. Conversely, the modified "age/life" analysis typically applies to buildings within major urban areas where building values depreciate at a slower rate due to a greater demand for buildings within major urban areas. In both cases, physical depreciation for buildings at or beyond the end of the economic life span that are still functional typically plateaus at 80% depreciation. Thus, the remaining economic life for such buildings is estimated to be 20% of the economic life span. Although the subject property is located within an urban area, physical depreciation was derived based on a straight line "age/life" analysis, as a church within an urban area with a limited demand for re-sale tends to physically depreciate at a regular rate similar to improved properties within rural settings that also have a limited demand.
- 54. Page 54 The following table highlights the effective age and economic life span utilized for the subject building along with the corresponding estimated physical depreciation percentage: KEY BUILDING IMPROVEMENT ECONOMIC LIFE EFFECTIVE AGE REMAINING ECONOMIC LIFE PHYSICAL DEPRECIATION Church with Classrooms 60 25 35 42% Although the subject building has a chronological age of 30 years, the recent replacing of 75% of the subject building roofing in 2011 and the property management of the three roof top HVAC systems have resulted in 75% of the roofing and these three systems as being in good mechanical condition. Therefore, an effective age moderately lower than the chronological age of 30 years, or 25 years was concluded. Again, physical depreciation was derived based on a straight line "age/life" analysis for purposes of this application of the Cost Approach given the rate of physical depreciation for churches within major urban areas more closely follows a relativity constant rate of annual physical depreciation. This is unlike commercial properties within urban areas that have a less constant and lower rate of physical depreciation that more closely follows the depreciation rates for commercial properties chart contained in the Marshall Valuation Service guide. A similar process was followed to estimate the depreciated value of the site improvements recognizing that shorter life spans would apply. Functional Depreciation Functional depreciation, curable and incurable, refers to a loss in value due to the inability of a structure to perform its proper function efficiently, arising from various physical characteristics. Functional depreciation can also be in the form of super adequacies that commonly exist in the form of above average features and/or finish. A uniquely designed church has a limited market and thus a degree of functional depreciation is commonly present, which is unique for each church and difficult to separate from physical depreciation. From a church usage perspective, the subject building appears on the surface to have some degree of functional depreciation in the form of its unique church/classroom mixed usage, a sidewalk that is not wheel chair accessible, a large amount of smaller sized classrooms and an excessively large building with a large gym. However, from a school usage perspective, functional depreciation would be only in the form of having no significant amount of playground area given the 1.35 acre lot size and a large chapel area. To assess whether churches experience functional depreciation and to what degree if present, the Appraiser performed a detailed analysis of the depreciated values of the comparable sales used later in this appraisal during the application of the Direct Comparison Approach. The premise of this analysis is to deduct from the time adjusted sale price of each building an estimated value for land and site improvements to isolate the depreciated value of the building. Once this is calculated, then the ratio of this depreciated value to the reproduction new cost of the building is calculated to derive an overall building depreciation percentage, which is then converted to a depreciation rate per year based on the building age. This information was then analyzed to estimate the amount of depreciation that would realistically apply to the subject building given the building’s age and reproduction construction costs. The results of this analysis are as shown in the following chart.
- 55. Page 55 From the above chart and summary, it is observed that the annual rate of depreciation generally declines as the building gets older. That is, a church that is from 21 to 50 years in age generally depreciates at an average rate of 1.56% per year compared to newer and older churches that depreciate at a quicker and slower rate, respectively.
- 56. Page 56 The subject building has a chronological age of 30 years but was concluded to have an effective age of 25 years. Based on the above data, an appropriate range in annual depreciation rates that would generally apply to the subject building would be generally in the order of 1.5% to 2.0% per year given the subject building chronological age of 30 years. In considering that 75% of the subject roofing was replaced in 2011 and that the rooftop heating/cooling systems are good condition due to being maintained by a property management company, an annual depreciation rate at the lower limit of the latter range, 1.5% per year is deemed appropriate for the subject building. When applying this rate to the 30 year age of the subject building, a total depreciation amount of 45% is derived, which is 3% higher than the physical depreciation of 42% calculated via a straight line "age/life" analysis based on an effective age of 25 years and an economic life of 60 years. In view of the preceding, this excess depreciation is deemed to be attributed towards functional depreciation in the order of 3%, which was included in the costing chart to follow. External Depreciation External depreciation is caused by changes external to a property such as economic or environmental forces that shift supply/demand relationships in the market. Factors that could cause a loss in value due to external depreciation would relate to inharmonious or incompatible land uses within the surrounding area, isolated locations, pollution caused by nearby heavy industry, etc. A fairly broad analysis of the local market would indicate that external depreciation is not at play. The subject property in this instance enjoys a positive general location within the Ranchlands residential district of Calgary. Thus, no deductions were required to account for external depreciation under this heading. Deferred Maintenance Deferred maintenance consists of significant maintenance or repairs that are clearly overdue, such as a roof that leaks, an interior or exterior finish that is damaged, or mechanical or electrical systems that are very old, broken down or missing. As identified earlier in this report within the Building Improvements description, a degree of deferred maintenance is present in the form of repainting and replacing flooring in some areas, some minor cosmetic repairs and eventual replacement of the original roofing over the 3,571 square foot gym that is near due for replacement. Therefore, an amount of $50,000 in deferred maintenance costs was estimated to account for the latter pending upgrades, which is deemed to be realistic given the larger size of the overall building and the gym. The following chart summarizes the costing information obtained along with the estimated depreciation.
- 57. Page 57 BUILDING AND SITE IMPROVEMENTS COST CHART Reproduction Cost New Wood Frame Church with 8' to 20' Ceilings 1 14,275 Sq. Ft. @ $300/Sq. Ft. $4,282,500 Mezzanine Office Space With 5 Rooms 1,012 Sq. Ft. @ $100/Sq. Ft. $101,200 Total: $4,383,700 Less: Depreciation/Deferred Maintenance Physical Depreciation @ 42% 2 ($1,841,154) Functional Depreciation @ 3% 3 ($131,511) External Depreciation @ 0% $0 Deferred Maintenance 4 ($50,000) Total: ($2,022,665) Depreciated Value ($165/SF) $2,361,035 Site Improvements (Depreciated) Extension of Services to the Building Inc. 600 Amp Power $15,000 Concrete Sidewalks $10,000 Landscaped Yard with Trees $10,000 Paved Parking $20,000 Sub Total: $55,000 Overall Depreciated Value of Improvements $2,416,035 Plus: Land Value as if Vacant $1,350,000 Value Estimate via Cost Analysis $3,766,035 Rounded To: $3,765,000 Notes 1. Reproduction costs were based on discussions with a representative from Genesis Building Corp. who indicated that a wood frame building of this size and features would generally cost from $250 to $300 PSF given the wood frame design and larger size. The upper limit was selected given the subject above average features in the form of high roof ceilings, commercial grade heating /cooling, woodwork and skylights. 2. Physical depreciation was estimated based on a straight line "age/life" analysis based on an effective age of 25 years and an economic life of 60 years. 3. Functional depreciation was estimated based on an analysis of church sales to determine an annual depreciation rate for church buildings that are in the order of 30 years old. 4. Deferred maintenance is to account for re-painting and re-flooring portions of the building interior and to eventually to replace the gym roof that is soon due for replacement given its age.
- 58. Page 58 Conclusions The Cost Approach has yielded the following depreciated building and site improvements value estimate for the subject property. COST APPROACH VALUE RECONCILIATION Value Estimate Building & Site Improvements (Depreciated) $2,416,035 Land Value As Vacant $1,350,000 Conclusion (Rounded) $3,765,000 The approach has been developed on a realistic basis utilizing costing information derived from a local contractor to construct similar improvements and then deducting accrued physical and functional depreciation based on observed depreciation rates of older churches that have recently sold within Calgary and then deducting an estimated amount for deferred maintenance.
- 59. Page 59 DIRECT COMPARISON APPROACH TO VALUE The Direct Comparison Approach draws heavily upon the principle of substitution. In essence, this principle states that a prudent purchaser will pay no more for any particular property than it would cost him to acquire an equally desirable alternate property. This approach consists of the comparison of similar properties, which have recently sold or are currently being offered for sale. This comparison process involves making adjustments between the subject property and the comparable properties on an item-by-item basis. The factors considered in the comparison include date of sale, conditions of the sale (including financial terms), and physical characteristics. The subject property is the standard, and the adjustments are made to the sale price of the comparable property in order to arrive at an indication of value for the subject. This approach is most applicable to vacant land and improved properties that are owner occupied. The weakness of this approach includes the fact that there may be inadequate data in the marketplace to justify its use, the fact that it is based upon historical data rather than future expectations, and the fact that the conditions of comparability may not closely conform to the subject property. Its strength lies in the fact that it reflects actual market behavior of typical purchasers under current market conditions. In short, the reliability of this approach depends upon the comparability of the comparable properties, verification of sales data, the conditions under which the property is sold, and the date of the sale. In order to estimate the value of the subject property as improved, the local Real Estate Board system was first searched for comparable open market transactions and real estate brokers were consulted for information on listed and sold properties that would be in competition with the subject if it were offered for sale on the open market. Listed on the following pages are the comparable sales selected and used in this analysis. Emphasis was initially placed on searching for recent open market sales within the subject local market area. However, due to a limited number of such sales being available for analysis, research was extended to include a broader area, an extended period and include researched private arms length transactions as defined earlier in this report. Nevertheless, the appraiser believes that the selected comparables represent a sufficient sample of the data to estimate the market value of the subject property from this approach. .
- 60. Page 60
- 61. Page 61
- 62. Page 62
- 63. Page 63
- 64. Page 64
- 65. Page 65 Improved Sales Analysis Comparable Sales Location Map
- 66. Page 66 Listed on the preceding pages are those church sales deemed to be the most comparable to the subject church, which are illustrated in the previous location map. To arrive at a value conclusion for the subject, it is necessary to adjust the comparable sales prices for characteristics that are dissimilar from those of the subject property. The characteristics that may require adjustments include property rights, financing/sale terms (cash equivalency), conditions of sale, non-sale status, market conditions (time), and physical characteristics such as location, size, quality of construction, amount of interior finish out, occupancy, zoning, visibility and alike. In developing the Direct Comparison Approach involving churches such as the subject property, consideration can be given to several forms of unit of comparison measures to quantify adjustments to arrive at a market value estimate for the subject property. Common units of comparison measures involve utilizing either a unit value per square foot of building footprint, above ground area, total usable area, or simply utilizing overall values/sale prices. The former per square foot approach is most applicable when building and site sizes of the subject property and the selected comparables are relatively similar and when the building key areas are relatively homogeneous in design and finish. In this instance, a wide range in building and land sizes exist and the building key areas range from main level, second level, mezzanine level and basement level space with varying ceiling heights and interior finish. Therefore, the unit of comparison will be developed on the basis of “Overall Values”. The value of the key features that were deemed different between the comparables and the subject property were quantified in total dollars and then adjusted using percentages according to an estimated difference in the overall value of the key feature. Those features requiring adjustments will be discussed in the following narrative and summarized in a subsequent adjustment chart, which contains further adjustment notes. Discussion of Adjustments Property Rights - The transaction price of a comparable sale is always based on the real property interest conveyed. In this instance, an adjustment for this attribute was not considered necessary for any of the comparables. Conditions of Sale - Adjustments made for conditions of sale usually reflect atypical motivations of the buyer and seller at the time of conveyance. A sale may be transacted at a below market price if the seller needs cash in a hurry. A financial, business, or family relationship between the parties may also affect the price of property. Interlocking corporate entities may record a sale at a non- market price to serve their business interest. When non-market conditions of sale are detected in a transaction, the sale must be thoroughly researched before an adjustment is made. Within the confirmation process, detailed attention was made to ensure the conditions of each comparable sale. Based upon the research performed, it is believed that all of the comparable sales involved regular arms-length transactions without the presence of duress or adverse market influence. As such, no adjustments were warranted.
- 67. Page 67 Financing/Sale Terms - The price paid in acquiring a property may be influenced by atypical financing and/or sale terms involved, if any. Above or below market financing or special sale terms could have a negative or positive affect on the price paid. Therefore, some method of converting these financing and/or sale terms to cash must occur so that the adjustment process may be applied to the affected comparables. In reviewing the comparables, an adjustment was not required for atypical financing or sale terms to any of the comparables. Market Cond./Time Net Adjustment Percentage - Market conditions may change between the time of sale of a comparable property and the date of the appraisal of the subject property. Changed market conditions often result from various causes, such as inflation or changes in demand and/or supply. Time itself is not the cause for the adjustment. Historical sales and market research revealed that property prices have been fluctuating over the past five years. Increasing in construction costs were driving improved property values up since 2011 when it became evident that Alberta’s economy was recovering following the recession period during 2009 and 2010 after the onset of the financial global crisis that occurred during the fall of 2008. However, construction costs began declining since January 2015 when oil prices dropped resulting in a slowdown in Alberta’s economy. In view of the preceding, upward timing adjustments of 5% per year pro-rated monthly was applied to those sale that had sold prior to January 2015 up to January 1, 2015 followed by a downward adjustment of 3% per year pro-rated monthly that was applied to all sales between January 1, 2015 and the effective date of this appraisal, or May 2, 2016. The remaining adjustments required to account for differences in locational, physical and zoning characteristics are identified in the following chart, which contains brief comments surrounding the adjustments that were deemed necessary. General Location Within Calgary - Location considerations include such factors as size of the municipality in which the property is located, the location within the municipality, proximity to major urban areas plus accessibility to transportation routes. When reviewing the comparables, it was determined that the locations of the first four comparables are relatively similar to the subject property peripheral city location and therefore no location adjustments were required to any of these four comparables. However, Comparable 5 warranted a downward adjustment to account for the relatively central Calgary location, which is in close proximity to the Calgary downtown area as well. Building Size - The subject gross building footprint area (GBA) is 14,275 square feet. The larger the building, the greater the property value and vice versa. When reviewing the comparables, the comparables with an inferior smaller building size were adjusted upward based on the depreciated value of $165 per square foot applied to the difference in size, which was the depreciated unit value of the subject building derived from the Cost Approach previously applied. Conversely, those comparables with superior larger buildings size were adjusted downward using the same factor