Downloaded 60 times


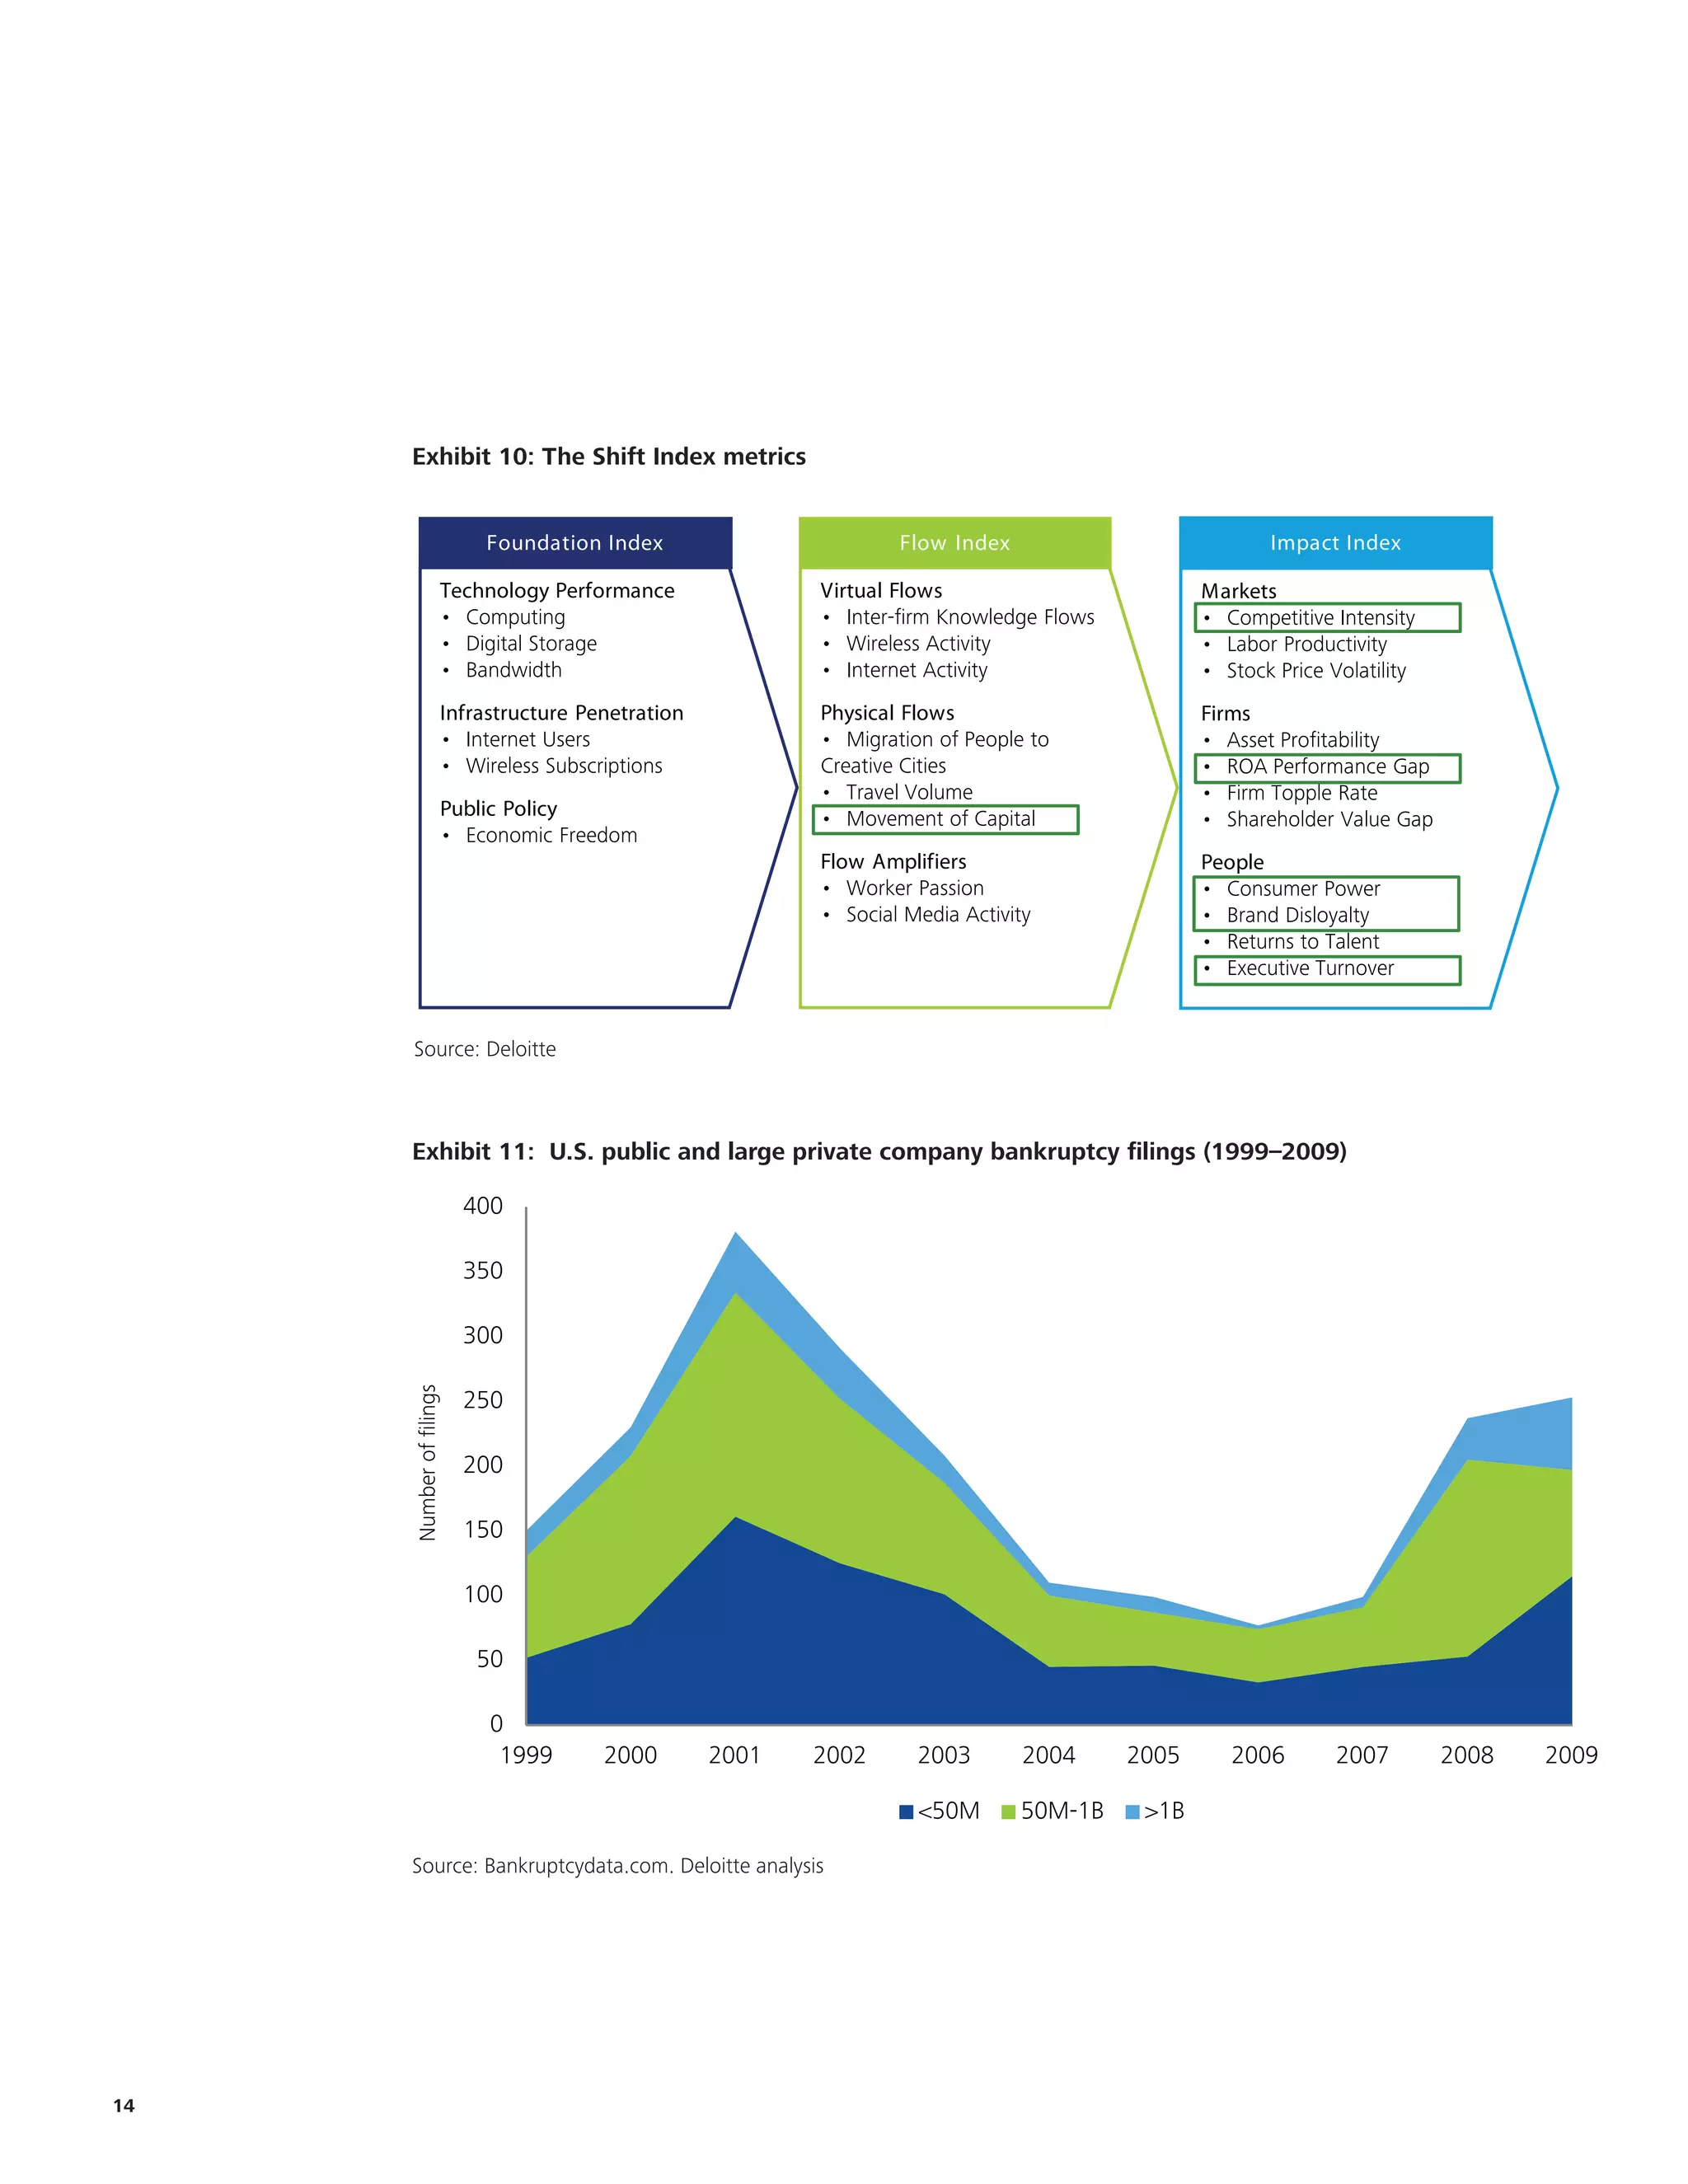
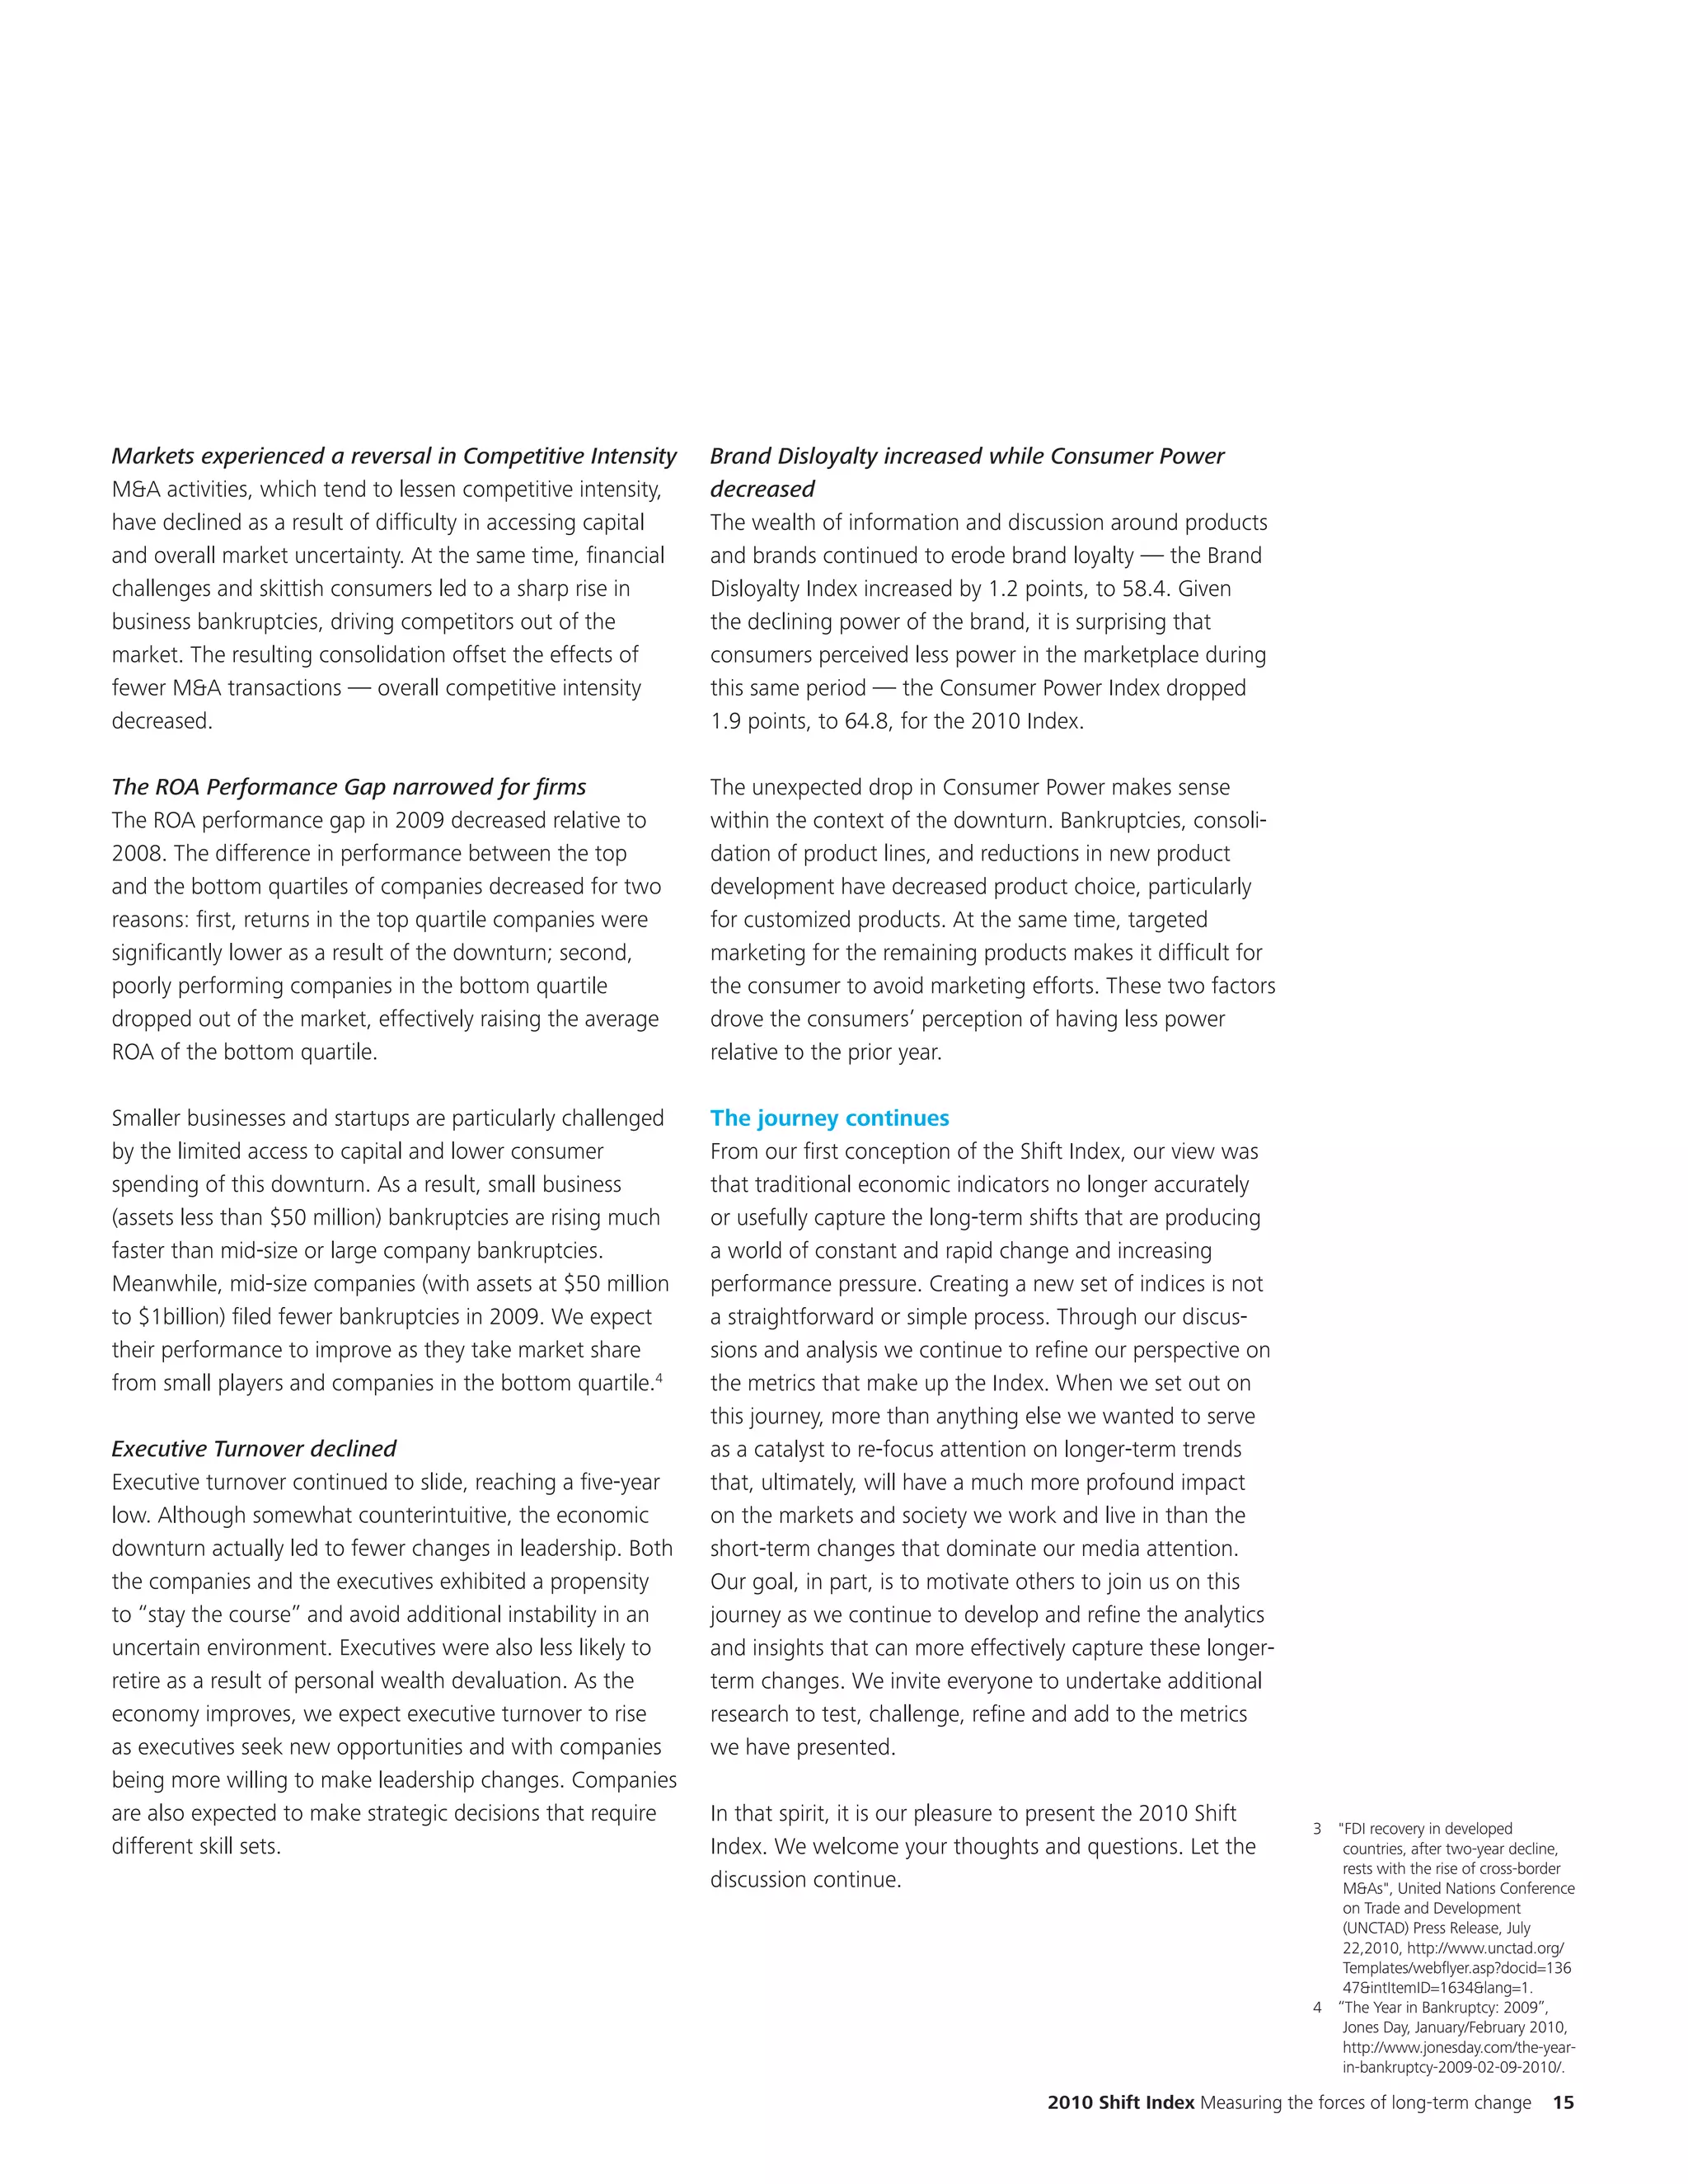
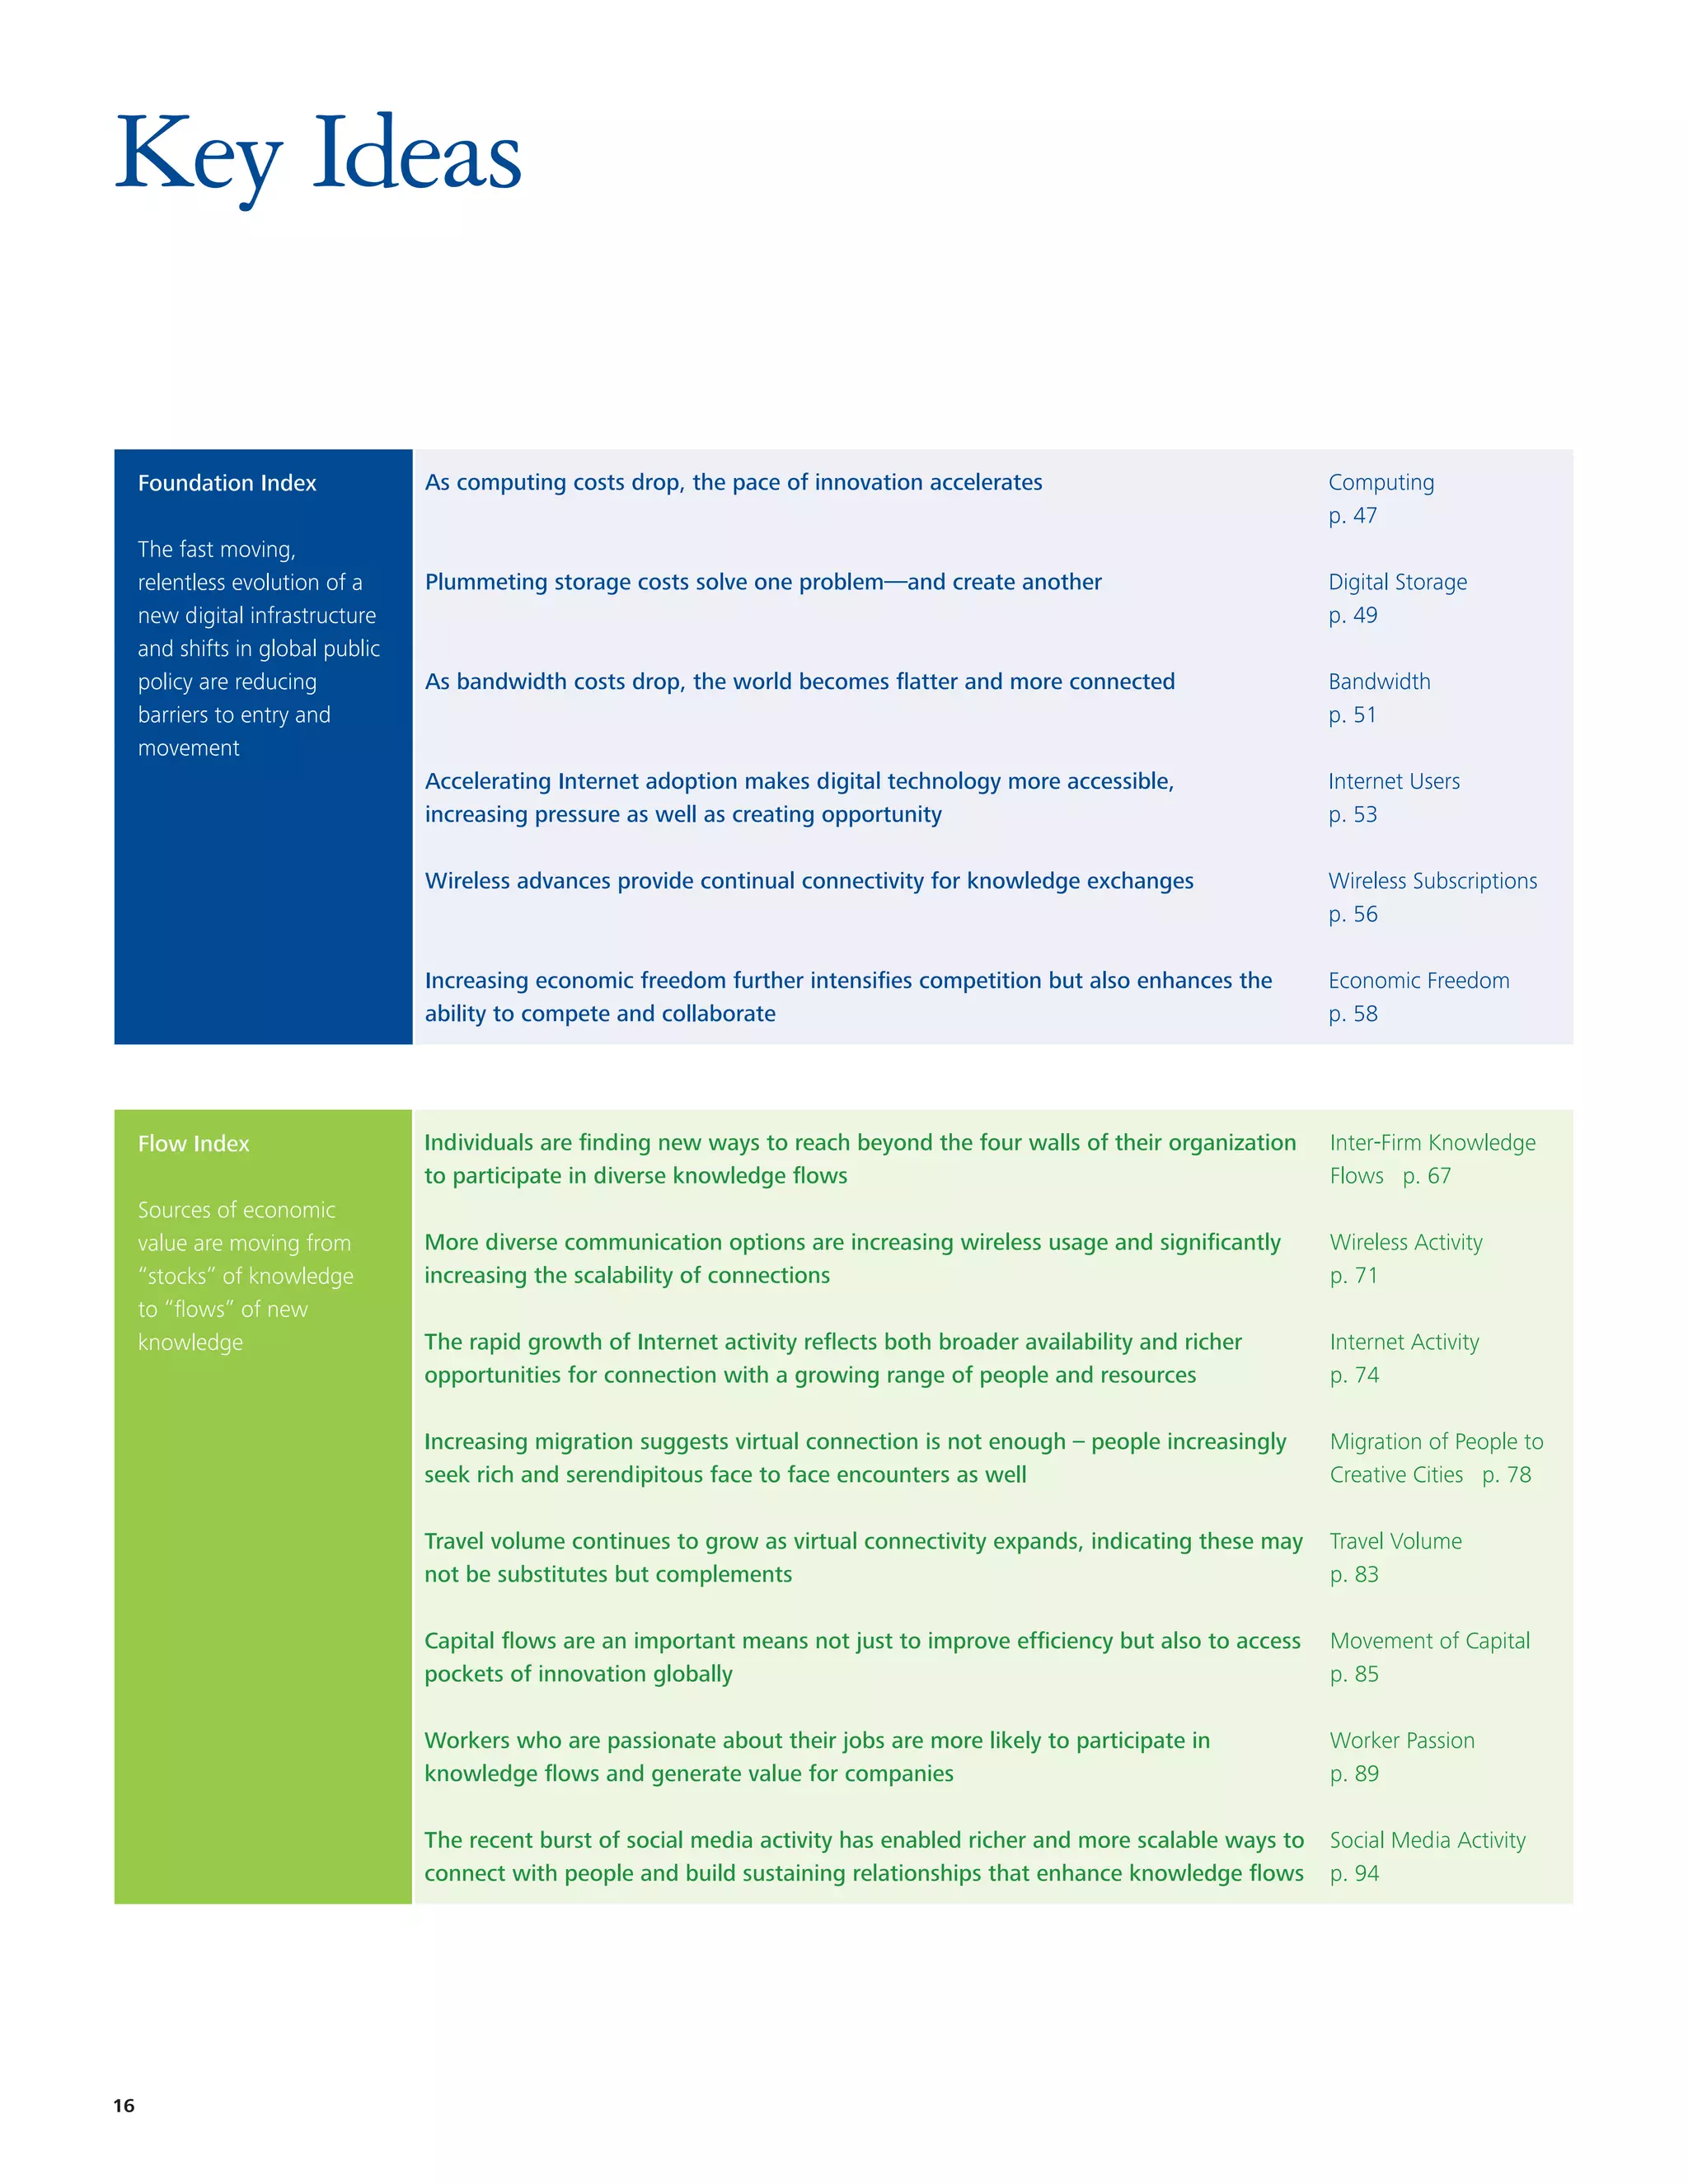
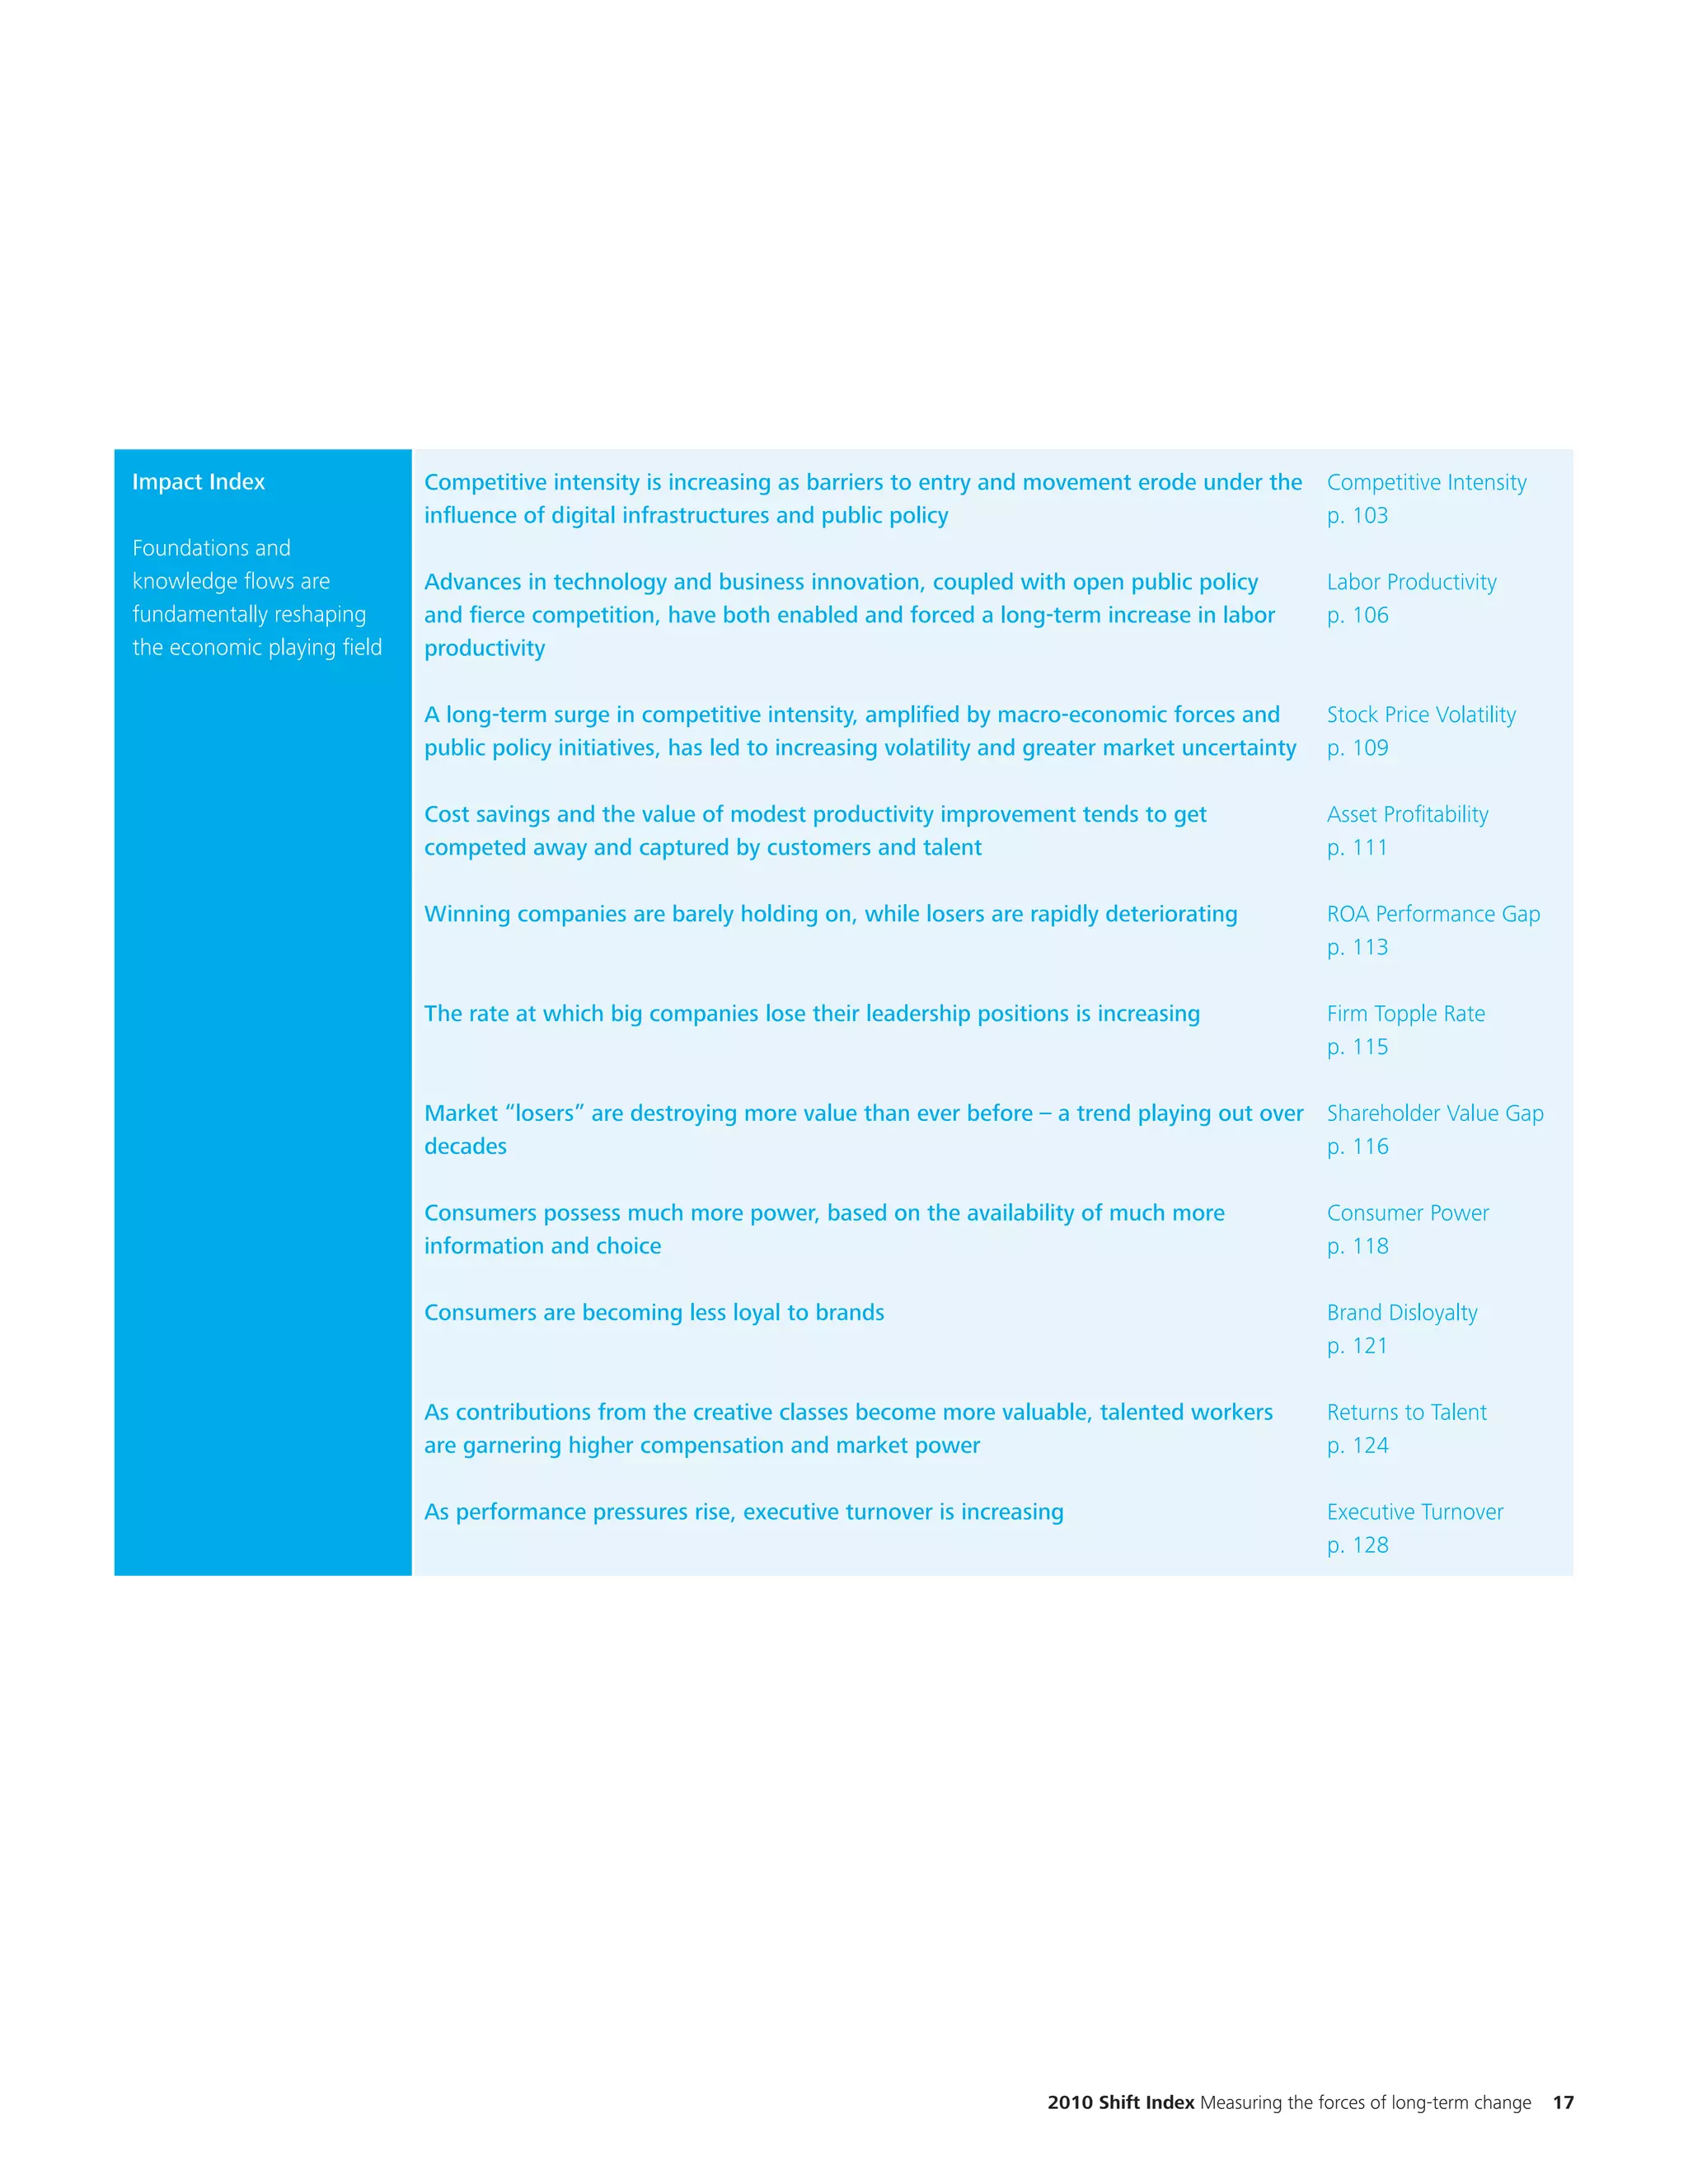
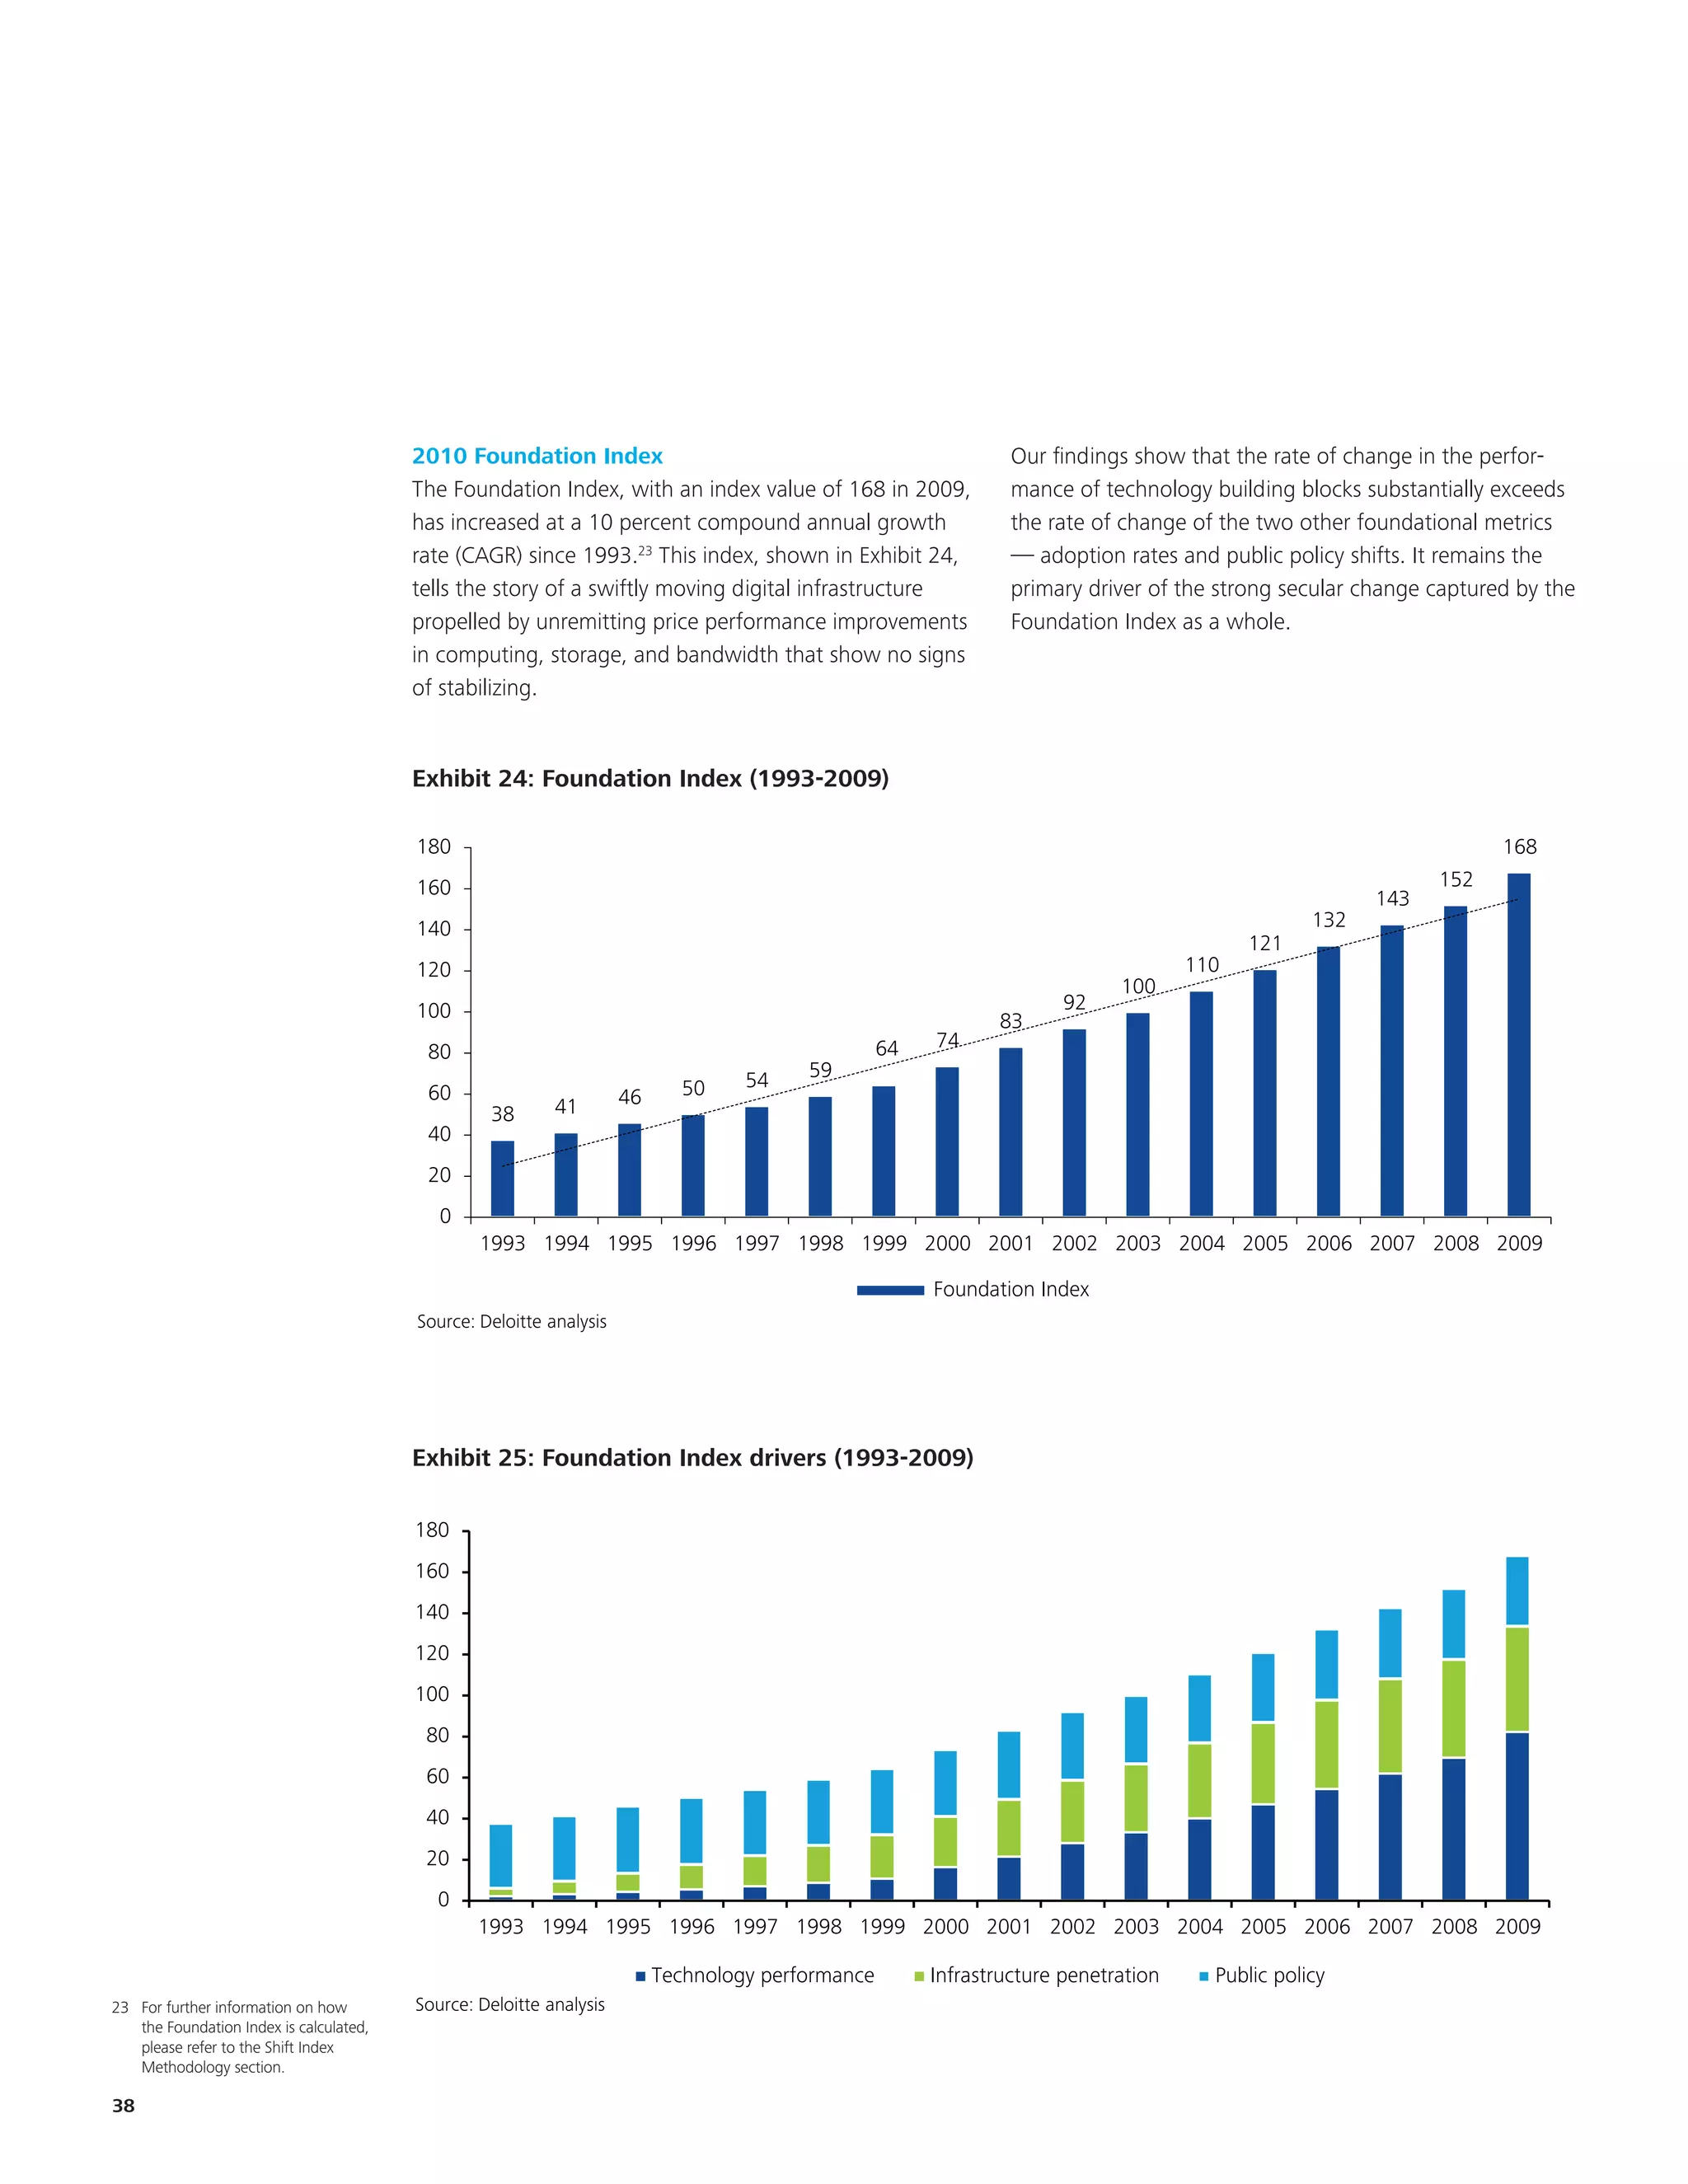

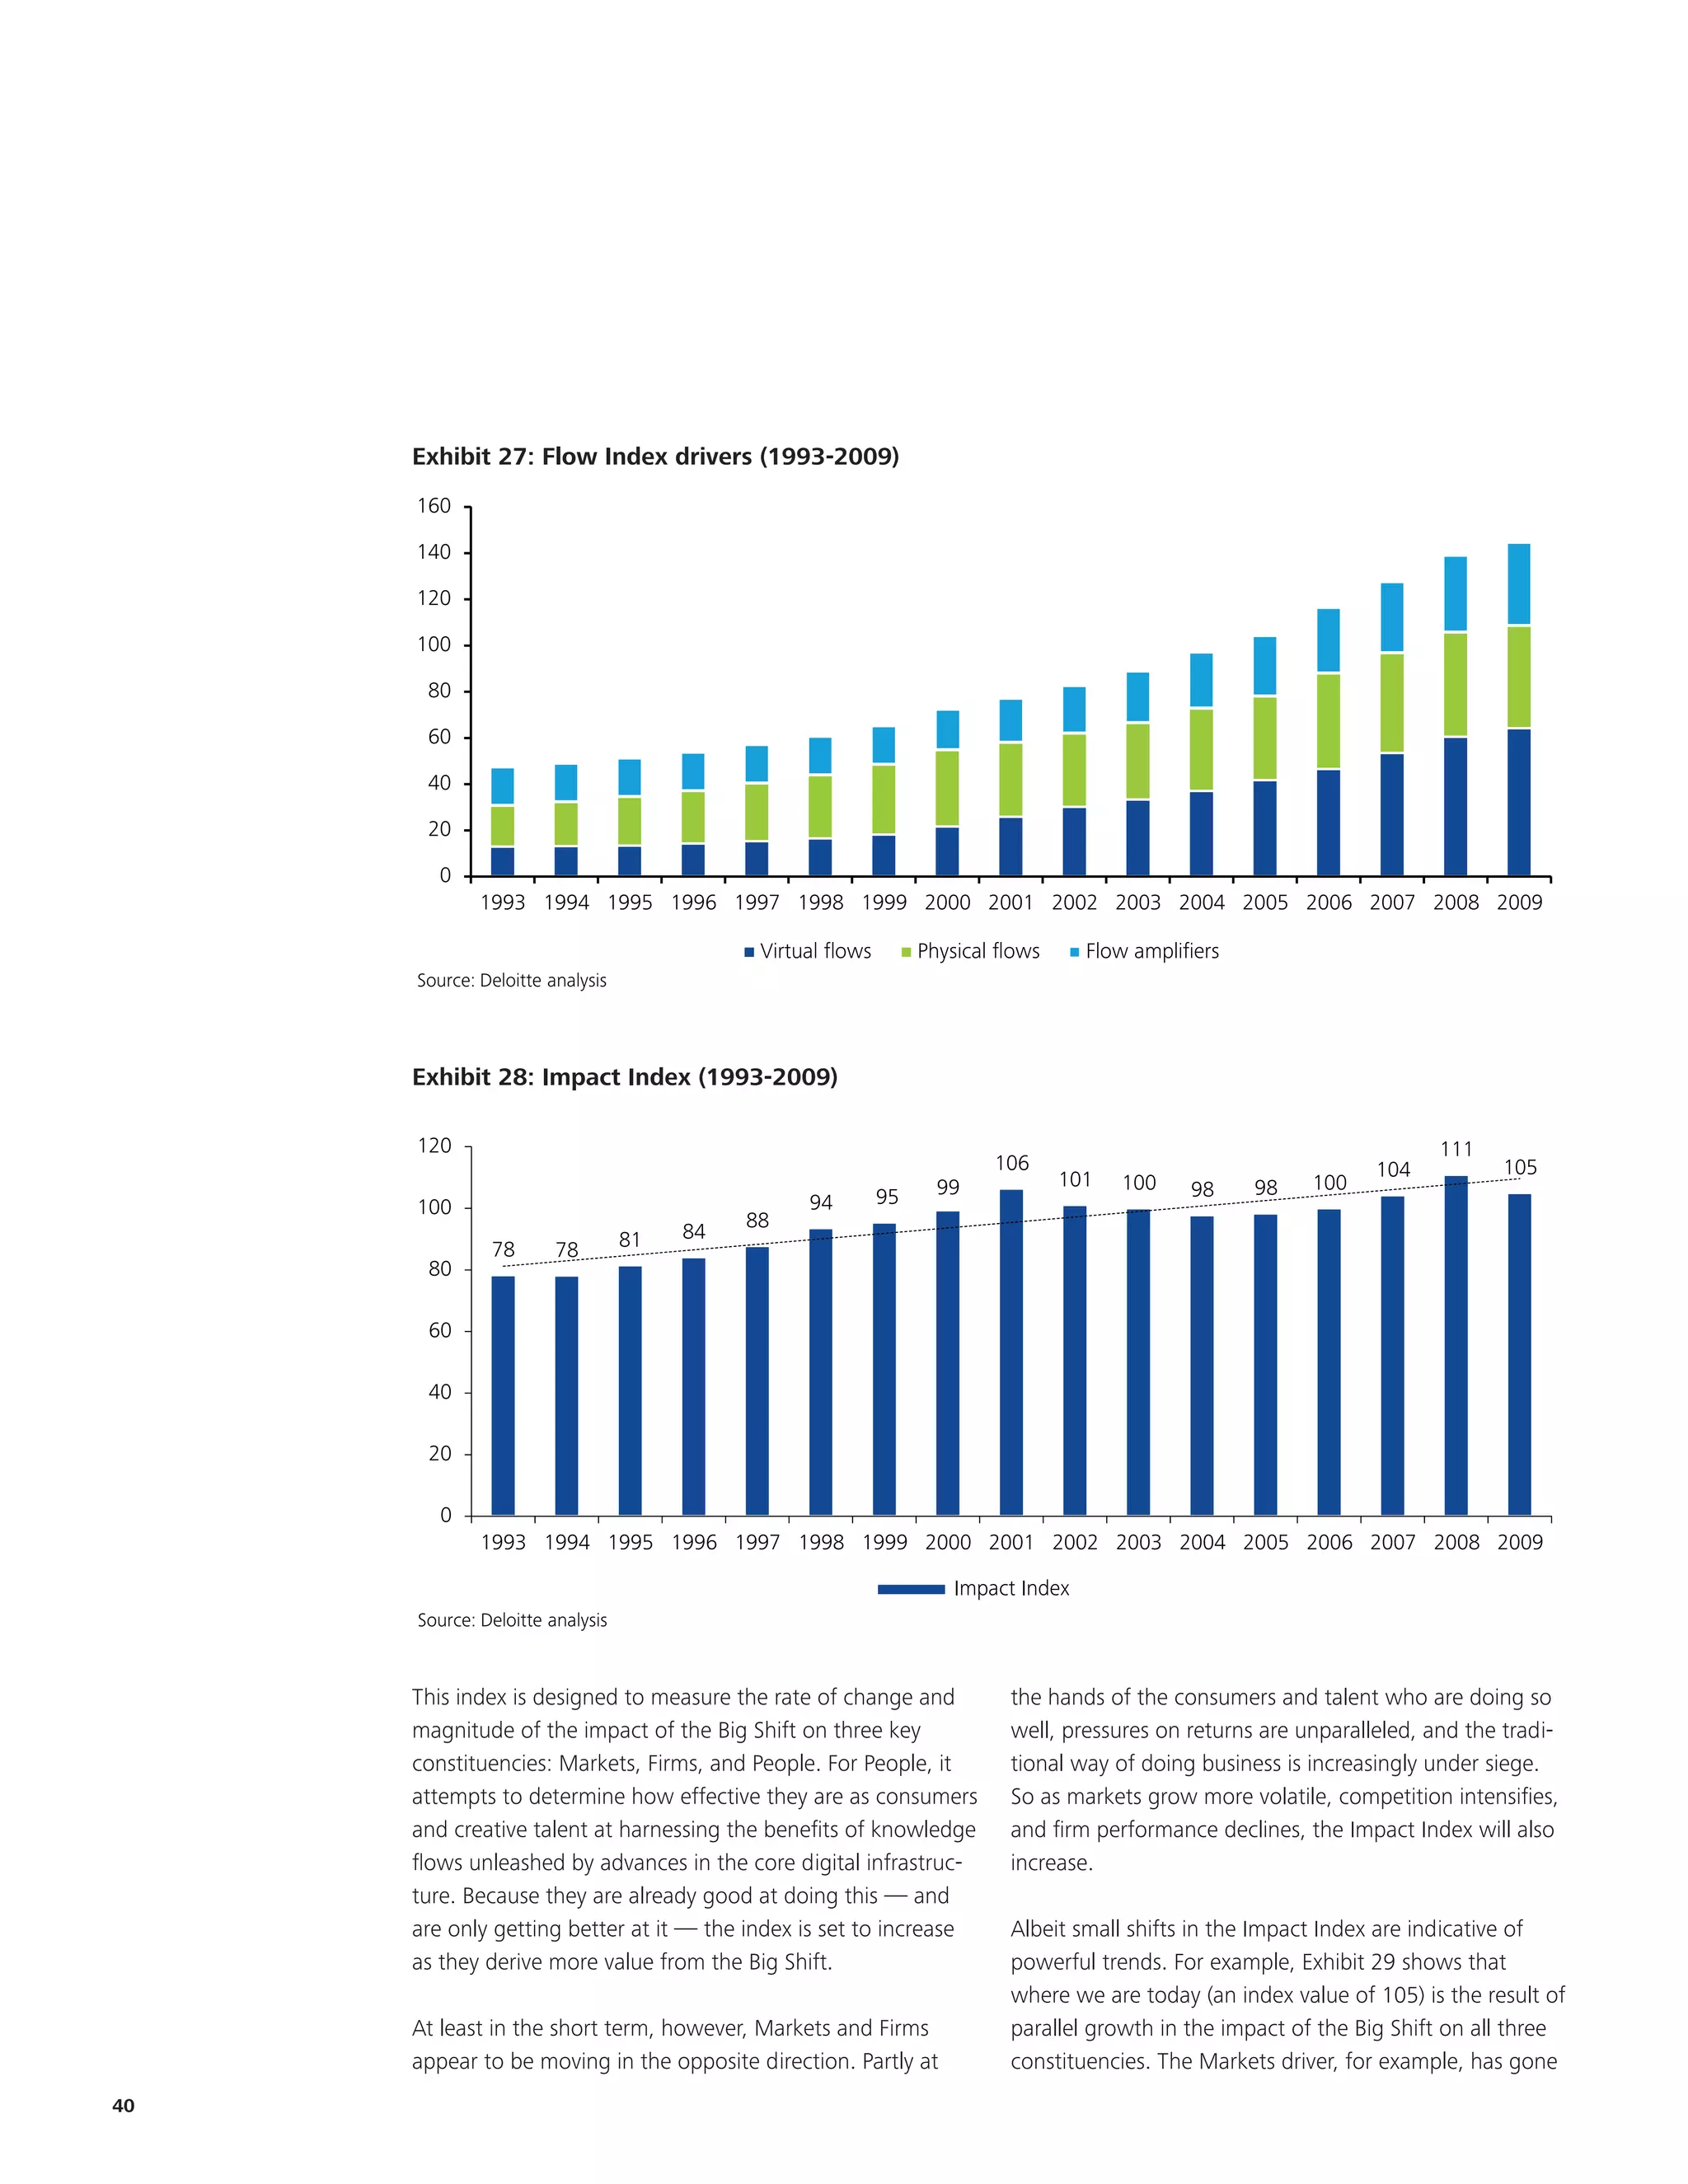
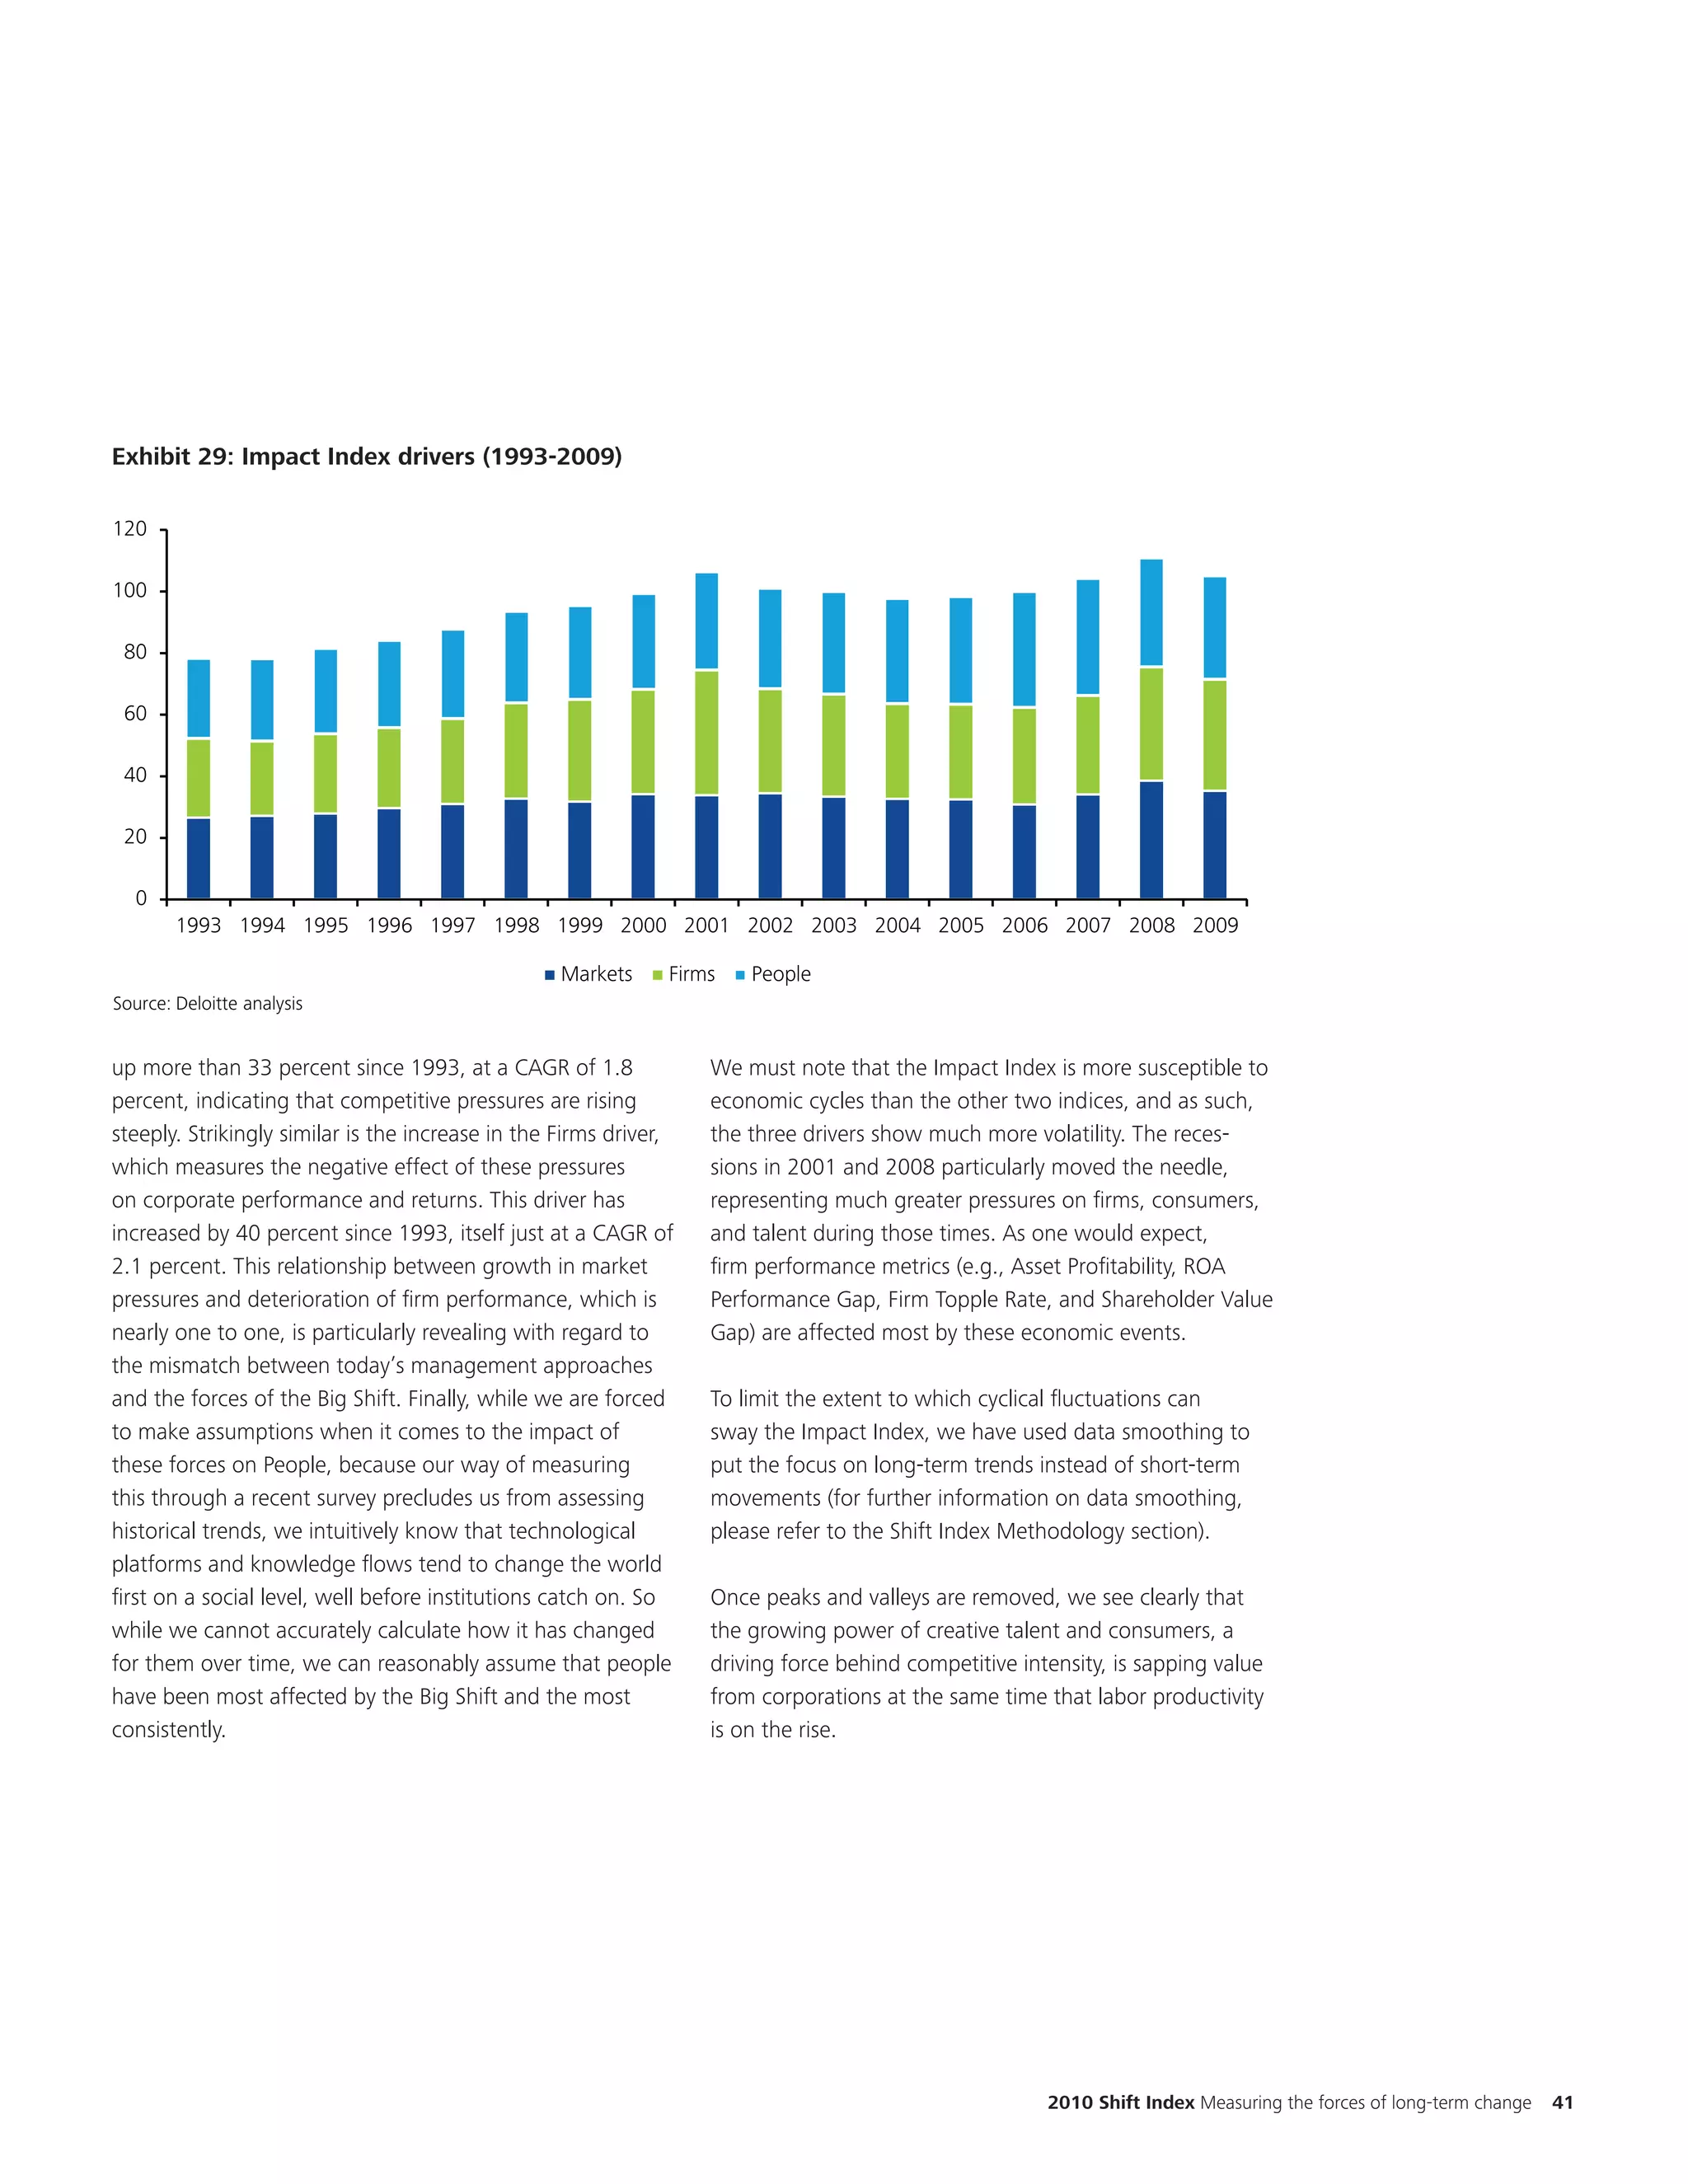

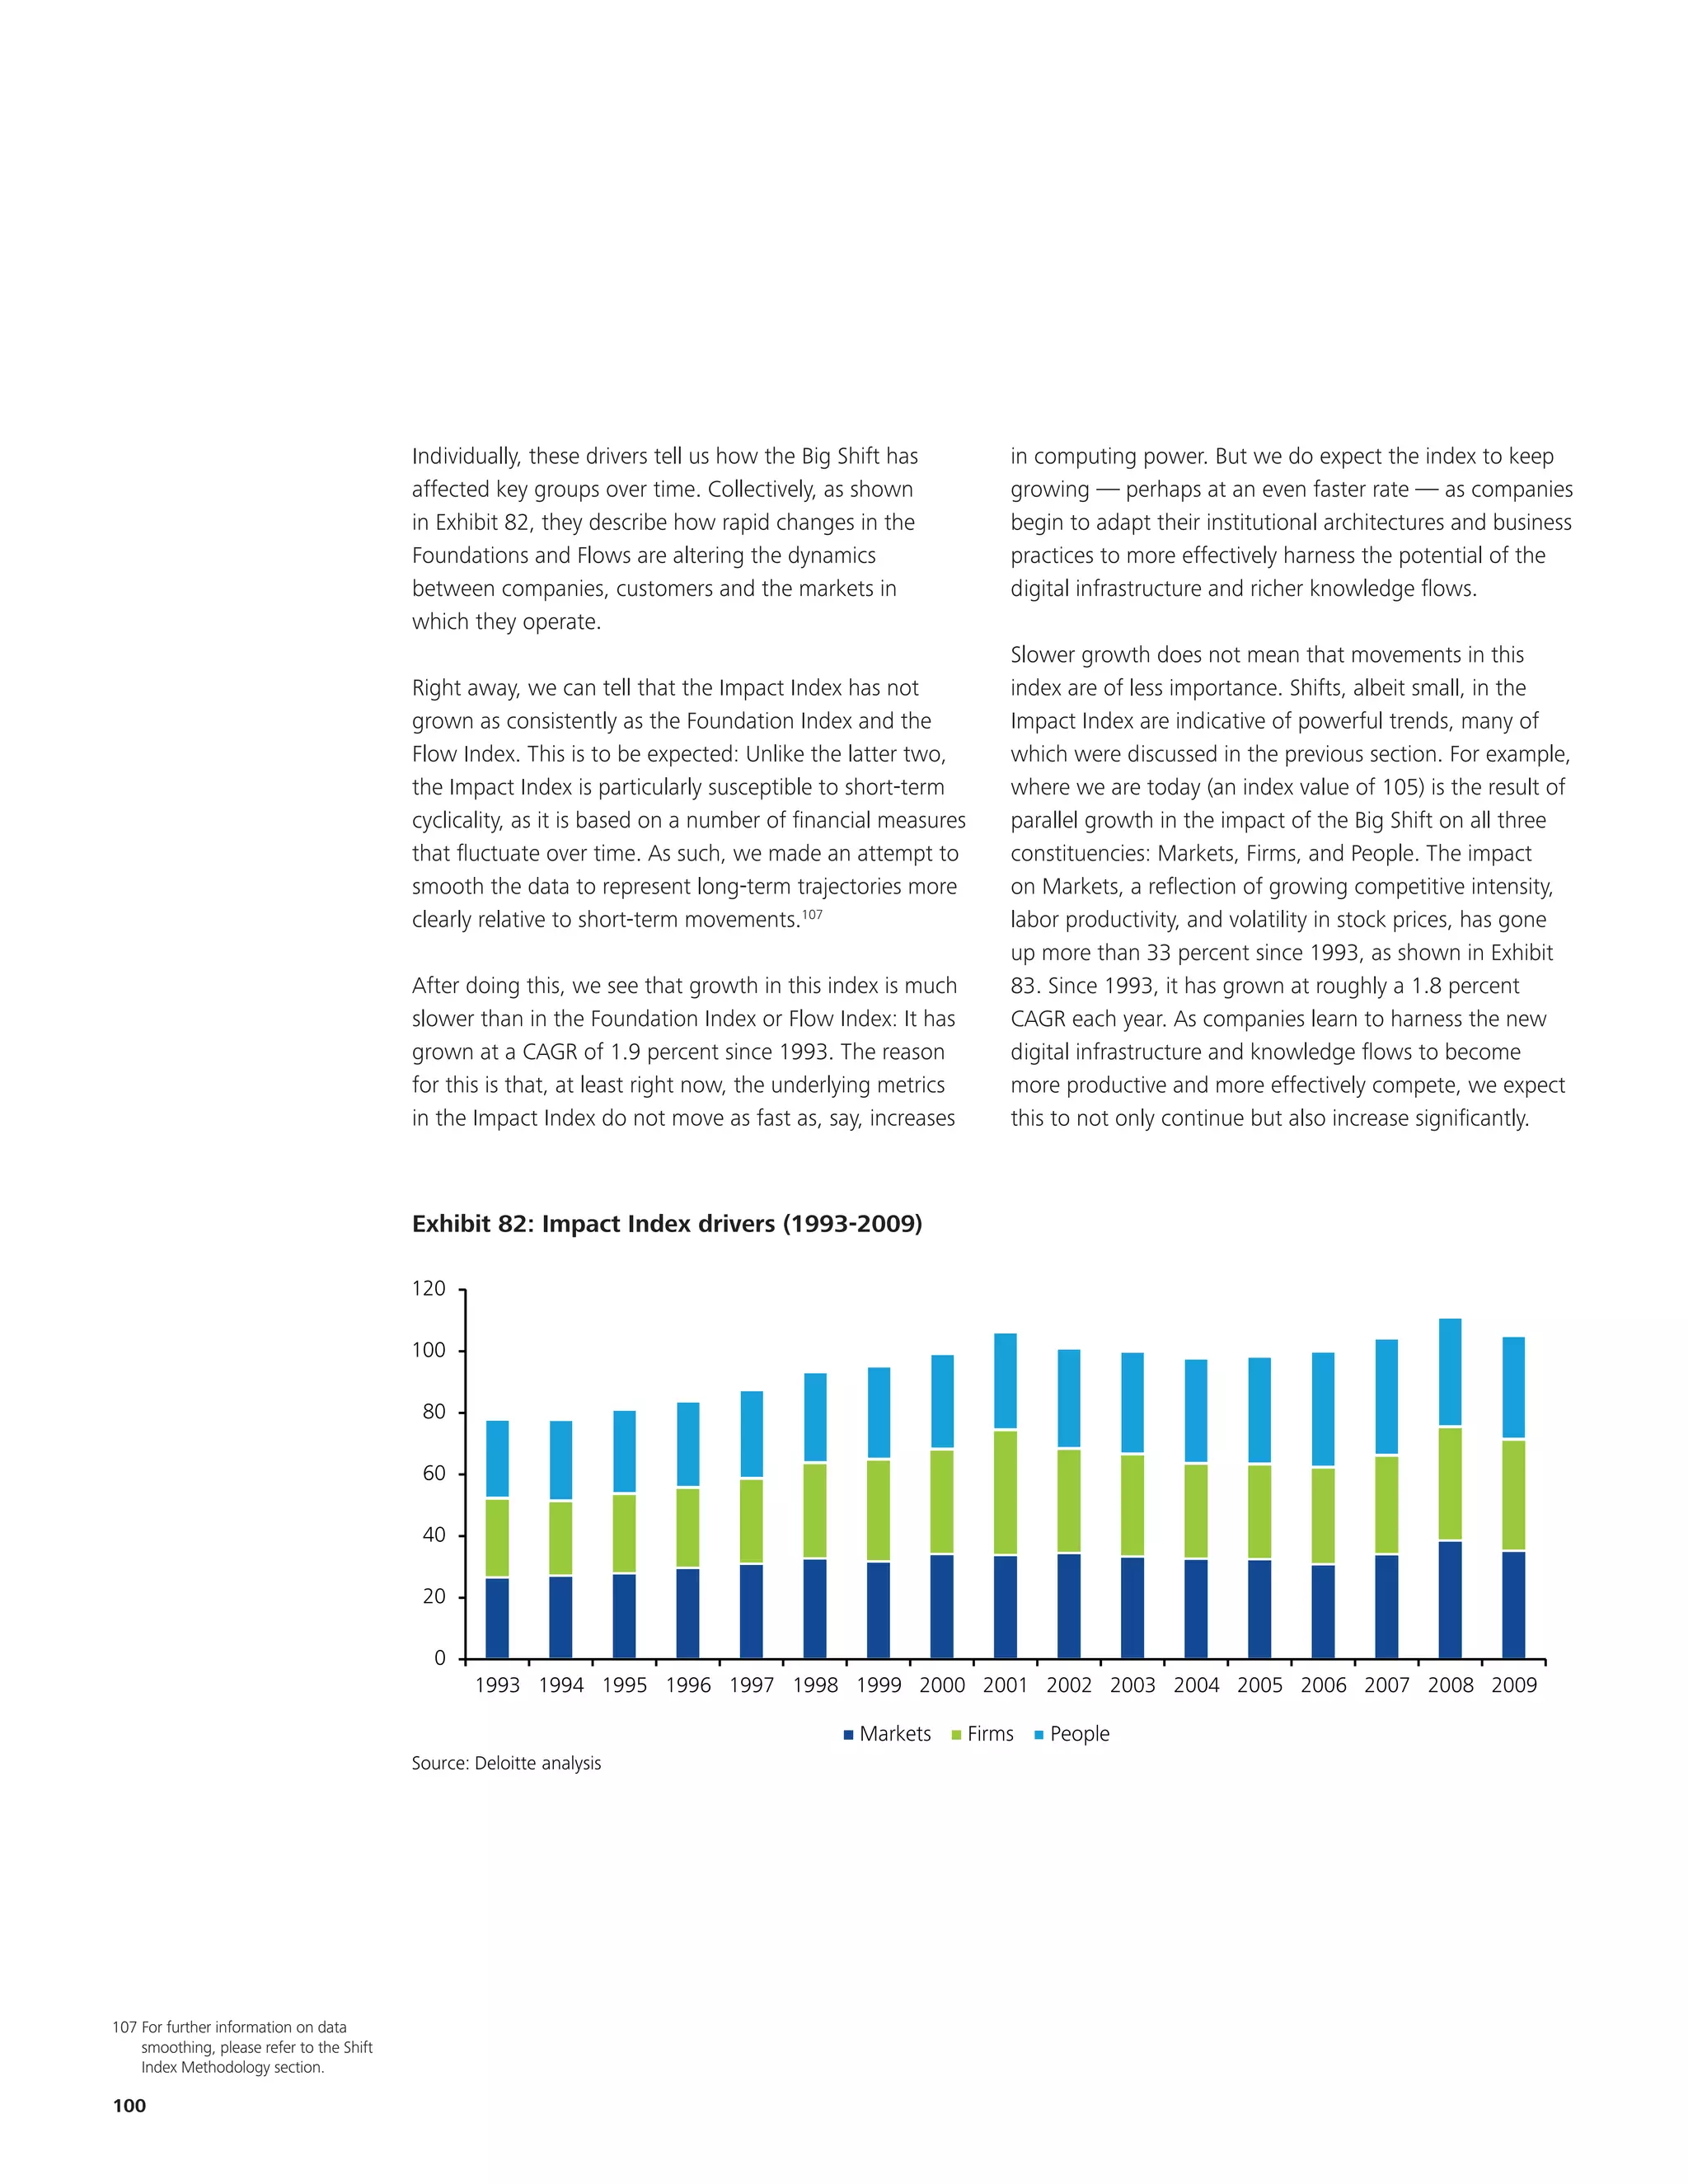
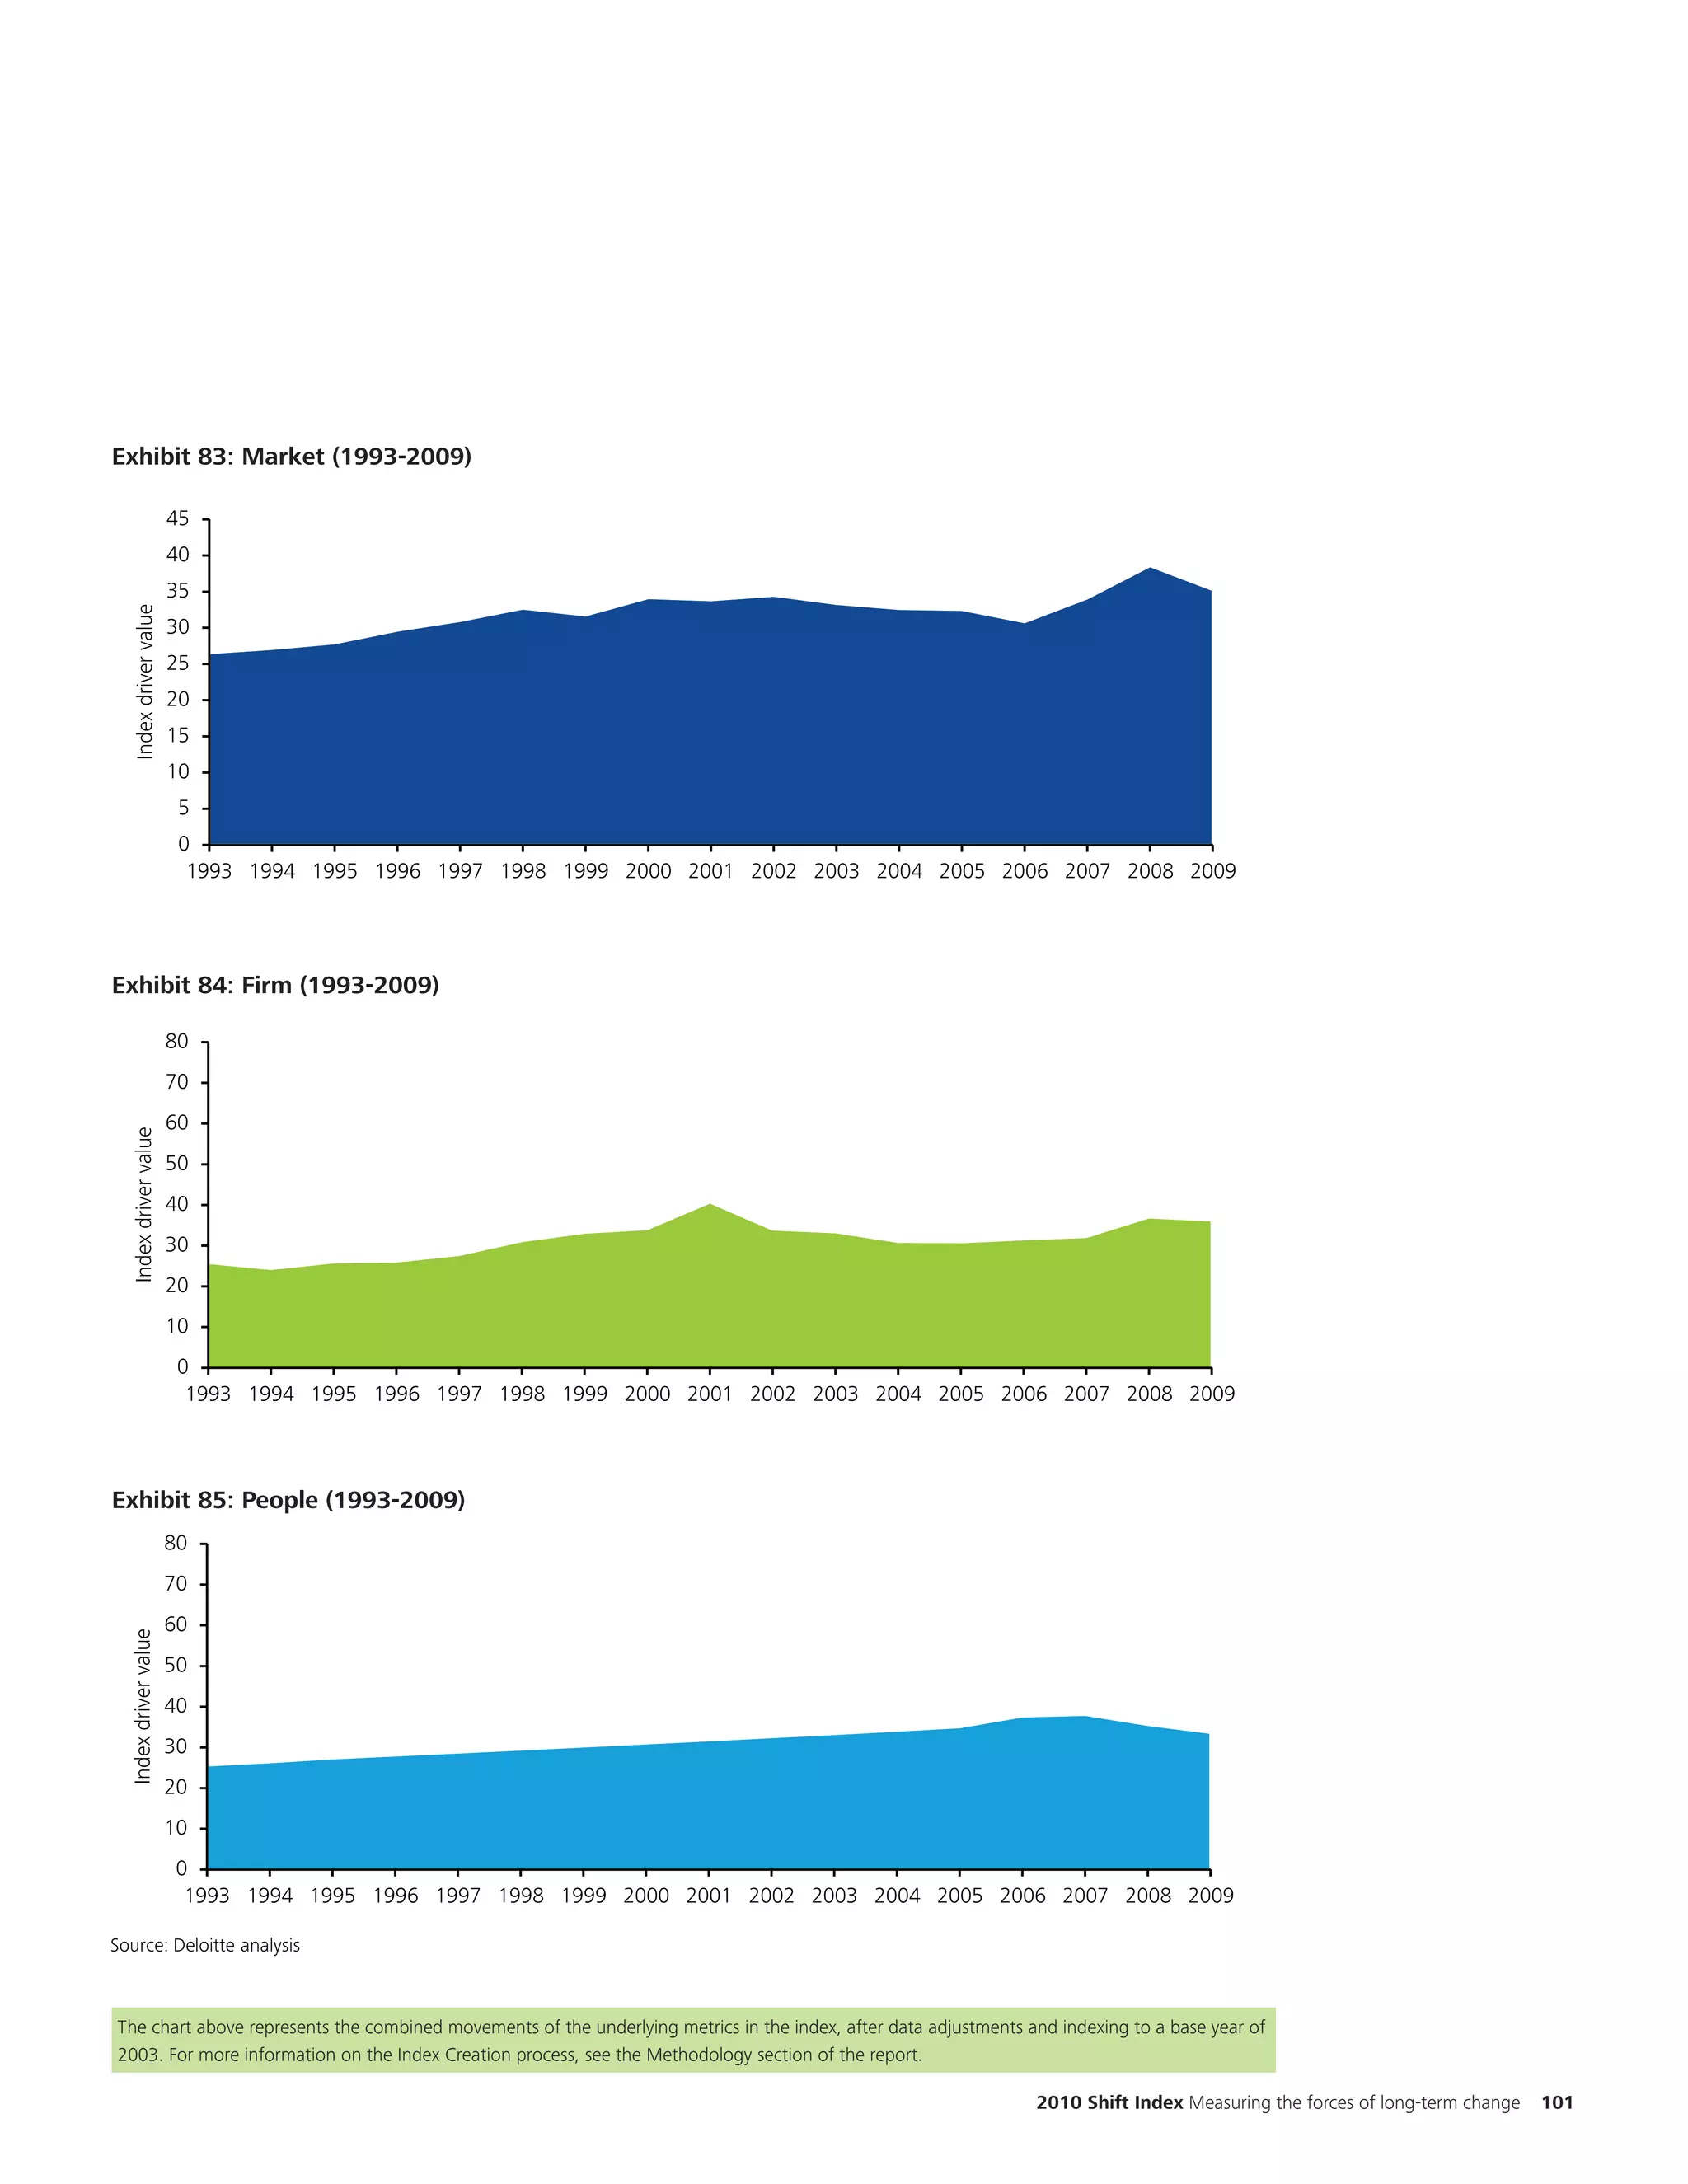
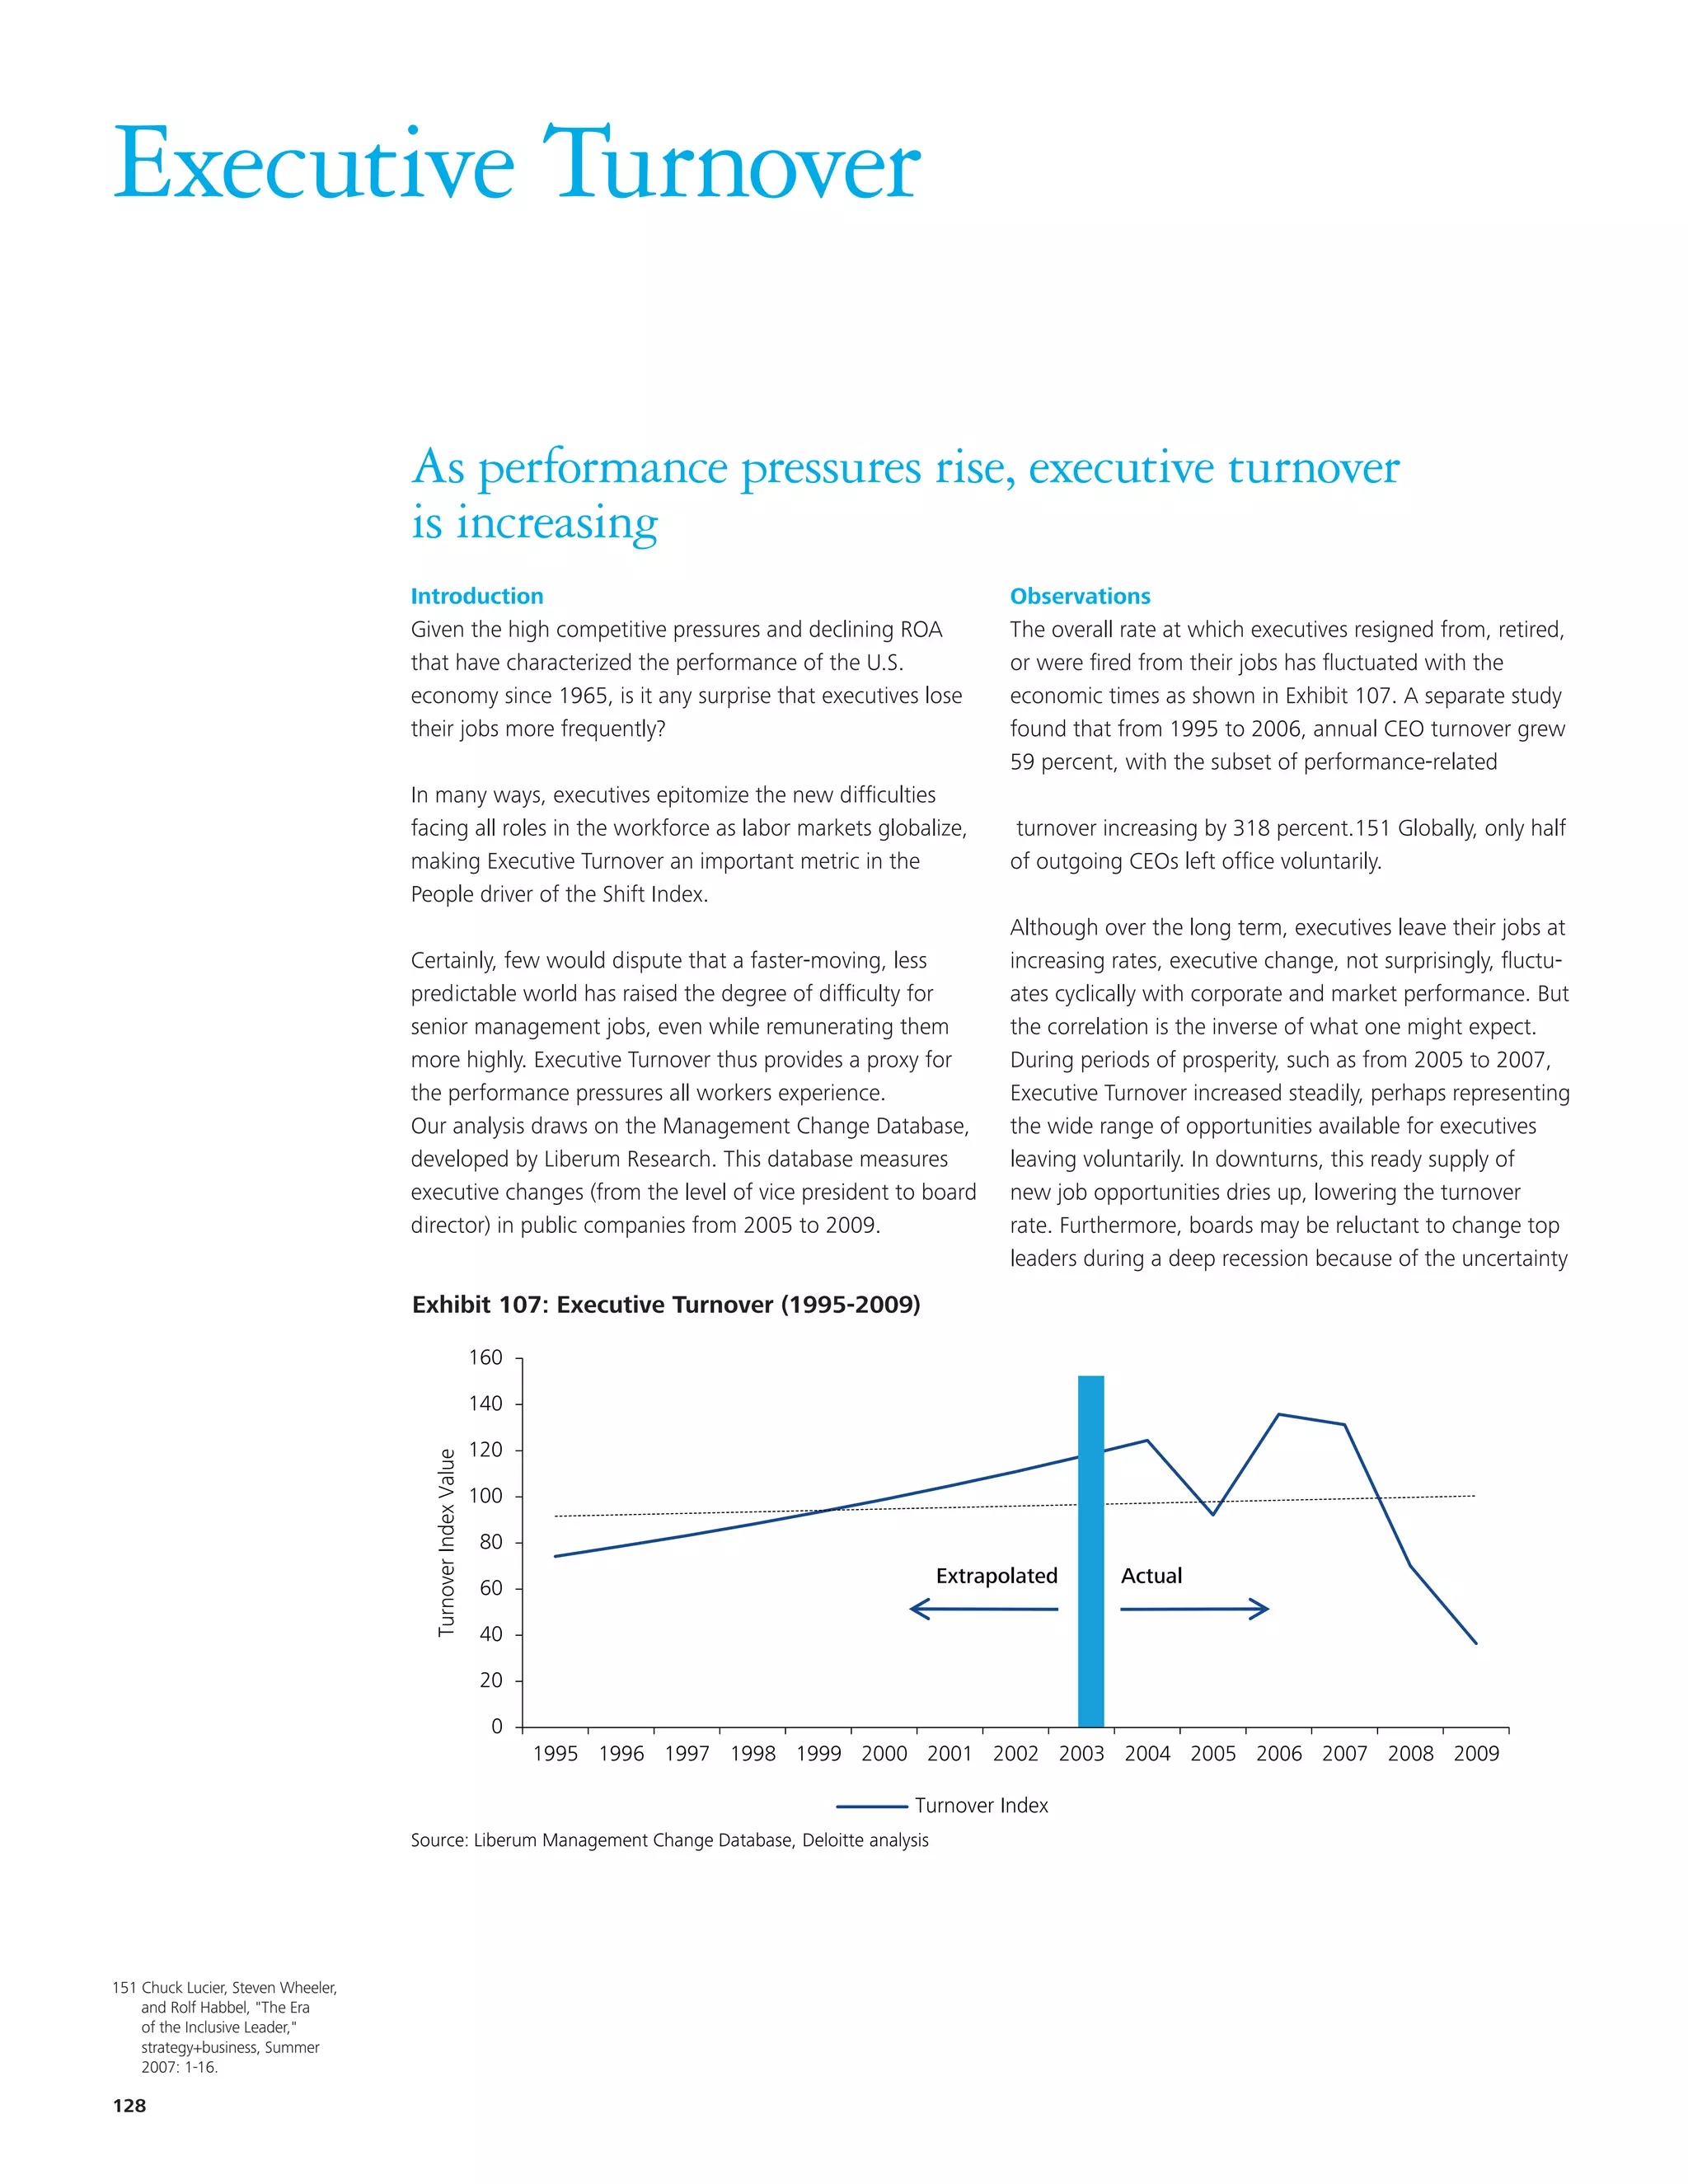

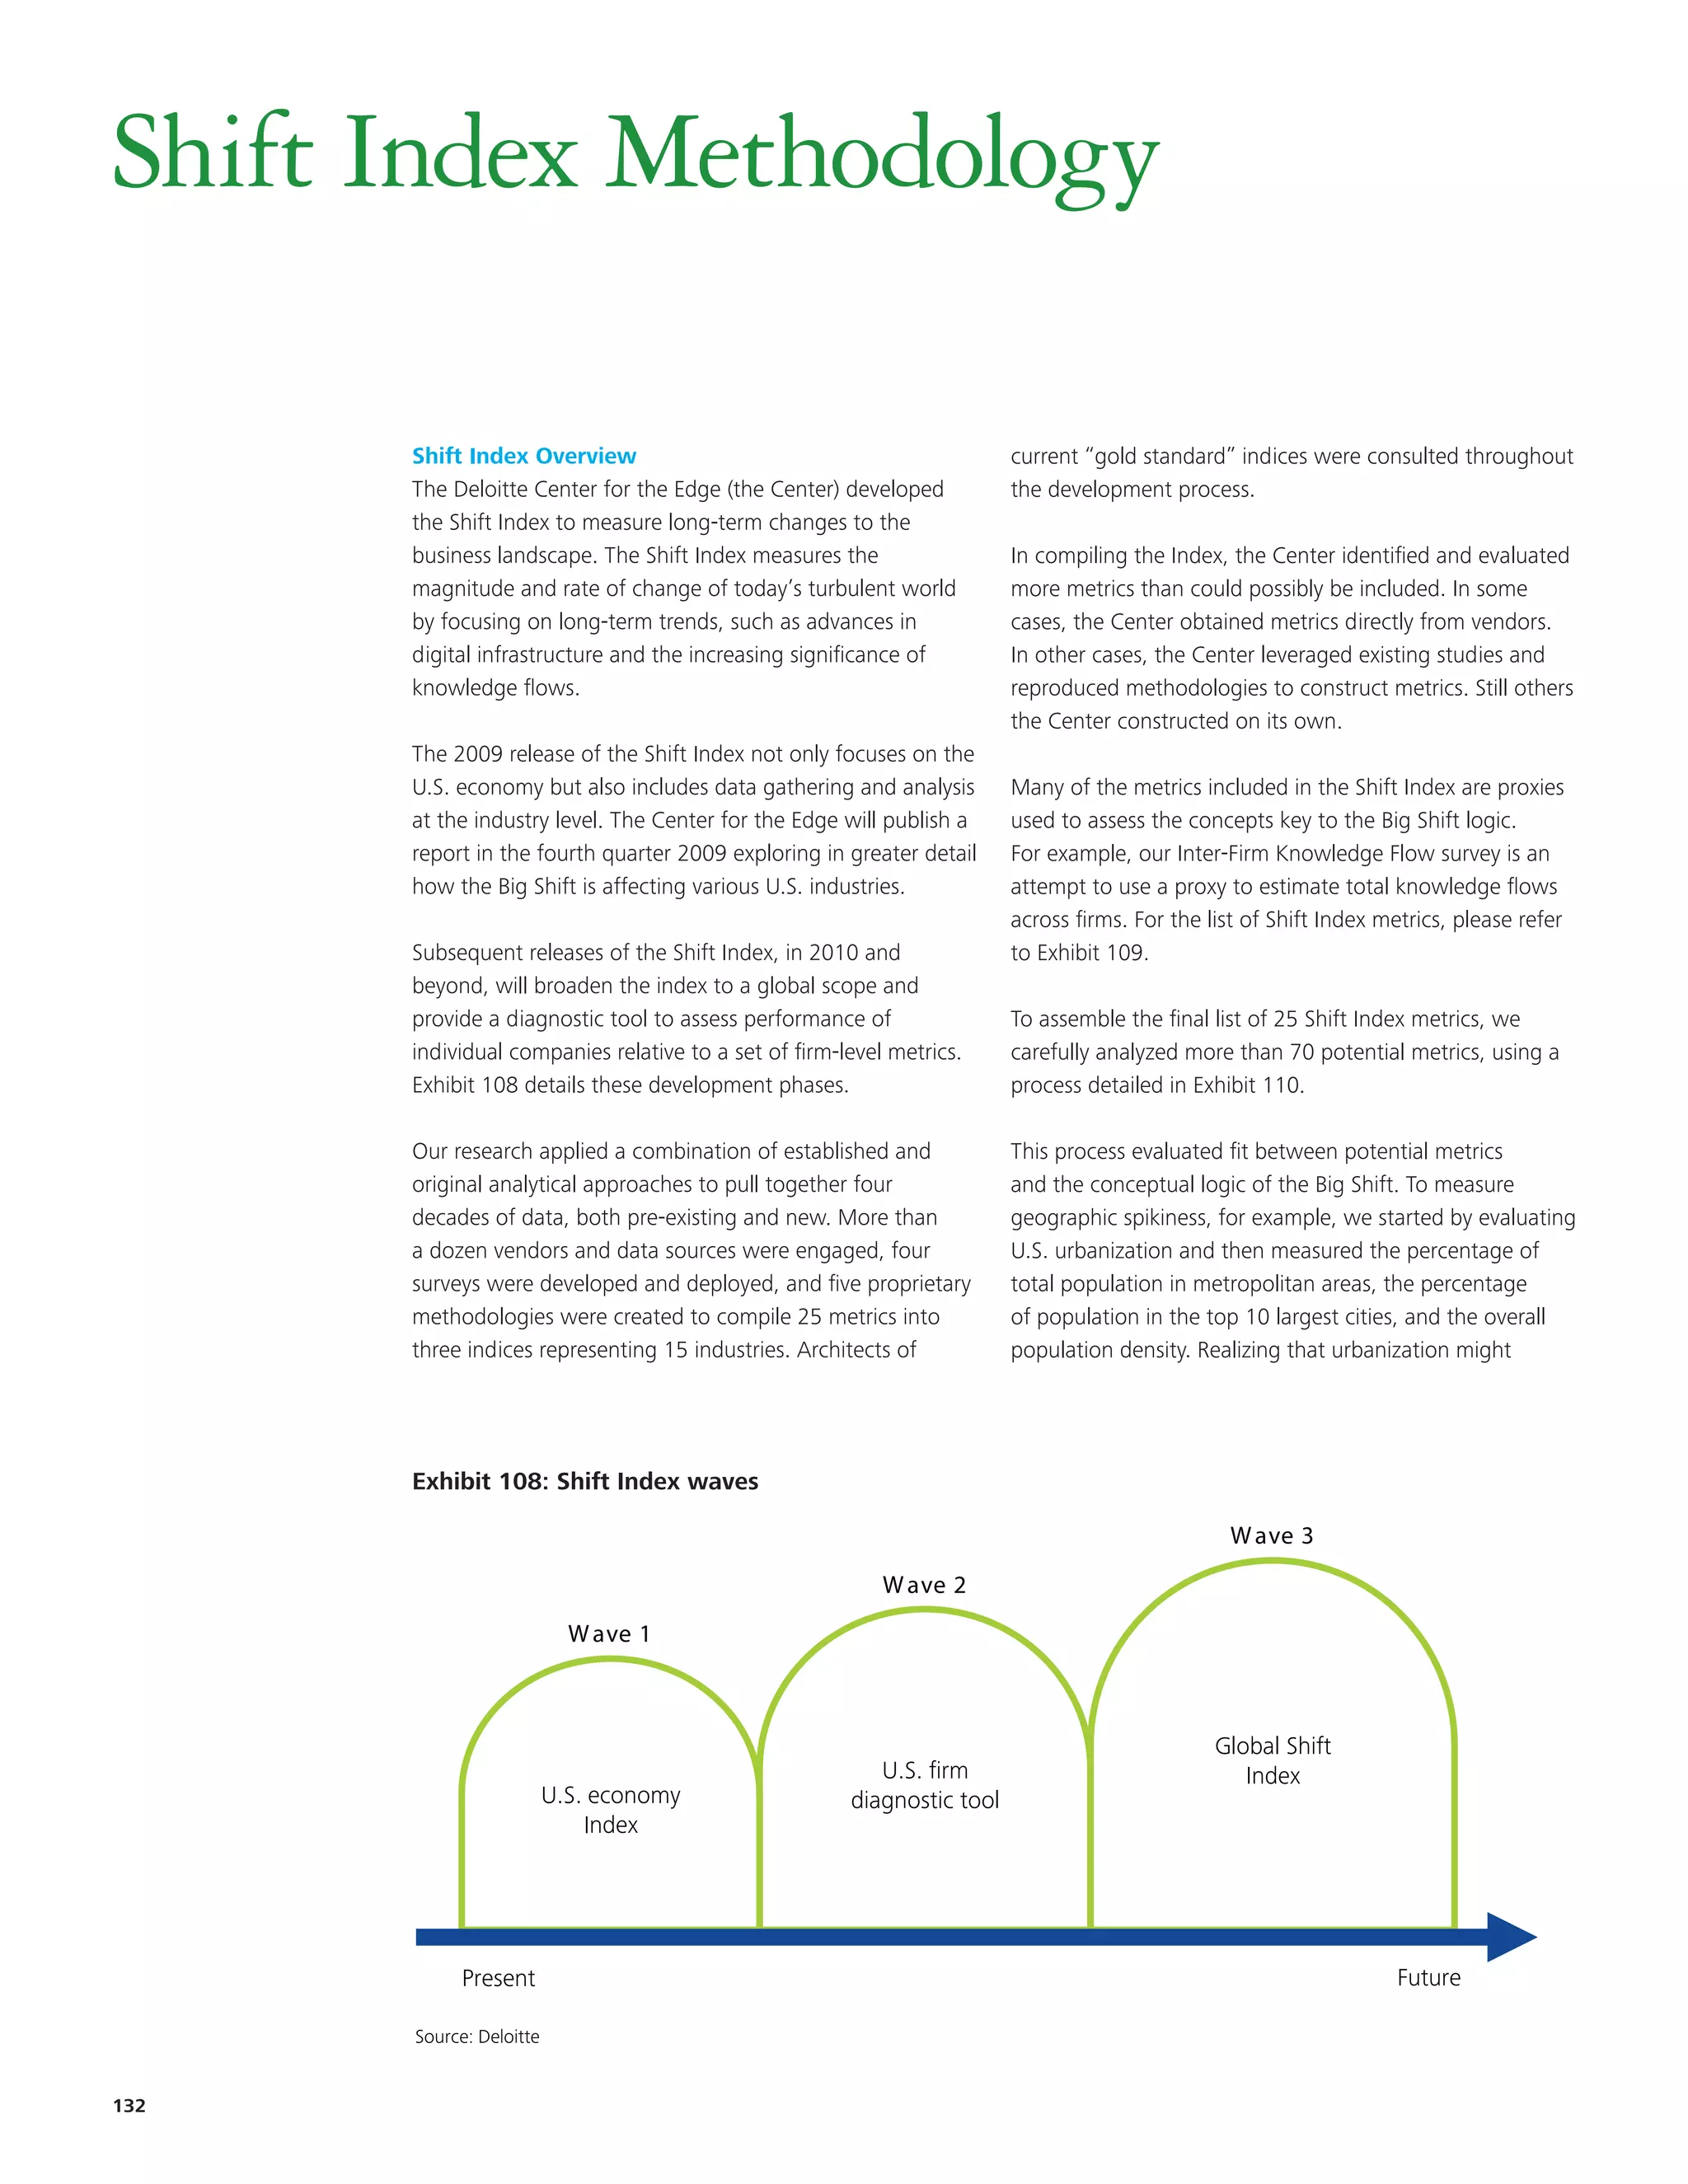
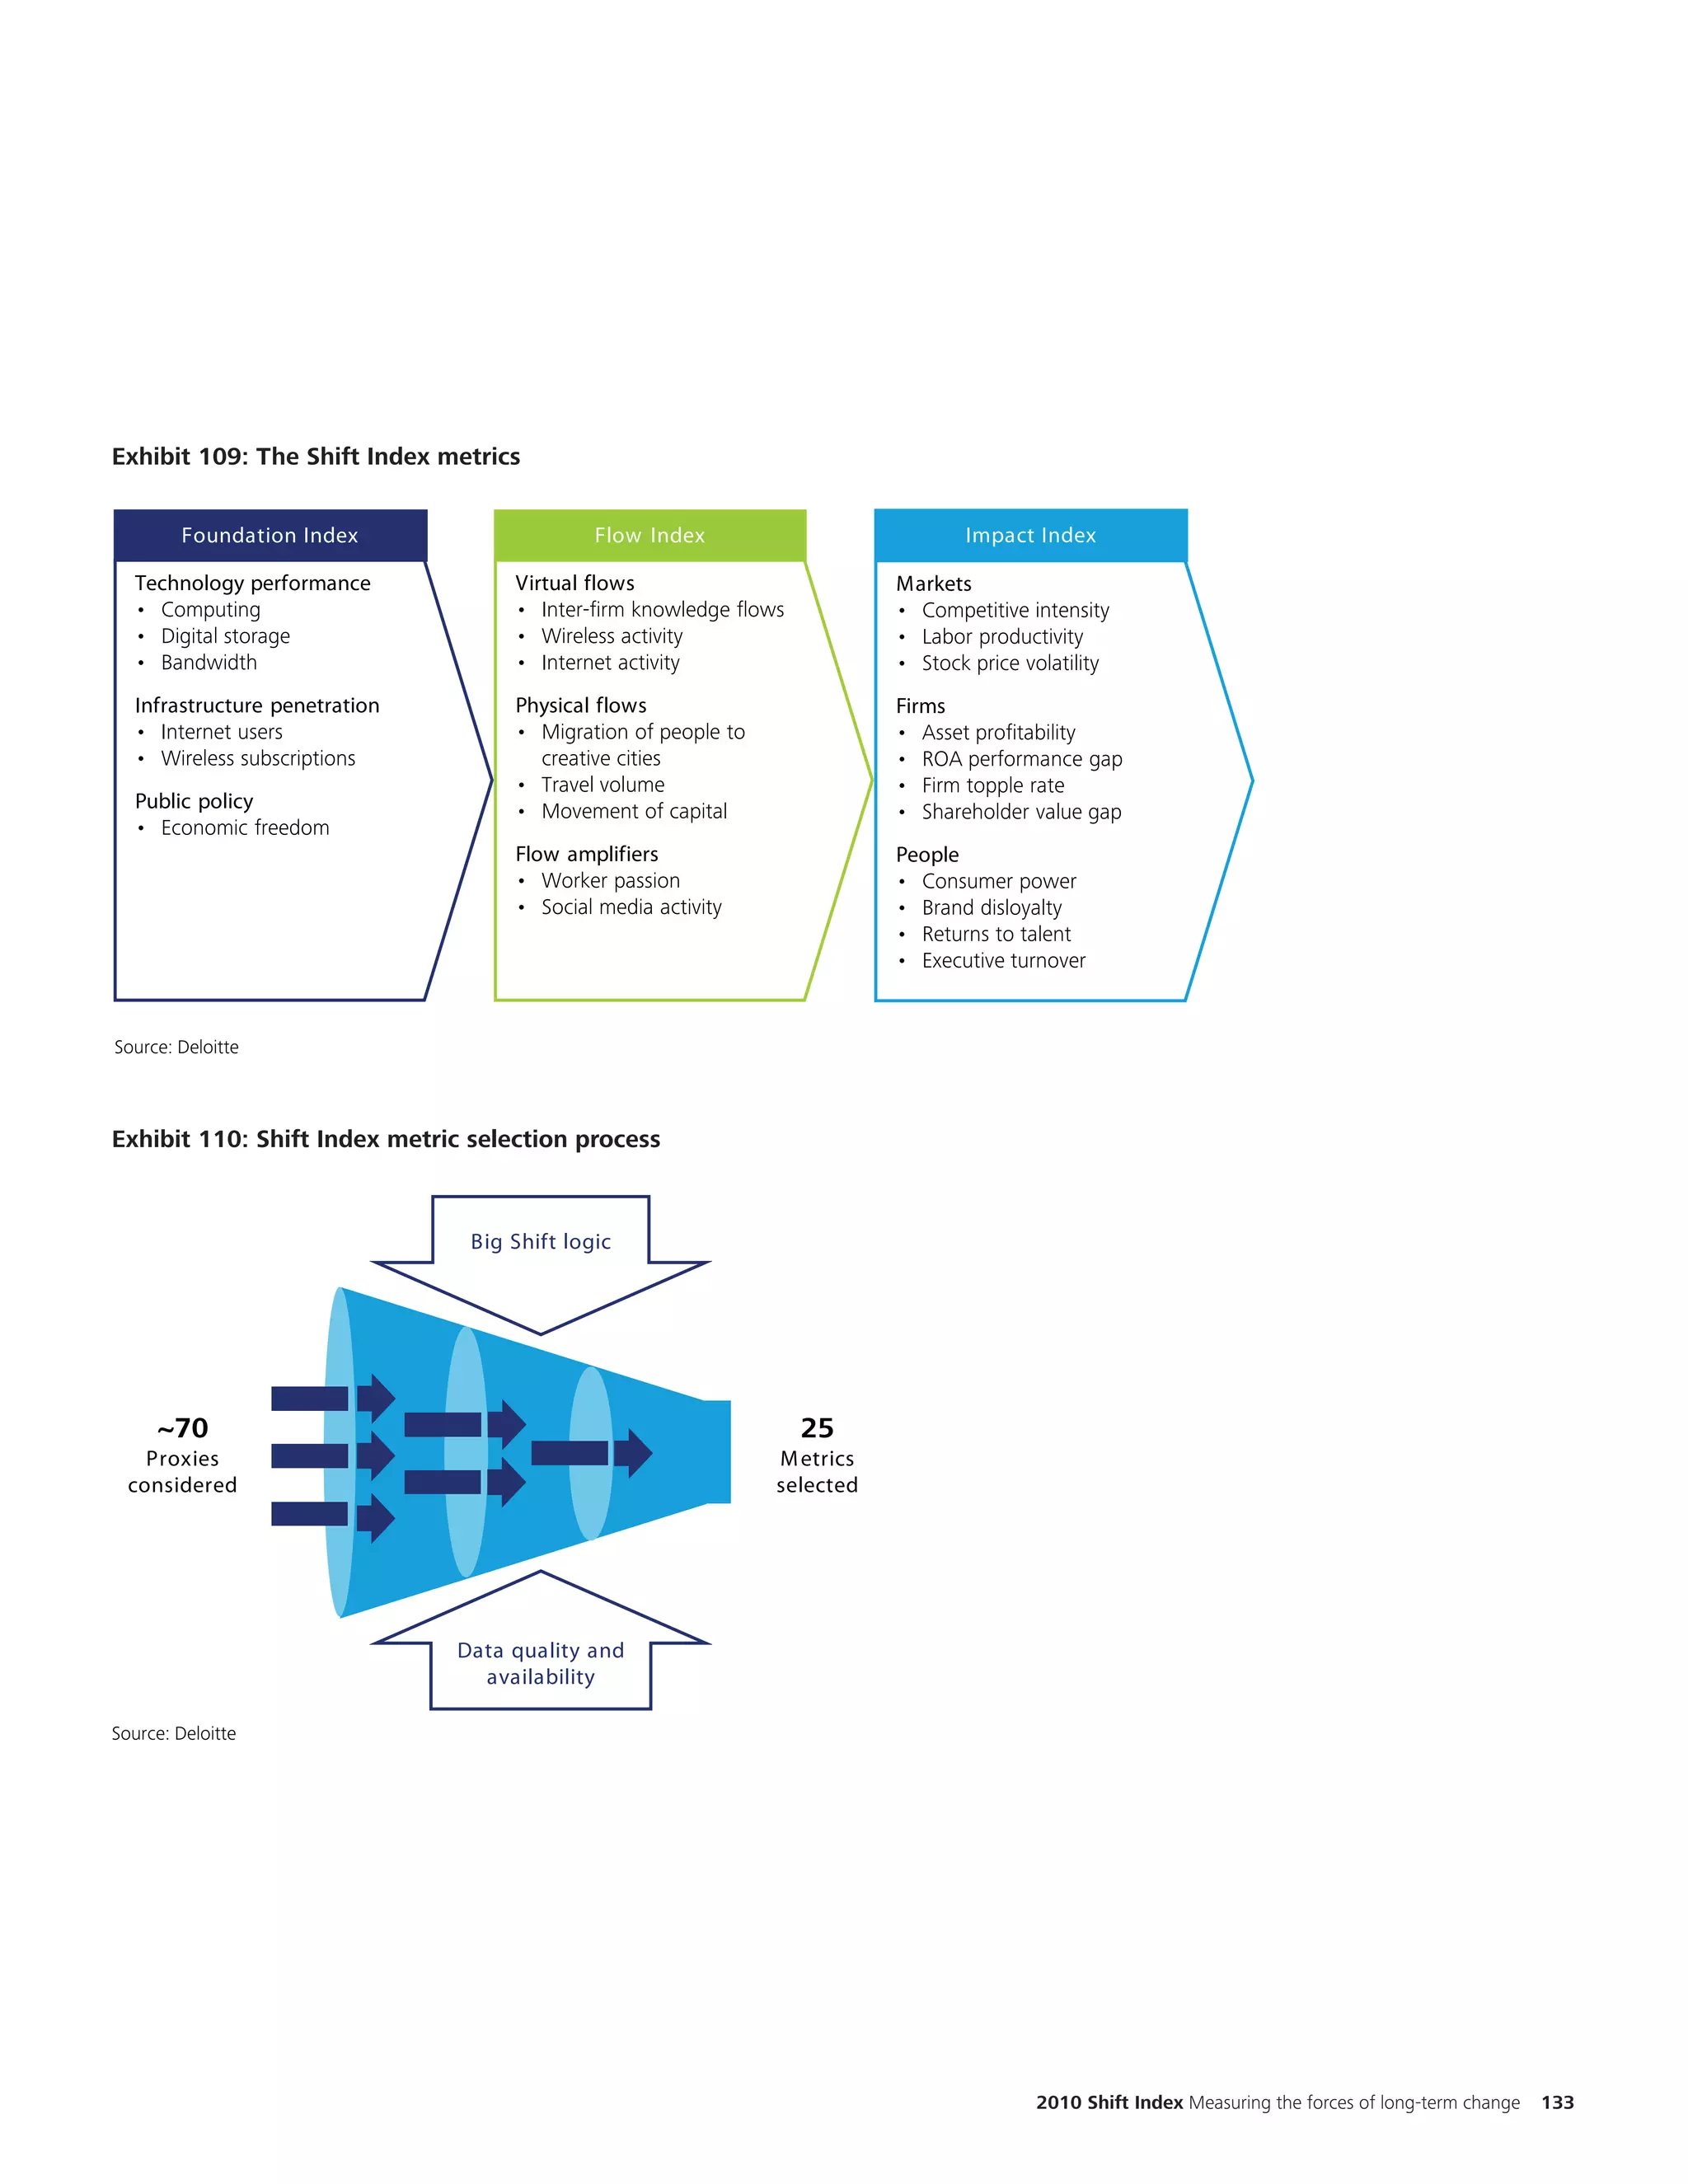


This document provides an overview and update of the Deloitte Center for the Edge's Shift Index, which measures long-term trends in business performance and the forces driving change. Key findings include: 1) Worker passion remains low and competitive intensity has more than doubled over the past 40 years, while returns on assets have declined significantly for most firms. 2) The economic downturn has influenced some trends in the short-term, slowing capital movement and decreasing competitive intensity, but long-term trends point to continued pressure on business performance. 3) The Shift Index tracks changes in the "foundations", "flows", and "impacts" of business - foundations capture changes enabling new opportunities, flows look at knowledge


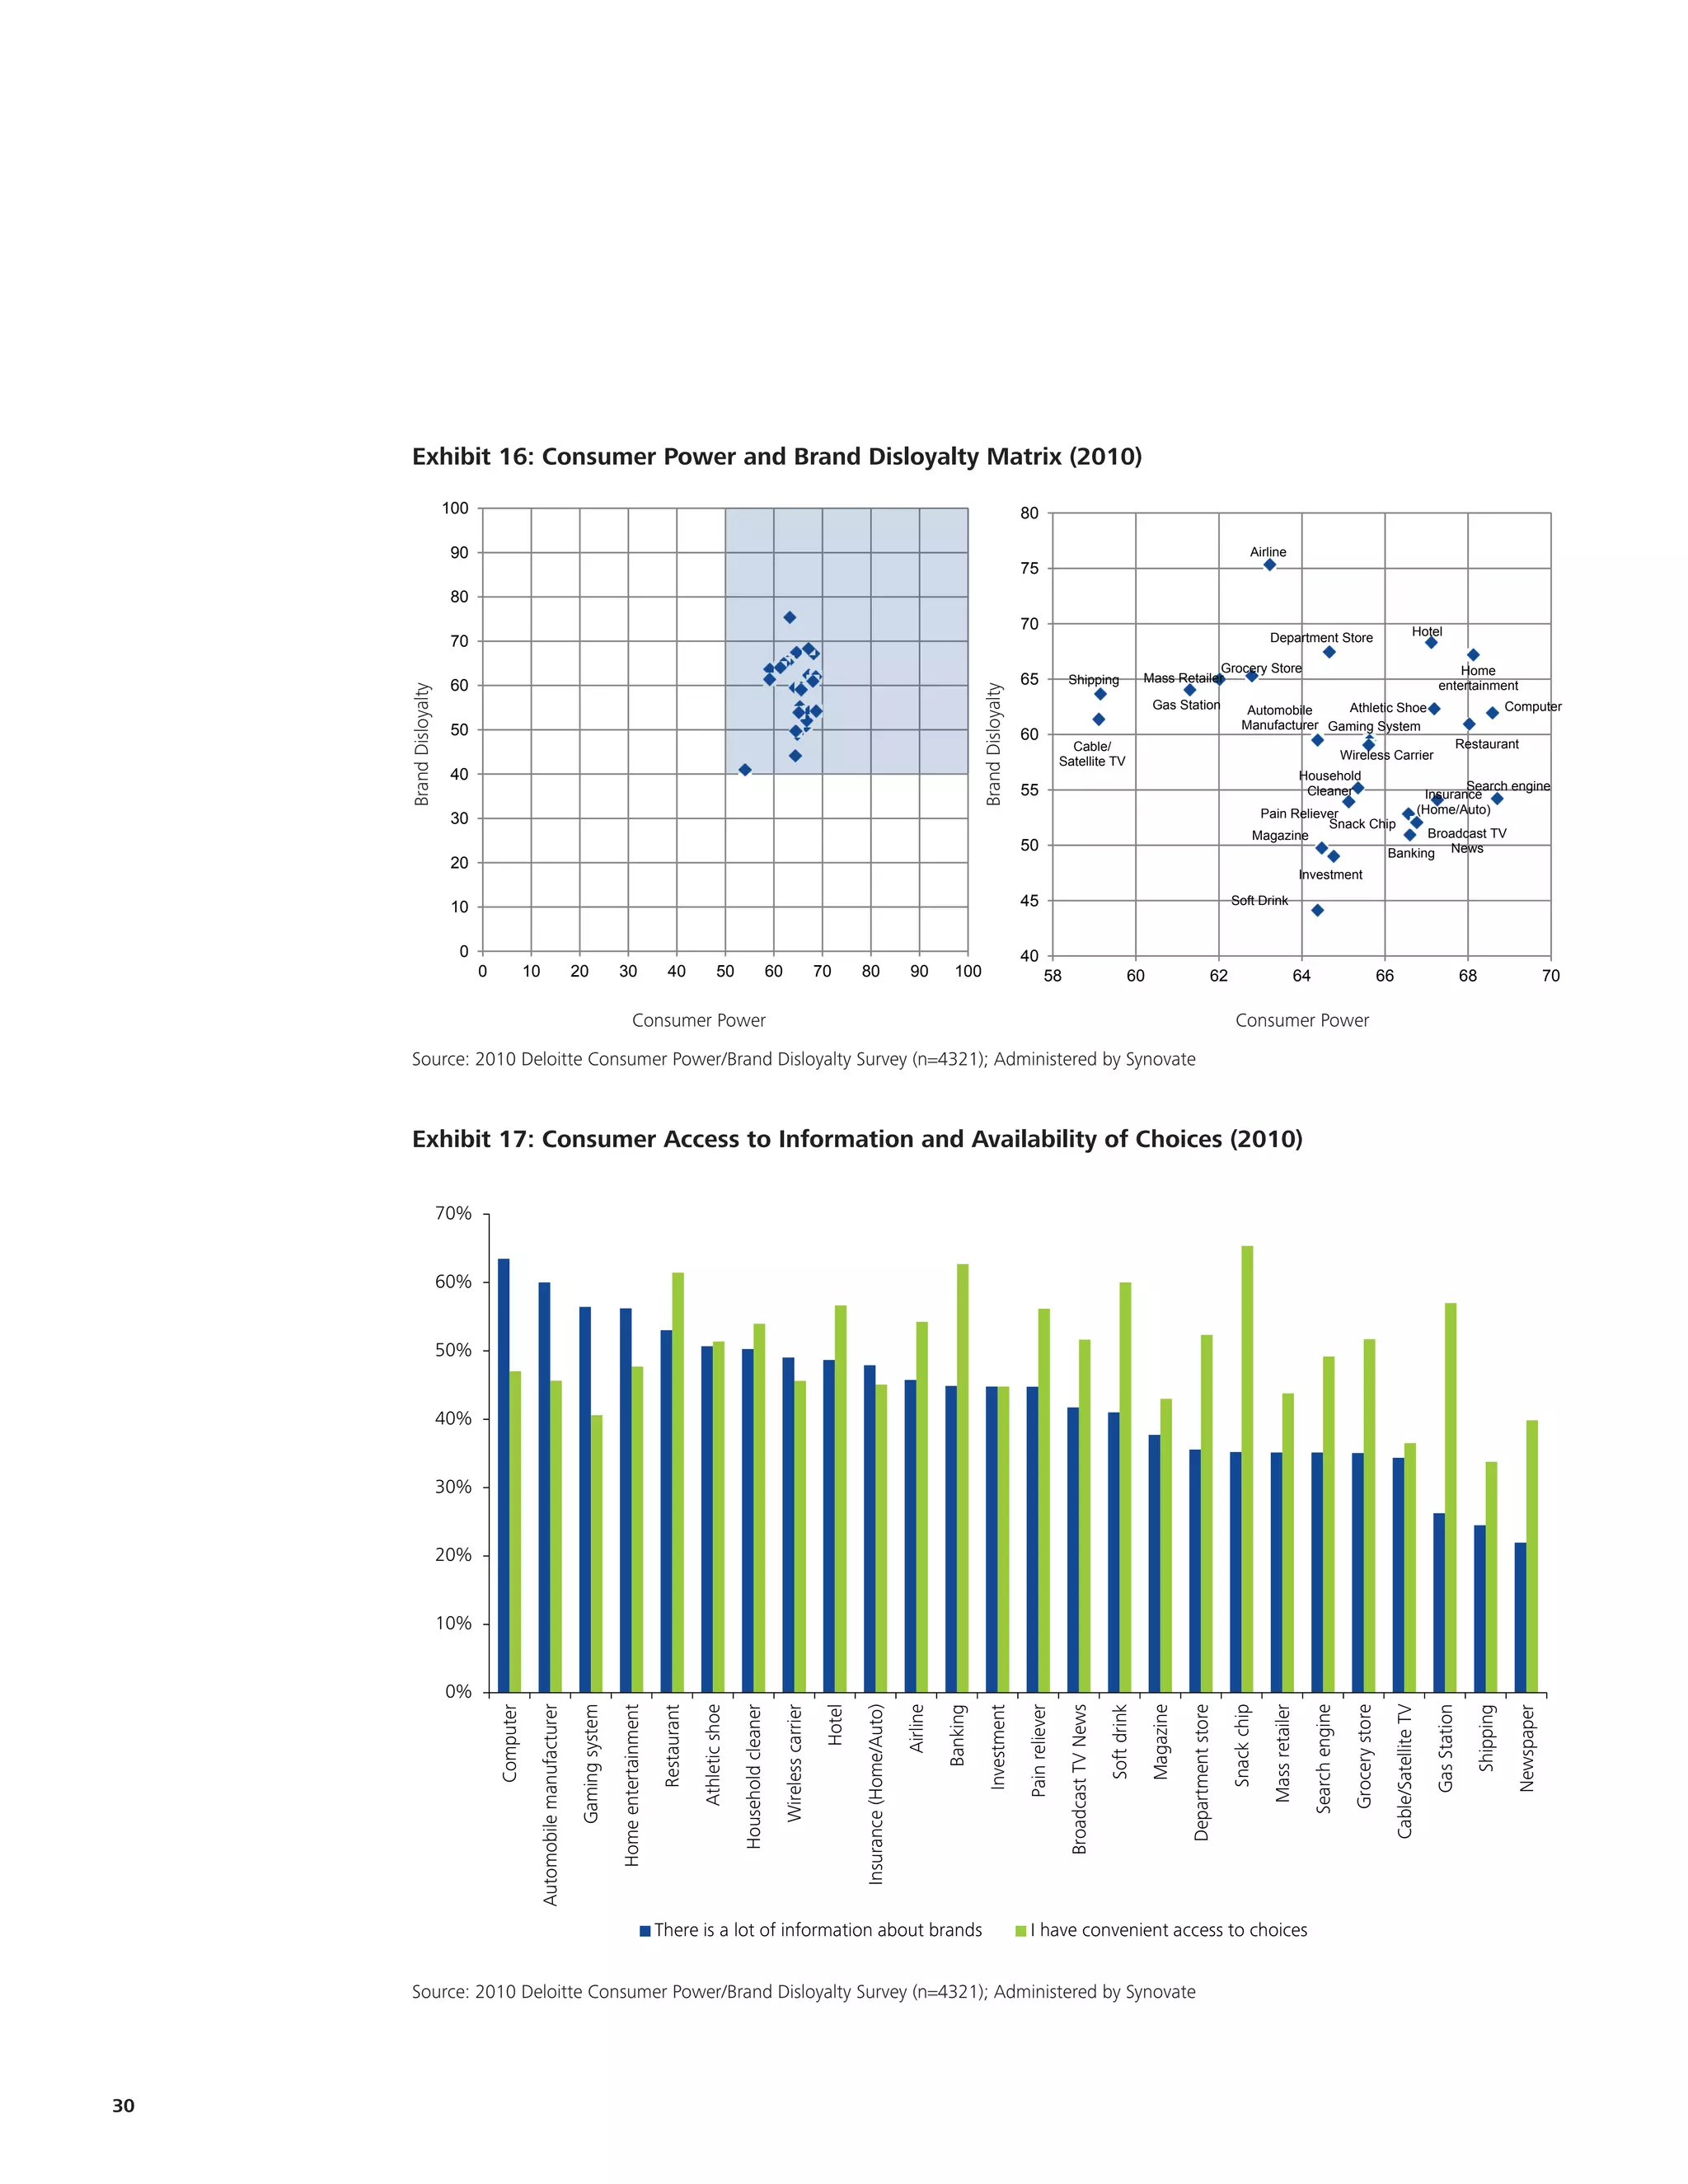
![Csac17[1].p](https://cdn.slidesharecdn.com/ss_thumbnails/csac171-p-110520053148-phpapp01-thumbnail.jpg?width=640&height=640&fit=bounds)


