1. KAWIN THONCOMPEERAVAS
BUS 502 FALL’09
Investor Newsletter
Gain from Our Perspective
Navigating Global Markets
Legend For simplicity, unless otherwise labeled,
these colors will represent their respective categories
in charts displayed for the entirety of this brochure.
The objective of this brochure is to
inform the typical investor about the
investment opportunities that lay in
international economies, and to alleviate
the reluctance to invest outside the borders
of the United States in the form of best
possible investment climate research on
growth, productivity, investment and
employment of the several investment
options.
Three categories of countries of
which future products may be offered to the
firm’s clients will be featured here: high-
income countries (HIC), middle-income
countries (MIC) and low-income countries
(LIC). Each category has different
implications for growth potential and risk
management that may not be suitable for
all investors.
Growth Opportunity Based on historical data, the
performance of these economies has improved
consistently over a period of thirty years. The GDP
value which best represents these economies has
grown over 88% from the year 1970 to the year
2000.
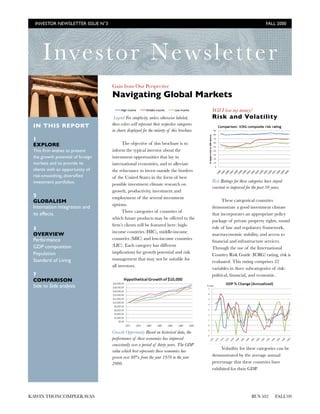
Will I lose my money?
Risk and Volatility
Risk Ratings for these categories have stayed
constant or improved for the past 30 years.
These categorical countries
demonstrate a good investment climate
that incorporates an appropriate policy
package of private property rights, sound
rule of law and regulatory framework,
macroeconomic stability, and access to
financial and infrastructure services.
Through the use of the International
Country Risk Guide (ICRG) rating, risk is
evaluated. This rating comprises 22
variables in three subcategories of risk:
political, financial, and economic.
Volatility for these categories can be
demonstrated by the average annual
percentage that these countries have
exhibited for their GDP.
IN THIS REPORT
1
EXPLORE
This firm wishes to present
the growth potential of foreign
markets and to provide its
clients with an opportunity of
risk-smoothing, diversified
investment portfolios.
2
GLOBALISM
Internation integration and
its effects.
3
OVERVIEW
Performance
GDP composition
Population
Standard of Living
7
COMPARISON
Side to Side analysis
INVESTOR NEWSLETTER ISSUE N°3
FALL 2000
2. KAWIN THONCOMPEERAVAS
BUS 502 FALL’09
Year to year changes in GDP is quite
normal and occurs in all economies. A
decline in GDP can mean a recession. If
you treat GDP as an index much like
Vanguard European Stock Index
(VEURX), they are much like the
fluctuation that occurs because it mirrors
the economy. National Indexes represent
the performance of the stock market of a
given nation. Much like trading stocks,
unless a major recession occurs or a
“market crash” it is unlikely that the
investor will lose ALL their money. From
past performance, and utilizing linear
regression, forecasts of GDP have been
predicted to go up for the next ten years.
Economics at work
Globalism
One of the key contributions of
economics has been its demonstration
that countries can mutually benefit from
trade. Trade can improve citizens’ welfare
by exchanging medicine for produce.
This simple yet powerful concept is
behind much of the trend toward
globalization. Reducing trade barriers
can facilitate growth and benefit the
overall economy by enabling a country to
use its resources more efficiently.
This translates to better living
standards. Lower death rates, longer life
expectancy, and higher literacy rates are
just a few examples of the effects of
globalism.
Effects of Globalism
Literacy Data for High Income countries are
unavailable.
GLOBALISM:
WHAT’S GOING ON?
Global indications such
as increased trade show that
there is growing integration of
economies and societies around
the world known as globalism.
These economies are in no way
closed and globalization has
helped reduce poverty in a large
number of developing countries.
With improvement to the
economy, living standards
increases but there are many
civic implications as well
especially in gender relations.
This often translates into higher
literacy levels, especially in
women.
Kawin Thoncompeeravas
INVESTOR NEWSLETTER ISSUE N°3
FALL 2000
3. KAWIN THONCOMPEERAVAS
BUS 502 FALL’09
Average Annual Returns The performance data shown represent past
performance, which is not a guarantee of future results. Investment returns and
principal value will fluctuate, so that investors' shares, when sold, may be
worth more or less than their original cost. Current performance may be
lower or higher than the performance data cited.
HIGH INCOME COUNTRIES
ECONOMIC SUMMARY
A type of this category would be USA and other nations of
Europe and the Pacific region.
Has high potential for growth, but also high risk; share value may
swing up and down more than U.S. stock funds.
RISK LEVEL
INVESTOR NEWSLETTER ISSUE N°3
FALL 2000
4. KAWIN THONCOMPEERAVAS
BUS 502 FALL’09
Average Annual Returns The performance data shown represent past
performance, which is not a guarantee of future results. Investment returns and
principal value will fluctuate, so that investors' shares, when sold, may be
worth more or less than their original cost. Current performance may be lower
or higher than the performance data cited.
MIDDLE INCOME COUNTRIES
ECONOMIC SUMMARY
An example of this category would be Brazil or Cuba.
Has high potential for growth, but also high risk; share value may
swing up and down more than U.S. stock funds.
RISK LEVEL
INVESTOR NEWSLETTER ISSUE N°3
FALL 2000
5. KAWIN THONCOMPEERAVAS
BUS 502 FALL’09
Average Annual Returns The performance data shown represent past
performance, which is not a guarantee of future results. Investment returns and
principal value will fluctuate, so that investors' shares, when sold, may be
worth more or less than their original cost. Current performance may be lower
or higher than the performance data cited.
LOWER INCOME COUNTRIES
ECONOMIC SUMMARY
An example of this category would be Madagascar or Ethiopia.
Has high potential for growth, but also high risk; share value may
swing up and down more than U.S. stock funds.
RISK LEVEL
INVESTOR NEWSLETTER ISSUE N°3
FALL 2000
6. KAWIN THONCOMPEERAVAS
BUS 502 FALL’09
Recent trends indicate that foreign investors tend to invest
more into High Income countries than the other categories.
Speculation leads us to suspect that Dot Com industries are
attracting these investors. Analysis of whether the valuation of
this high technology sector is inflated is still immature, but we do
deem it as a highly volatile and risky industry.
Domestic credit is more readily available in High Income
countries that the other categories.. This difference in domestic
credit availability will effect the ability for new businesses to start
up as well as existing industries to expand.
CATEGORY COMPARISON
INVESTOR NEWSLETTER ISSUE N°3
FALL 2000
Performance
Average annual returns—updated monthly as of 11/30/2009
1 Year 3 Year 5 Year 10 Year
Low Income 2.20% 1.20% 2.20% 2.60%
Middle Income 4.50% 2.30% 2.90% 2.00%
High Income 2.90% 2.30% 2.40% 1.90%
Sectoral Forecast (% of GDP)
High IncomeHigh IncomeHigh Income Middle IncomeMiddle IncomeMiddle Income Lower IncomeLower IncomeLower Income
Agriculture
Industry
Services
GDP per capita
1 Year 3 Year 5 Year 1 Year 3 Year 5 Year 1 Year 3 Year 5 Year
1.70 1.41 1.11 9.09 8.41 7.73 24.96 23.91 22.87
27.99 27.17 26.34 34.05 32.43 30.64 30.82 30.82 30.82
70.29 71.41 72.52 56.47 58.93 61.63 43.93 44.4 44.87
$ 29,632 $ 30,563 $ 31,494 $ 1,987 $ 2,038 $ 2,089 $ 469 $ 483 $ 497
Financial Comparison
7. KAWIN THONCOMPEERAVAS
BUS 502 FALL’09
CATEGORY COMPARISON
INVESTOR NEWSLETTER ISSUE N°3
FALL 2000
Across all categories birth and death rates are decreasing. HIC has the lowest birth and death rates, causing the population to grow
only about 27% over the last 30 years. Over the same period of time, MIC has grown 62.5% and LIC has grown 84.6%. Increases in the
proportion of the working age population can yield a "demographic dividend" that enhances the rate of economic growth.
In all cases the labor Force is expanding especially with skills that deals service. Agricultural and other unskilled labor has decreased
due to labor enhancing capital such as more automated machines. With reduction of Agriculture as percentage of the GDP, it can be said
that there is growing urbanization. Though the labor force is expanding, there is no shortage of work.The average unemployment rate for
HIC and MIC are 7.4% and 4.5% respectively and remain relatively constant. Access to current events and personal forms of
entertainment except for HIC are increasing at exponential rates. It is possible that HIC newspaper exhibits a downward trend due to the
increasing usage of the internet to access news channels. It is interesting that quality of life acting as a function of money follows a natural
logarithmic regression meaning it takes very little extra income to increase the standard of living.
8. Kawin Thoncompeeravas
California State Univerisity Channel Islands
1 University Drive, Camarillo, CA - (805) 437-8400
Dr. Paul Riviera
California State Univerisity
Channel Islands
1 University Drive,
Camarillo, CA
(805) 437-8400
Read at your own risk!
Important Legal Information
The information in the brochure is descriptive of the operations of the KT group as a whole and the services, securities and financial
instruments described may not be available to or suitable for you. Not all strategies are appropriate at all times. The opinions expressed in
the brochure do not constitute investment advice. Independent advice should be sought in cases of doubt.
Diversification and rebalancing do not assure a profit or protect against loss in declining markets.
Investing in securities involves risks, and there is always the potential of losing money when you invest in securities.
Past performance is no guarantee of future results.
THIS BROCHURE INCLUDES FACTS, VIEWS, OPINIONS AND RECOMMENDATIONS OF INDIVIDUALS AND
ORGANIZATIONS DEEMED OF INTEREST. KT INC. AND ITS CONTENT LICENSORS DO NOT WARRANT THE
ACCURACY, COMPLETENESS OR TIMELINESS, MERCHANTABILITY, NON-INFRINGEMENT OR FITNESS FOR A
PARTICULAR PURPOSE OF, OR OTHERWISE ENDORSE, THESE VIEWS, OPINIONS OR RECOMMENDATIONS. IN NO
EVENT WILL KT INC., BE LIABLE TO YOU OR ANYONE ELSE FOR ANY DECISION MADE OR ACTION TAKEN BY YOU
IN RELIANCE ON SUCH CONTENT OR THIS BROCHURE. KT INC. SHALL NOT BE LIABLE TO YOU OR ANYONE ELSE
FOR ANY DAMAGES OTHER THAN DIRECT DAMAGES (INCLUDING, WITHOUT LIMITATION, CONSEQUENTIAL,
INVESTOR NEWSLETTER ISSUE N°3
FALL 2008INVESTOR NEWSLETTER ISSUE N°3
FALL 2000