More Related Content Similar to Southern chemicals with changes Similar to Southern chemicals with changes (20) More from Kinshook Chaturvedi More from Kinshook Chaturvedi (20) 1. 0 1 2 3 4 5
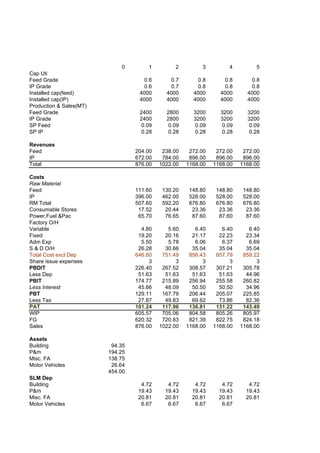
Cap Uti
Feed Grade 0.6 0.7 0.8 0.8 0.8
IP Grade 0.6 0.7 0.8 0.8 0.8
Installed cap(feed) 4000 4000 4000 4000 4000
Installed cap(IP) 4000 4000 4000 4000 4000
Production & Sales(MT)
Feed Grade 2400 2800 3200 3200 3200
IP Grade 2400 2800 3200 3200 3200
SP Feed 0.09 0.09 0.09 0.09 0.09
SP IP 0.28 0.28 0.28 0.28 0.28
Revenues
Feed 204.00 238.00 272.00 272.00 272.00
IP 672.00 784.00 896.00 896.00 896.00
Total 876.00 1022.00 1168.00 1168.00 1168.00
Costs
Raw Material
Feed 111.60 130.20 148.80 148.80 148.80
IP 396.00 462.00 528.00 528.00 528.00
RM Total 507.60 592.20 676.80 676.80 676.80
Consumable Stores 17.52 20.44 23.36 23.36 23.36
Power,Fuel &Pac 65.70 76.65 87.60 87.60 87.60
Factory O/H
Variable 4.80 5.60 6.40 6.40 6.40
Fixed 19.20 20.16 21.17 22.23 23.34
Adm Exp 5.50 5.78 6.06 6.37 6.69
S & D O/H 26.28 30.66 35.04 35.04 35.04
Total Cost excl Dep 646.60 751.49 856.43 857.79 859.22
Share issue expenses 3 3 3 3 3
PBDIT 226.40 267.52 308.57 307.21 305.78
Less Dep 51.63 51.63 51.63 51.63 44.96
PBIT 174.77 215.89 256.94 255.58 260.82
Less Interest 45.66 48.09 50.50 50.50 34.96
PBT 129.11 167.79 206.44 205.07 225.85
Less Tax 27.87 49.83 69.62 73.86 82.36
PAT 101.24 117.96 136.81 131.22 143.49
WIP 605.57 705.06 804.58 805.26 805.97
FG 620.32 720.83 821.39 822.75 824.18
Sales 876.00 1022.00 1168.00 1168.00 1168.00
Assets
Building 94.35
P&m 194.25
Misc. FA 138.75
Motor Vehicles 26.64
454.00
SLM Dep
Building 4.72 4.72 4.72 4.72 4.72
P&m 19.43 19.43 19.43 19.43 19.43
Misc. FA 20.81 20.81 20.81 20.81 20.81
Motor Vehicles 6.67 6.67 6.67 6.67
2. DEP CL 51.63 51.63 51.63 51.63 44.96
WDV DEP
Building 80.20 68.17 57.94 49.25 41.86
P&m 145.69 109.27 81.95 61.46 46.10
Misc. FA 111.00 88.80 71.04 56.83 45.47
Motor Vehicles 15.98 9.59 5.75 3.45 2.07
Dep(WDV)
Building 14.15 12.03 10.23 8.69 7.39
P&m 48.56 36.42 27.32 20.49 15.37
Misc. FA 27.75 22.20 17.76 14.21 11.37
Motor Vehicles 10.66 6.39 3.84 2.30 1.38
Total Dep(IT) 101.12 77.05 59.14 45.69 35.50
15.00%
0 1 2 3 4 5
PAT 101.24 117.96 136.81 131.22 143.49
+DEP 51.63 51.63 51.63 51.63 44.96
Operating CF 152.87 169.59 188.44 182.85 188.45
Terminal Cf -572.00 101.26
Repayment ofLoan -111.00 -111.00
Recovery of WC Margin 103.70
Total CF -572.00 152.87 169.59 188.44 71.85 282.41
PVF 1.000 0.870 0.756 0.658 0.572 0.497
PV -572.00 132.93 128.24 123.90 41.08 140.41
16.55%
0 1 2 3 4 5
PAT 101.24 117.96 136.81 131.22 143.49
+DEP 51.63 51.63 51.63 51.63 44.96
Operating CF 152.87 169.59 188.44 182.85 188.45
Repayment of term loan 0.00 0.00 0.00 -111.00 -111.00
Terminal Cf -572.00 101.26
Recovery of WC Margin 103.70
Total CF -572.00 152.87 169.59 188.44 71.85 282.41
PVF 1.000 0.858 0.736 0.632 0.542 0.465
PV -572.00 131.17 124.85 119.03 38.94 131.32
Sales 876.00 1022.00 1168.00 1168.00 1168.00
VC 621.90 725.55 829.20 829.20 829.20
Contribution 254.10 296.45 338.80 338.80 338.80
P/V Ratio 0.29 0.29 0.29 0.29 0.29
FC 24.70 25.94 27.23 28.59 30.02
CBEP 85.15 89.41 93.88 98.57 103.50
Sales 876.00 1022.00 1168.00 1168.00 1168.00
VC 621.90 725.55 829.20 829.20 829.20
Contribution 254.10 296.45 338.80 338.80 338.80
P/V Ratio 0.29 0.29 0.29 0.29 0.29
FC 76.33 77.57 78.86 80.22 74.98
BEP 263.14 267.40 271.87 276.57 258.50
DOL 1.45 1.37 1.32 1.33 1.30
DFL 1.35 1.29 1.24 1.25 1.15
DCL 1.97 1.77 1.64 1.65 1.50
3. BALANCE SHEET
Sources of Funds
Equity Shares 350.00 350.00 350.00 350.00 350.00 350.00
R&S 101.24 219.21 356.02 487.24 630.73
Term Loans 222.00 222.00 222.00 222.00 111.00 0.00
WC Loan 116.66 136.08 155.38 155.38 155.38
Total 572.00 789.90 927.29 1083.39 1103.62 1136.11
Application of Funds
Land 25.00 25.00 25.00 25.00 25.00 25.00
Gross Block 454.00 454.00 402.37 350.74 299.11 247.48
Less Depreciation 51.63 51.63 51.63 51.63 44.96
Net Block 454.00 402.37 350.74 299.11 247.48 101.26
Current Assets(non-cash) 194.66 226.81 258.96 259.10 259.25
Cash 78.00 152.87 309.74 485.32 557.03 735.60
Share Issue Expenses w/o 15.00 15.00 15.00 15.00 15.00 15.00
TOTAL 572.00 789.90 927.29 1083.39 1103.62 1136.11
Cash Account
Inflows
Opening Bal 78.00 78.00 152.87 309.74 485.32 557.03
Bank Borrowing Incremental 116.66 19.43 19.29 0.00 0.00
Sale of assets 101.26
Cash profits 152.87 169.59 188.44 182.85 188.45
Total 0.00 347.53 341.89 207.73 182.85 289.71
Outflows
Repayment of TL 111.00 111.00
Investmment in WC 194.66 32.15 32.15 0.14 0.15
Total 0.00 194.66 32.15 32.15 111.14 111.15
Closing Balance 78.00 152.87 309.74 485.32 557.03 735.60
Profit & Loss Account 101.24 117.96 136.81 131.22 143.49
Diff 0.00 0.00 0.00 0.00 0.00 0.00
4. Preop Cont.
85 5.2 4.16
175 10.7 8.56
125 7.64 6.11
24 1.47 1.17
409 25 20
5. 251.48
202.52 101.26
-5.44
Rate NPV
11 56.08
12 39.73
13 24.05
14 9.01
14.62 0
-26.71 15 -5.44
16 -19.31
16.55 -26.71
7. PBDIT 226.40 267.52 308.57 307.21 305.78
DEP 101.12 77.05 59.14 45.69 35.50
PBIT 125.28 190.47 249.43 261.52 270.28
Int. 45.66 48.09 50.50 50.50 34.96
PBT 79.61 142.38 198.93 211.01 235.31
Tax@35% 27.87 49.83 69.62 73.86 82.36
Term Loan
Op. Principal 222 222 222 222 111
Interest 31.08 31.08 31.08 31.08 15.54
Repayment 0 0 0 111 111
Cl Principal 222 222 222 111 0
Working Capital
RM 1.00 42.30 49.35 56.40 56.40 56.40
Utilities 0.50 3.47 4.05 4.62 4.62 4.62
WIP 0.50 25.23 29.38 33.52 33.55 33.58
FG 0.98 50.66 58.87 67.08 67.19 67.31
Debtors 1.00 73.00 85.17 97.33 97.33 97.33
Total 194.66 226.81 258.96 259.10 259.25
Bank Borrowing 116.66 136.08 155.38 155.38 155.38
Own Financing 78.00 90.72 103.58 103.72 103.87
Incremental Fin 12.72 12.86 0.14 0.15
Interest on WC 14.58 17.01 19.42 19.42 19.42
Interest on TL 31.08 31.08 31.08 31.08 15.54
Total Interest 45.66 48.09 50.50 50.50 34.96
inCremental bank borrowng 116.66 19.43 19.29 0.00 0.00
9. IRR Calculations
80
60
56.08
40 39.73
24.05
20
NPV
9.01
0 0
-5.44
-20 -19.31
-26.71
-40
11 12 13 14 14.62 15 16 16.55
Cost of Capital
10. Source of Amt Tax
Financing (in Lakhs) Weightage Float Rate Interest Cost
Equity 350 0.61 0.06 21.28 13.02
Debt 222 0.39 0 35% 9.10 3.53
Total 572 WACC 16.55
11. Year 1 Year 2 Year 3 Year 4
Operating CF 152.9 169.6 188.4 182.8
Cummulative Cash Flows 152.9 322.5 510.9 693.8
61.1
0.3
Payback Period in Years 3.3