SlideShare a Scribd company logo
1 of 60
Download to read offline
Notes
Economic Survey
Vol. 1
2017-18
Prepared by
Mr. Krishan
PhD Scholar
Centre for Development Studies
1
Chapter 1
Overview of Indian Economy
1. GIST
1. Major reforms were undertaken during the last few years.
2. GST – One nation one Tax – 1st
July 2017
3. Twin Balance Sheet (TBS) problem, Assets Reconstruction Companies (ARC) were
formed, and Insolvency and Bankruptcy Code (IBC) were implement in 2016.
4. Bank recapitalization package was announced – 1.2% of GDP.
5. These reforms will likely to spiral India’s growth trajectory.
6. Expected growth rate 2017-18 = 6.75%.
7. Expected growth Rate 2018-19 = 7-7.5%.
8. However, need to be vigilant about rising oil prices & sudden capital flows.
9. Short term agenda: stabilize GST, complete the resolution on TBS – pass & implement
FRDI, private Air India, reduce macroeconomic instability – fiscal correction.
10. Medium term agenda: Employment: youth & women, Education: educated & healthy
workforce, and Agriculture: rising farm productivity.
11. However, India must improve climate for sustained economic growth through private
investment and exports.
2. Short term: Overview
1. In the first half of current fiscal (2017-18), Indian economy suffered from temporarily
“de-coupled” – decelerating as the rest of world accelerated – although it remained second
fastest growing economy.
2. The reasons for this decoupling are series of actions & development that buffeted the
economy: GST, demonetization, high & rising real interest rate, TBS challenge, and sharp
falls in certain food prices that impacted agricultural prices.
3. However, in the second half of the year, the economy witnessed robust signs of revival.
Economic growth improved as shocks began to fade.
4. India’s historic macroeconomic vulnerabilities – Fiscal deficit, CAD and inflation were all
higher than expected, albeit not threateningly so.
5. Over the coming years, the government will need to focus on 4 R’s (Recognition, Resolution,
Recapitalization & Reform) ensuring that the process of resolving the major indebted cases
carried to a successful conclusion.
6. The government need to stabilize the GST in its implementation, treatment of exporter,
facilitate easier compliance, and expand the tax base.
7. Privatization of Air India.
8. If these objective are achieved, the world economy maintains its growth momentum, and oil
prices do not persist at current levels, the Indian economy should resume converging towards
its medium-term growth potential which is around 8%.
2
3. Medium term: Overview
1. India has created one of the most effective institutional mechanism for cooperative
federalism, the GST council. This “cooperative federalism technology” can be further used to
create common agriculture markets, integrate fragmented and efficient electricity markets,
solve inter-state water disputes, implemented direct benefit transfer (DBT) and combating air
pollution.
2. “Exit” problem of corporate sector has been partly addressed by the introduction of
Insolvency and Bankruptcy Code (IBC) in 2016. The recently proposed Financial Resolution
and Deposit Insurance (FRDI) bill would do the same for financial sector.
3. Subsidies need to rationalize – through DBT mechanism. Data suggested that household
access to basic services (Toilets, power & Housing), financial inclusion – basic bank
accounts has shown progress. The strength of these provisioning should be reflected in
greater use these services.
4. Historical macroeconomic vulnerabilities – Fiscal and Current A/C deficit – both of which
tend to increase when oil prices rises.
a. Overcoming the fiscal vulnerability require breaking the inertia of the Tax-GDP ratio.
India’s Tax-GDP ratio is no higher than it was in 1980s, despite average economic
growth of 6.5%. The introduction of GST will likely to break this inertia.
b. Fiscal vulnerability also require halting the steady conversion of contingent1
liabilities
into actual ones (typically through the assumption of state discom debts and public
sector bank recapitalization), which has impeded progress of debt reduction even in
the face of solid growth & apparently favorable debt dynamics.
c. Addressing CAD vulnerability requires raising the trajectory of export growth.
Reviving the manufacturing and making sector internationally competitive has been
the goal of “Make in India” in program, unpinned by a strategy of reducing the cost
of doing business. However, the international competitiveness of manufacturing has
not made great strides, reflected in the declining manufacturing export-GDP ratio and
manufacturing trade balance.
5. Need to have broader policy on corruption, which minimize moral hazard and rent seeking
(Corruption in coal, land and environment permits, voluntary default of debt by individuals).
6. Domain of operations of market vs state and private capital vs public institutions should be
clearly defined.
Unfinished agenda: addressing inefficient redistribution; accelerating the limited progress in
delivery of public services especially health & education; and correcting the ambivalence toward
property rights, the private sector, and price incentive.
1
Contingent Liabilities of the Government are like insurance obligations, which are contingent
or conditional upon the occurrence of certain events, requiring payments by the Government,
who had promised or agreed in the past to make good such liabilities, regardless of its financial
health. It is a possible obligation and not a present obligation. It arises from some past events and
its existence will be confirmed only by the occurrence of some future events. Its time of payment
or the quantum of payment or both are uncertain.
1
Chapter 2
India Economy through GST
2.1 Brief overview of GST in India
# GST is one indirect tax for whole nation, which makes India one unified fiscal market.
GST is a single tax on the supply of goods and services, right from the manufacturer to the
consumer. Credits of input taxes paid at each stage will be available in the subsequent stage of
value addition, which makes GST essentially a tax only on value addition at each stage. The final
consumer will thus bear only the GST charged by the last dealer in the supply chain, with set-off
benefits at all the previous stages.
## Salient feature of GST
1. SS based tax as against the current system of mfg. based tax.
2. Destination based consumption tax: Tax would accrue to the State or the Union Territory
where the consumption takes place. It would be a dual GST with the Centre and States
simultaneously levying tax on a common tax base. The GST to be levied by the Centre on
intra-State supply of goods or services would be called the Central tax (CGST) and that to be
levied by the States including Union territories with legislature/Union Territories without
legislature would be called the State tax (SGST)/ Union territory tax (UTGST) respectively.
3. The GST would apply to all goods other than alcoholic liquor for human consumption and five
petroleum products, viz. petroleum crude, motor spirit (petrol), high speed diesel, natural gas
and aviation turbine fuel. It would apply to all services barring a few to be specified.
4. An Integrated tax (IGST) would be levied and collected by the Centre on inter-State supply of
goods and services. Accounts would be settled periodically between the Centre and the States
to ensure that the SGST/UTGST portion of IGST is transferred to the destination State where
the goods or services are eventually consumed.
5. Exports and supplies to SEZ shall be treated as zero-rated supplies. The exporter shall have an
option to either pay output tax and claim its refund or export under bond without tax and claim
refund of Input Tax Credit.
6. Import of goods and services would be treated as inter-State supplies and would be subject to
IGST in addition to the applicable customs duties. The IGST paid shall be available as ITC for
further transactions.
### Benefits of GST
Commented [S1]: Definition: Indirect tax is a type of tax
where the incidence and impact of taxation does not fall on
the same entity.
Description: In the case of indirect tax, the burden of tax
can be shifted by the taxpayer to someone else. Indirect tax
has the effect to raising the price of the products on which
they are imposed. Customs duty, central excise, service tax
and value added tax are examples of indirect tax.
Commented [S2]: GST is based on Value added principle,
i.e. tax on value addition.
Commented [S3]: A tax base is a total amount of assets
or income that can be taxed by a taxing authority, usually by
the government
2
Business and industry
Easy compliance: robust
IT system which makes
registration, returns, and
claims on input tax credit
easy and transparent.
Uniformity in tax rate and
structure: it effect ease of
doing business positively
=> by making investment
tax neutral irrespective of
choice of place.
Removal of cascading
effect: by providing input
tax credit on subsequent
stages of production, GST
eliminates the cascading
effect of taxation.
Improved competition: Due
to easy compliance =>
transaction cost will reduce
=> effect trade and
industry.
Gain to manufacturer and
exporters: subsuming of
various taxes on single tax
=> leads to reduction in
prices which in turn
provide competitive edge
to manufacturers in both
the national and
international market.
Governments
Easy to administered:
subsuming of all indirect
tax into GST combined
with robust IT technology
makes GST simple and
easy to administered at
both center and state level.
Better control on leakages:
Input tax credit combined
with robust IT
infrastructure =>
incentivize tax compliance
by traders.
Higher revenue efficiency:
cost of tax collection will
likely to reduce by GST.
Consumers
Single and transparent tax
proportionate to the value
of goods and services.
Relief in overall tax
burden: Because of
efficiency gains and
prevention of leakages, the
overall tax burden on most
commodities will come
down, which will benefit
consumers.
Commented [S4]: Cascading effect: A tax on tax.
Commented [S5]: Revenue efficiency of tax: cost of tax
collection/ tax revenue.
3
###Why is GST so important?
The biggest tax reform since independence - GST - will pave the way for realization of the goal of
One Nation - One Tax - One Market.
GST will benefit all the stakeholders namely industry, government and consumer. It will lower the
cost of goods and services, give a boost to the economy and make the products and services
globally competitive, giving a major boost to ‘Make in India’ initiative.
Under the GST regime, exports will be zero-rated in entirety unlike the present system where
refund of some of the taxes does not take place due to fragmented nature of indirect taxes between
the Centre and the States. GST will make India a common market with common tax rates &
procedures and remove economic barriers.
GST is largely technology driven and will reduce the human interface to a great extent. GST is
expected to improve ease of doing business in India.
#### Which taxes at the Centre and State level are being subsumed into GST?
 Centre List
o Central Excise Duty
o Duties of Excise (Medicinal and Toilet Preparations)
o Additional Duties of Excise (Goods of Special Importance)
o Additional Duties of Excise (Textiles and Textile Products)
o Additional Duties of Customs (commonly known as CVD)
o Special Additional Duty of Customs (SAD)
o Service Tax
o Central Surcharges and Cesses so far as they relate to supply of goods and services
 State List
o State VAT
o Central Sales Tax
o Luxury Tax
o Entry Tax (all forms)
o Entertainment and Amusement Tax (except when levied by the local bodies)
o Taxes on advertisements
o Purchase Tax
o Taxes on lotteries, betting and gambling
o State Surcharges and Cesses so far as they relate to supply of goods and services.
##### Chronological events that have led to the introduction of GST
 Took 13 years to implement, first discussed in Kelkar task force (2003) on indirect taxes which
suggested a comprehensive GST based on VAT principle.
 Budget speech of 2006-07, mooted the idea for nationwide adoption of GST by 1st
April 2010.
Since the stakeholders of GST is not only Centre but States also, therefore, an Empowered
committee of States Finance ministers was set up to design to road map of GST.
4
 GST involved major overhaul of constitution (required constitutional amendment)
constitutional amendment bill 115 was introduced in parliament in March 2011 and referred to
standing committee on finance in parliament.
 Meanwhile, on 8th
Nov 2012, Committee on GST Design’, consisting of the officials of the
Government of India, State Governments and the Empowered Committee was constituted.
 This committee in their Bhubaneshwar meeting on January 2013 decided on three
subcommittees on:
(a) Committee on Place of Supply Rules and Revenue Neutral Rates
(b) Committee on dual control, threshold and exemptions;
(c) Committee on IGST and GST on imports.
 Parliamentary standing committee submitted its report to Lok Sabha in August 2013. Most of
the recommendations of standing committee and Empowered Committee was accepted and
GST Bill was subsequently revised.
 Final revised draft of GST bill was sent of EC for further consideration in September 2013. EC
once again made certain changes in the draft in its Shillong meeting in November 2013 and
send it to standing committee for further consideration.
 The 115th Constitutional (Amendment) Bill, 2011, for the introduction of GST introduced in
the Lok Sabha in March 2011 lapsed with the dissolution of the 15th Lok Sabha.
 In June 2014, the draft Constitution Amendment Bill was sent to the Empowered Committee
after approval of the new Government.
 Based on a broad consensus reached with the Empowered Committee on the contours of the
Bill, the Cabinet on 17.12.2014 approved the proposal for introduction of a Bill in the
Parliament for amending the Constitution of India to facilitate the introduction of Goods and
Services Tax (GST) in the country. The Bill was introduced in the Lok Sabha on 19.12.2014,
and was passed by the Lok Sabha on 06.05.2015. It was then referred to the Select Committee
of Rajya Sabha, which submitted its report on 22.07.2015.
2.2 Introduction
GST heralded for: One nation One Tax, Expanding tax base, promoting cooperative federalism.
However, GST can also provide vast information repositories which enhances our understanding
of Indian Economy. Some of finding on the basis of this information are as follows:
1. Large increase in no. of taxpayers, many (especially small enterprises) have voluntarily chosen
to register for GST to avail input tax credit.
2. GST base of States is proportional to their respective GDP. Allying fear of loss of tax revenue
(because GST is consumption/destination based tax as compare to earlier system which is
production based tax).
3. Strong correlation b/w exports by states and their standard of living (measured in term of
SGDP).
4. Larger firms in India accounts for much lower % of exports comparatively to similar large
firms in ROW.
5. Internal trade is 60% of GDP, which is greater than the estimates of last survey and compare
favorably to ROW.
6. India’s formal sector non-farm payroll is substantially greater than currently believed.
Formality defined in term of social security => formal non-farm payroll is 31% of non-
Commented [S6]: In which both Centre and states
government interact and collectively to solve common
problem.
Commented [S7]: Registration of small enterprises up to
certain threshold are not mandatory. They are tax
exempted.
Commented [S8]: Basically means non-farm employment.
Non-farm sectors includes: Dairy, manufacturing, retails,
transportations etc.
5
agricultural workforce. Formality defined in term of being of GST net => formal sector
payroll is 53%.
7. Size of formal sector (defined as either by social security net or GST net) is 13% of the total
firms in private non-agriculture sector. In term of turnover (Sales) is 93%.
2.3 TAXPAYERS
1. As of December 2017, 9.8 million unique GST registrant. Adjusting the base after double,
triple counting, the GST has increased the unique indirect taxpayers by more than 50% =>
3.4 million.
2. Profile of new filers (3.4 million) => of their total turnover => 34% are B2B transaction,
17% are B2C transaction, and export are 30%.
3. Composition vs Normal GST registration => more and more registrant are choosing to
register as normal because to claim input tax credit which is not allowed in composition
scheme.
4. Maharashtra, U.P., T.N., Gujrat are the states with the largest no. of GST registrant.
5. U.P., and W.B., saw the largest increase in GST registration.
2.3 TAX BASE AND ITS SPATIAL DISTRIBUTION
1. Discussion on GST centered around two issues: 1. Tax Base and 2. Revenue Neutral Rate
(RNR).
a. RNR committee (2015) estimated tax base of 68.8 Lakh Crore and GST council
estimated tax base of 65.8 Lakh Crore on the base year of 2013-14. Current estimates
of tax base are approximately around 65-70 Lakh Crore.
b. RNR committee suggested a revenue neutral rate (RNR) of 15-16%.
2. Because GST is mainly consumption based tax as opposed to manufacturing based tax,
does it lead to revenue loss to major manufacturing states like Maharashtra, Gujrat etc.?
a. Data revealed that state wise share of total GST base is still higher for major
manufacturing states. MH 16%, TN 10%, KA 9%, UP 7%, GJ 6%.
b. Each state GST base is almost perfectly correlated (0.95) with SGDP => biggest tax
base still seems to with major producers states.
c. Tax base is more closely correlated with overall GDP (0.95) rather than Mfg (.82).
The possible explanation is that the states with strong manufacturing base has also
strong services base for Ex. MH, KA etc. therefore their tax revenue remain virtually
same.
d. Overall, data seems to suggest fairness and balance in GST outcome.
2.4 International Trade, Inter-state trade and Economic prosperity
1. GST database allowed for the first time in history to look at state wise distribution of
international export of good and service. MH, GJ, KA, TN, and Telangana account for 70%
of India’s Export.
2. SGDP (measure of prosperity) is highly correlated (.70) with Export share in SGDP (for 20
major states). One major outlier is Kerala, likely reason would be remittances.
3. Last yr. survey estimated India’s internal (inter-state) trade of goods was b/w 30-50% based
on central sales tax data. GST data suggest that India’s internal trade of goods and services is
about 60% of GDP.
4. Interstate Trade:
Commented [S9]: Workforce = Employed + unemployed.
Commented [S10]: Under old system (VAT) same entity
may have obtained multiple registration across different
states.
Commented [S11]: Mainly on the basis of turnover (sales)
=> threshold limit.
Commented [S12]: Chaired by Arvind Subramanian.
Commented [S13]: Need to develop a comprehensive
globalization index accounting for remittances.
6
a. Largest Exporters: MH, GJ, HR, TN, KN.
b. Largest Importers: MH, TN, UP, KN, GJ.
c. Largest trade surplus: GJ, HR, MH, Odisha, TN.
5. Two Questions:
a. States which are exporting more are the one which are importing more?
b. States which export more are the most competitive and run the largest trade
surplus?
The answers to both the questions are yes.
Correlation coefficient b/w states gross (X+M) and net trade (X-M) b/w is .80.
Correlation coefficient b/w states share in export and share in import is .93.
6. Is Internal trade enhances prosperity?
The correlation coefficient b/w states trade (X+M)/ SGDP ratio and their GSDP is only 0.49.
In conclusion international trade is more likely to be associated with prosperity as compare to
internal trade. However, more research is required on this issue.
2.5 Export Superstars: Indian Export Egalitarian Exceptionalism
1. Export Superstars: Firms accounting for disproportionately large share of export.
2. Freund and Pierola (2013) finds that top 1% firms account for more than 50% of export.
Further, it is argued that having and fostering bigness influences the sectoral composition of
exports and also helps create comparative advantage and improve long term prospects.
3. With GST database it is possible to construct firm level export:
Top
firms US Germany Brazil Mexico India
1% 55 68 72 67 38
5% 74 86 91 91 59
25% 93 98 99 99 82
Source: Economic Survey 2017-18
Note = Data does not include petroleum & petroleum product
for Germany, Brazil, Mexico and India but US
5. One caveat is that India’s data include services export where concentration level is much
lower than mfg.
6. The evidence of such an egalitarian export superstars are unclear. It has both the positive
(spillover, more competitive etc.) and negative effect (limiting competition).
2.7 Informality of Indian Economy
1. Survey defined formality in two ways: Social security net and GST net.
2. Social security benefits are provided by firms to its employees. In India Govt. provide this
for its employees and Employees’ Provident Fund Organization (EPFO) provides it to
Private sector employees in respect of pensions and provident funds; and the Employees’
State Insurance Corporation (ESIC) in respect of medical benefits.
7
3. EPFO contributions are mandatory for industries employing >20 workers and whose monthly
wages/salaries are less than 15k. Above that contribution are voluntary.
4. ESIC contributions are mandatory for certain firms, employing >10 workers and whose
monthly salaries/wages are less than 21k.
5. Second way of defining formality is when firms are part of tax net. This can done using GST
database.
Notes:
MSME amendment act (2015) to change the criteria of classification of MSME on the basis of
turnover (sales) as opposed to current classification which is based on investment in plant and
machinery for mfg. and investment in equipment for service sector.
The criterion of investment in plant and machinery stipulates self-declaration which in turn
entails verification if deemed necessary and leads to transaction costs.
Turnover (T)
in crores
Micro T < 5
Small 5 < T < 75
Medium 75 < T < 250
This will encourage ease of doing business, make the norms of classification growth oriented and
align them to the new tax regime revolving around GST (Goods & Services Tax).
Commented [S14]: 98% opted for provident fund-
pension scheme.
Commented [S15]: Cabinet approved the amendments
but pending in Lok Sabha.
1
Chapter 3
Investment and Savings Slowdown in India
Source: WDI.
3.1 GIST
1. S&I peaked in mid-2000s, but after that they both declined profoundly.
2. What are the cross countries experiences and lesson to be drawn for India?
3. Investment slowdown has bearing on growth, but saving not necessarily effect growth.
4. Investment slowdown due to TBS => tends to be slow. However, mean reversion/ automatic
bounce back is absent => gradual or slower recovery.
5. Policy should priorities investment revival. Some of welcoming measures are resolution on
bad loans and liquidation/recapitalization of private banks.
3.2 INTRODUCTION
1. 8-10% Growth rate => structural reforms + S&I acceleration.
2. Structural reforms such as implementation of GST, resolution on bad loans, bank
recapitalization etc. are already taken by govt. of India, now S&I acceleration is required.
However, S&I is not unduly depressed, in fact, it remained higher than the 90’s.
3. Mainly due to global commodity boom, S&I rates in India has reached their respective
peak in mid-2000, however, decline thereafter, perhaps reaching its normal level in 2017.
0.00
5.00
10.00
15.00
20.00
25.00
30.00
35.00
40.00
1991
1992
1993
1994
1995
1996
1997
1998
1999
2000
2001
2002
2003
2004
2005
2006
2007
2008
2009
2010
2011
2012
2013
2014
2015
2016
2017
India's Saving & Investment rate
Gross fixed capital formation (% of GDP) Gross domestic savings (% of GDP)
Commented [S1]: See: IBC (2016) and FRDI (2017)
Commented [S2]: See: Indradhanush plan/scheme (2015)
primarily for bank recapitalization.
2
Years
Investment
Rate
Saving
Rate
2003 26.5 29.2
2007 35.4 38.3
2017 26.4 29
Source: ES 2018
4. Such swing in the behavior of S&I have never happened in Indian history – neither in BOP
crisis (1991) nor in Asian Financial Crisis (1998). Only other country showing similar pattern
of S&I is Brazil.
5. Which sector is responsible for the decline in S&I rate b/w 2007-08 to 2015-16?
a. Investment decline (6.3 percentage point) due decline in private investment (5
percentage point)
b. Saving decline (7.7 percentage point) due to decline in HH savings (5.2 percentage
point) and Govt. savings (4 percentage point).
6. This chapter deals with:
 Identifying episodes of S&I
slowdown
 Studying their patterns
 Examine how investment
behaves in the aftermath of crisis
 Drawing policy lessons.
Relationship b/w Saving and Investment
a. S = I
b. Total savings = public savings + private saving.
c. Private saving = Household savings + corporate saving, therefore,
d. Total savings = public savings + HH savings + corporate savings = Investment.
Decline in HH savings are mainly due to the decline
in physical savings (bank deposit) and increasing
investment in market driven instrument such as
bonds, mutual funds etc. The main reason for this
shift is demonetization.
3
3.3 Identifying S&I slowdown
In ES, the slowdown are defined using “filters/conditions”. A “short fall” is defined as
a. difference b/w average of investment/saving in the slowdown year and subsequent two years
b. average of previous 5 years
Then a “slowdown” year is defined as one where the shortfall in that year exceeds certain
threshold. If there are two or more consecutive slowdown years, this count as “slowdown
episode”. Second the average investment rate for the 5 years prior to the slowdown year is at
least 15% of GDP.
The threshold considered are of 2, 3 and 4 percentage points. As Rodrick (2000) argued that
lower the threshold, greater the risk of capturing episodes of temporary voluntary rather than
more enduring slowdowns. Also, India’s current I&S slowdown has been so gradual it is best
captured in the 2% threshold. Moreover, the results are likely to be hold true for 3 & 4 %
threshold as well.
Survey has studied the 55 countries, in the effective time span of 40 years (1975-2014), which a
sample of total 2200 observations. The results are as follows:
1. At 3% threshold, investment slowdown are more frequent than savings slowdown. This
pattern, however, has reversed after 2008, with saving episodes are catching up with
investment episodes (increasing savings slowdown episodes). However, both S&I episodes
has declined in the latest period, mainly due to concerted effort of global economies to revive
growth via stimulus and other policies.
2. The magnitude of investment slowdown is 33% which is significantly greater than the
magnitude of saving slowdown which is 22%. (This means investment slowdown are more
lasting as compare to saving slowdown).
3. Investment slowdowns are more extreme, as compare to saving slowdown in terms of
cumulative magnitude.
4. Both S&I slowdowns are quite frequent in all the countries under consideration, even
appearing in China (1998), Singapore (1985, 1999) and Mauritius (1981, 1995, 2012).
5. How does India fit into the broader picture?
a. India => special case. India never experienced the S&I slowdown – neither in BOP
crisis (1991) nor in Asian crisis (1998), the current episode of slowdown in S&I is
first in Indian history.
b. Slowdown is most fully detected only in 2% threshold level, mainly because in India,
the decline in both the S&I has been gradual unlike sharp adjustment that occur in
other countries.
c. Inv. slowdown started in 2012 (surpassing 2% threshold) and subsequently intensified
(surpassing the 3% and 4% threshold in 2013 and 2014 respectively). The slowdown
episode in investment is still ongoing currently it is in 6th
years, however, the decline
remain gradual.
Commented [S3]: Magnitude are shortfalls, cumulated
over entire slowdown episode.
4
d. Savings slowdown started in 2010 (surpassing 2% threshold), and also seems to be
still ongoing. Owing to data limitations, however, the last year that can be captured as
a slowdown year in 2014.
e. In conclusion, the current S&I slowdown in India is lengthy and doesn’t seems to
over yet.
3.4 Savings vs Investment: Growth consequences
Which should be priorities for growth revival? Should policies that boost investment
(infrastructure, ease of doing business, Make in India) be given priority over that boost savings?
The issue is of relative importance and urgency. However, in the long run, both the S&I are
crucial.
The standard solution is to boost S & I simultaneously. However, Rodrick (2000) provides
evidence that simultaneous push doesn’t necessarily lead to growth. He argued for investment
revival which in turn leads to growth and savings. (Savings doesn’t necessarily lead to
investment growth). Minsky also accorded the primacy of investment over savings.
Therefore, in short run investment need to be priorities.
Does similar conclusion hold for India as well?
1. In cross-country analysis, the relationship b/w growth slowdown and investment slowdown is
found to be positive. But the relationship b/w growth slowdown and savings slowdown in
unclear (not associated with sharp decline in growth).
2. India is above the line of best fit, though not an outlier, suggesting that the impact on growth
has been relatively moderate than other comparable countries. 1 percentage point decline in
investment is expected to dent growth by 0.4-0.7%.
3.5 Recovery from “India Type” Investment Slowdowns
"India Type
Investment
Slowdown"
Unusual:
First in
Indian
History
Started
from
very
high
peak
rate of
36%
moderate in
magnitute,
i.e. gradual
decline
Long in
duration
Specific in nature, mainly
due to Balance sheet stress.
In other word, many
companies have had to
curtail their investments
because their finances are
stressed, as investment they
undertook during the boom
have not generated enough
revenues to allow them to
service the debts they have
incurred.
5
When would be expected recovery from “India type investment Slowdown”?
Survey analyses two cases:
a. Recovery after balance
sheet stress
b. Where investment fell by
8.5 percentage points peak
to trough over 9 years.
 Survey estimated the investment
recovery for 11, 14 &17 year after
the peak of 2007 (Balance sheet
and non-balance sheet recovery).
 Investment slowdown from
balance sheet problem are more
difficult to reverse. Investment
remains highly depressed, even
after 17 years of peak.
 Non-balance sheet slowdown are
short and tends to reverse.
 India’s inv. decline is unusually
large when compare to other
balance sheet cases.
 Survey analyzed the experience of
countries with similar investment
decline. And estimated the
investment rate of 11, 14 & 17 year
after the peak.
 There are 30 such cases in the
sample. The median country
reverses only 25% after 14 year
and 40% after 17 year. If India
confirm this pattern, Investment-
GDP ratio improve by 2.5
percentage point in short run.
 However, India has paid
moderate cost in term of growth
b/w 2007-16 by about 2.3% due
to investment decline.
6
3.6 CONCLUSION: LESSONS AND POLICY SUGGESTIONS
1. Investment slowdowns are more detrimental to growth than saving slowdown => Short run
policy priority is the revival of investment.
2. Channelize savings via unearthing black money, and encouraging conversion of gold into
financial investment.
3. India’s investment slowdown is far from over, however, it has unfolded gradually and its
effect on growth are rather moderate.
4. How will investment slowdown reverse, so that India can regain 8-10% growth rate?
The answer is both the bleak and hopeful. Due to balance sheet nature of India’s investment
slowdown, its reversal seems difficult in the absence of any bounce back mechanism. The
deeper the slowdown, the slower and shallower the recovery. At the same time, it remain true
that some countries in the similar situation have fairly strong recoveries, suggesting that
policy action can decisively improve the outlook.
5. Need to have a clear and urgent policy agenda, GOI is working on this direction; first step-up
(increase) in public investment in 2015 and then constraint in public investment to solve
TBS. These steps in combination with complementary measures such, providing conducive
environment for MSME sector, easing the cost of doing business, and clear, transparent and
stable tax and regulatory framework will help in unleashing the “ANIMAL SPIRIT” of
India’s corporate sector.
1
Chapter 4
Fiscal Federalism, Taxation and Accountability
4.1 INTRODUCTION
1. Taxation is not just the vehicle of revenue collection. It is also critically important for
economic and political development.
Besley & Persson (2013)
State’s Role
To create the conditions for
prosperity for all by
providing essential services
and protecting the less
well- off via redistribution.
Citizen’s role
To hold state accountable
when it fails to honor that
contract.
Taxation is a two way
social contract b/w state
and citizen.
Citizen’s stake in exercising accountability
diminishes when
 When he does not pay visible and
direct taxes and choose to free ride
(use service without payment), and
cannot complain about poor quality.
 When he exit (not using service at all),
then he loses his interest in holding
state accountable.
Only if citizens pays taxes &
uses services then he will try
to hold state accountable.
“NO REPRESENTATION
WITHOUT TAXATION”
In other word, taxation is a glue that
binds citizens to the state in a necessary
two-way relationship (Economic Survey
2015-16, Chapter 7).
2
2. Which tax (direct or indirect) bind citizens to be more accountable and responsible? The
answer is direct tax.
3. Two international stylized facts about fiscal federalism, taxation, accountability and
development:
Direct Taxation and development:
General (federal) Government
For general govt. economic and
political development has been
associated with a rising share of direct
taxes in total taxes.
Advanced countries collect a
substantially higher share of their taxes
as direct taxes than do emerging
economies. This proportion has also
risen overtime.
India has a lower share of direct taxes
in total taxes. However, India is not an
outlier. Its share of direct tax is similar
to other countries at comparable stage
of development. However, unlike in
other countries it reliance on direct
taxes seems to be declining and more
so with the implementation of GST.
Direct taxation and development:
Sub- federal level
Survey compares India, Germany and Brazil
countries which have 3 tier governance
structure. All three countries are similar in their
reliance on devolved resources. However, share
of direct tax in total tax revenue at state level is
6% in India compared to 19% & 44% in
Germany & Brazil respectively in 2016.
At 3rd tier, India's rural local govt. (RLGs)
stand out on both counts. RLGs reliance on own
resources is just 6% compare to 40% in
Germany & Brazil. And panchayat raises only
4% of their overall resources in the form of
direct taxes, compared with 19% &26 in Brazil
and Germany.
India's Urban Local bodies (ULGs) are close to
international standard. Their own revenue in
total revue is higher than both Germany &
Brazil. Their direct tax share is 18% compare to
19 % of Brazil and 26 % of Germany. This
iimples that India's ULg's are more fiscally
empowered. Limitation: Only big/large ULGs
are considered for India.
Direct Tax
 Citizen stake would be greater
because it hurt to pay directly.
 Direct taxes fee more like
expropriation because they
reduce citizens’ disposable
income, earnings.
Indirect tax
 With indirect taxes, citizens are
burdened but that sense is
leavened (weak) to the extent that
citizens feel they are exercising
choices.
3
4. Is the current system in India appropriate, and if not, can it be changed? This chapter shed
light on this question.
4.2 Local Governments: What do we know?
73rd
and 74th
constitutional amendments recognized panchayat and urban local bodies as
institutions of self-government.
RLGs or Panchayats were mandated to have three tiers (district, Intermediate and village) in
states with the population of 20 lakh. States were mandate to devolve such functions and
authorities to RLGs which would enable them to function as institutions of self-governance.
Indian constitution also provides the specific list of 29 matters which are the focus of their
governance. Such as agriculture and land reform, minor irrigation, small scale industries, rural
communication, drinking water, poverty alleviation programme.
States are also supposed to constitute quinquennial (5 year) State Finance Commission (SFC) to
determine the share of their resources going to local tiers.
Over the past two decades, local governments have gained prominence as institutions with
substantial say in grass root level development, albeit with significant spatial variations, and
space of political contestability.
Therefore any policy prescription for the third tier must be based on the understanding of their
performance. Some specific facts about local government are as follows:
Exp. patterns of
various tier of govt.
 Central & State
govt. spend on an
average 15-20
times more per
capita than do
RLGs.
 ULGs spends about
3 times more per
capita than RLGs.
 The gap b/w
spending of various
tier of govt. is
persisting.
From where ULGs and RLGs
derive their resources to
spending?
 ULGs are different: ULGs
generate 44% of their total
revenue from own sources.
RLGs, on contrast, rely
about 95% on devolution.
 Variation across states: in
term of own revenue
generation. There are RLGs
of states (Kerala, AP, KA)
which that collect some
direct tax & revenue. On
the other hand RLGs of
states (UP) almost
dependent in devolution.
Other Issues
 In many states, RLGs &
ULGs have not been assigned
enough taxation powers.
Successive devolution report
of Ministry of Panchayati Raj
(MoPR) show that the share
of revenue assigned to local
bodies in many states as much
less vis-à-vis exp. assignment.
 Despite the formation of FC
by most states, it
recommendation has been
adopted by few only. With
Kerala being exception
accepting 100 %
recommendation.
4
4.3 State vs Local Government performance:
A common answer is that
higher levels especially at the
states have not devolved
enough taxation powers to
panchayat. For example, the
permissible taxes for
panchayats include property
taxes & entertainment taxes
but not land taxes or toll taxes
(except local panchayat roads).
Why is the own revenue
collection, especially
from direct taxes, so poor
for both the state & local
government?
Given their powers to
tax, how have state &
local govt. performed?
And have they collected
revenue close to the
potential?
These questions has been
analyzed for property
taxes which include land,
house, building &
property taxes.
a. Land tax is assessed &
collected by state.
b. Building tax including
property/house tax
collected by
municipality & gram
a. Land tax vis-à-vis potential: States
Survey estimated actual & potential
revenue from land tax. The stark
finding is that states collect a small
fraction of their potential. An all India
average of 19% if unreasonable low
value of land is assumed & about 7% on
more realistic land value assessment.
b. House tax vis-à-vis potential: RLGs
Survey estimated actual & potential
revenue from land tax. Even in the states
viz. Kerala and Karnataka that are ahead
of others in devolutions of powers to
RLGs, the collection vis-à-vis potential
is only around 1/3. All these are upper
bounds on tax collection vis-à-vis
potential given the lack of data on
commercial property taxes.
5
In conclusion, it can be said that local tier of government is not performing well because
they are not utilizing their tax potential rather than limited taxation power.
4.4 Conclusion: A low Equilibrium trap?
1. State & local govt. in India do not conform to the cross trends on own tax revenue & direct
taxes. Indian state & local govt. rely more on devolution and less on own tax revenue and
generate very low direct tax. => The reason for this is not the limit power of taxation but
rather a much bigger problem of underutilization of tax potential.
Is undercollection a matter of capacity/
resources/ expenditure/ effiency?
Is the problem a potential unwilling to tax
by state, stemming possibly from very
proximity b/w state & citizens upon which
decentralization is promised?
Is the problem a potential unwilling to tax
by state, stemming possibly from very
proximity b/w state & citizens upon which
decentralization is promised?
There is another possibility. the status quo
can be an equilibrium desired by all actor
with higher tier (both centre & states)
using their devolution powers to control &
influence lower level; and the later, unable
and unwilling to tax their proximate
citizens, need outside resources even if
they are not always untied. This is called a
"LOW-EQUILIBRIUM TRAP"
Why
this is
so?
In context of growing decentralization
of economic & political power, how to
break this equilibrium is one of the
more pressing issue confronting fiscal
federalism.
6
2. Broader challenge - afflicting all tier of government - in the limited ability to collect
direct taxes. Given the quality of public service delivery, such taxes are often viewed as a
“tribute" to a state rather than a contribution to and acknowledgement of the state in raising
the quality of life (Aiyar & Pritchett, 2015). On consequence of this is that the exit of
middle class to more privately-provided services (safety, health & education) that only
serves to exacerbate the problem.
Self-reinforcing cycle
Breaking this self-
reinforcing cycle is perhaps
at the heart of the
governance challenge.
Inadequate
delivery of public
services
Low direct
collection
Weak
Accoutability
1
Chapter 5
“Late convergence Stall”: Can India escape?
5.1 GIST
1. Developing countries are living in the time of unprecedented prosperity (economic growth)
and that is true for India as well which emerged as one of the most dynamic economic
performer in the world.
2. This is mainly due to economic “CONVERGENCE” => poorer countries have grown faster than
the richer countries and closed the gap b/w the two in term of standard of living. To quote
Subramanian (2011) there has been a “CONVERGENCE WITH VENGENGE”.
3. Convergence process has been broadening (no. of countries growing faster than US = the
benchmark country) and accelerating (average excess growth rate over US = the benchmark
country) for last 20-30 years.
4. However, there are possibility of late convergence stall due to four horseman/headwinds that
emerged after the global financial crisis of 2008, leaving countries into middle income trap.
Can India escape and become middle income country from its current status of lower-middle
country?
5. Four Horseman/Headwinds are:
5.2 INTRODUCTION
1. Best economic time for humanity especially for these living in poorer regions. The global
“BAD” such as war, famine, violence, deprivation and poverty are at all-time low. Whereas
the global “good” such as standard of living, access to essential services, and material
wellbeing etc. are at all-time low. This is particularly true for India which emerged as one of
most dynamic economy since 1980.
2. The rise of global “good” is mainly driven by “convergence” process which states that poorer
country tends to grow faster and catch up with rich counterparts in terms of standard of living.
3. From 1980-2017, the convergence process has been both broadening (68.6% countries in the
sample of 153 has grown faster than US = the benchmark country) and accelerating (with the
average excess growth rate of 1.7% over US = the benchmark country).
4. During the same period, India too has moved upward in hierarchy of development. From
being low income country in 1960 to lower middle country in 2008.
Protectionism:
that reduces
trade
opportunities
Thwarted
Structural
transformation:
shift from less to
less productive
sector
Human
Capital
regression:
Growing
demand from
Knowledge
Intensive
sector.
Climate
change
induced
agriculture
distress.
Commented [S1]: After Global Financial Crisis of 2008,
when the economic growth economy tumbles.
Commented [S2]: Based on biblical story which
symbolize the arrival of evil.
2
5. But, recently doubts about the convergence process have been articulated along the notion of
“MIDDLE INCOME TRAP”
“Middle Income Trap”:
Middle income countries
would grow more slowly
than what would be expected
given their level of income
(i.e. slower than richer
countries), impending the
transition from middle
income to higher income
status.
Reasons for
Middle Income
Trap/ Stall
a. As countries attained
middle income status,
they squeezed out of
MFG. and other
dynamic sectors by
poorer, lower-cost
competitor.
b. Lack the
institutional, human
& technological
capital to move them
up higher in the
value chain ladder.
Pushed from
below & unable
to gasp the top:
trapped in
middle.
 There is neither a middle income trap
nor stall. Middle income countries as a
group continued to grow as fast as or
faster than the convergence standard
demanded (Survey).
 Even after the GFC (2008), i.e. late
convergence, the convergence process is
actually accelerating. Growth rate: poorer
countries > lower middle income > upper
middle income > richer countries
3
6. Since, India is late converging country i.e. attempting to converge after the GFC of 2008,
its prospect of transition from lower middle to middle income status is gloomy. The GFC
of 2008 thwarted the global growth of all countries.
Underlying these slowdowns are some are major developments that could not only damage
growth over long the long term, but eventually even slow the process of convergence. These
are discussed in the next section.
2.3 Four Horseman/ Headwinds
1. Hyper globalization repudiation
a. Early converging countries (Such as China, Korea, Japan etc.) benefitted from
hyper globalization, however, later converging countries now faces altogether
different trading environment. After GFC 2008, there is a backlash against free
trade which is reflected in the declining world trade to GDP ratio. =>
DIMINSHING EXPORT OPPORTUNITIES.
2. Thwarted Structural Transformation
a. Successful development requires two kind of structural transformations
1. Shift of resources from low to high productive sectors (Lewsian
Transformation)
2. Larger share of resources devoted to more dynamic sector which has
potential for rapid productive growth.
b.
c. Rodrick (2015) identifies manufacturing as a most critical/ dynamic sector which
has potential of unconditional convergence and successful transformation. This is
main reason why “PRE-MATURE DE-INDUSTRIALIZATION” – tendency for
manufacturing in the late converging countries to peak at low productive sectors.
In many cases, the resources doesn’t shift in above mentioned ways. They shift
instead from informal, low productivity sectors to ones that are marginally more
productive/informal. This is called thwarted structural transformation.
Are late converging
countries particularly
vulnerable to thwarted
transformation?
 Survey analyzed the good growth
sector in which labor share increases
along with productivity growth
(manufacturing, telecom, finance &
professional services etc. and bad
growth sectors (hotels,
transportation, restaurant etc.)
 For both India & China, the share of
good growth sector in overall growth
is declining, especially after GFC of
2008. This is a matter of concern.
4
3. Human Capital Regression
a. One key difference b/w early convergence based on mfg. & late convergence against
the strong headwind of automation & globalization backlash is Human Capital.
b. In early convergence countries, industrialization fueled demands for unskilled &
semiskilled worker that allowed structural transformation of Lewisian type (from farm
to factory). However, late converging countries are challenged by growth of knowledge
economy which required highly skill workforce.
c. In other word, there is shift in the determinant of growth from labor based comparative
advantage in early convergence to absolute human capital attainment in late
convergence.
4. Climate change-induced agricultural stress
a. For later convergers, agriculture productivity is critical not just for feeding people but
for ensuring human capital accumulation in those who move from agriculture to
modern sector.
b. Survey estimated that rainfall shock & climate change induced temperature rises will
lead to 20-25% decline in revenues in non-irrigated regions in India.
2.5 Notes
1. Learning poverty count (LPC) measures the no. of children who do not meet the basic
learning benchmark.
2. Learning poverty gap (LPG) measures how far each student is from this benchmark
performance.
Annual survey of educational attainment (ASER) does the periodic assessment of LPC & LPG.
Chapter 6
Climate change & Agriculture
6.1 GIST
1. This chapter examined the long term trend of rising temperature, declining average
precipitation & increase in extreme precipitation on India agriculture using district level data.
2. One significant finding the threat of climate change exert its influence on extreme i.e. in
case when temperature is much higher than normal, rainfall significantly lower & no. of
“dry days” greater than normal.
3. Second significant finding is that the effect of climate change are more adverse for unirrigated
areas (rainfed crop).
4. The projected long term weather patterns implies on an average, agriculture incomes are likely
to decline up to 15-18% and up to 20-25% in the unirrigated area.
5. To minimize the loom of climate change there is need of extension of irrigation to non-irrigated
region especially in the form sprinkler & drip irrigation which are more water saving &
efficient. In addition to that the untargeted power & fertilizer subsidies has to done away with
more cereal centric subsidies in the form of DBT.
6.2 INTRODUCTION
 Why Agriculture in India matters?
 Why agriculture cannot be permanent/ dominant source of livelihood in India?
For economic reasons because
it still account for a 16% of
GDP & 49% of total
employment.
 Because agriculture is subject to diminishing returns & hence the living
standards it sustains can approach – those in mfg. & services.
 Economic development is always & everywhere about getting people out of
agriculture and in relative terms it is getting less important for GDP &
employment (Lewis 1954). However, this should happen along with the rise in
agriculture productivity so that it could support industrialization & urbanization.
 For social concerns raised by Dr. Ambedkar => village is sinking ship of
localism, a den of ignorance, narrow mindedness, and communalism.
t
 How has the Indian agriculture performed in the long run (1960-2017)?
Growth
 Real agriculture growth since
1960 has been averaged about
2.8% in India.
 In comparison to India,
China’s annual agriculture
growth has exceeded that of
china by a substantial 1.5
percentage point.
Variability
 Volatility of Indian agriculture
has declined substantially
overtime. From a standard
deviation of 6.3% b/w 1960-2004
to 2.9% since 2004.
 The reasons high volatility is
vagaries of weather => 52%
(73.2 million hectare area of
141.4 million hectares net sown
area) is still un-irrigated and
rainfed.
Against the mentioned background, this chapter pursue three objectives
 Document the changes in temperature & rainfall over the past six decade
 Estimate the effects of fluctuations in weather (temperature & rainfall) on agriculture
productivity.
 Use these short run estimates in conjunction with predicted changes in climate (long term
patterns of weather –temperature & rainfall) over the long run to arrive at estimates of the
impact of climate change on Indian agriculture.
All these analyses has been done using IMD database of precipitation & temperature and district
level on crop production.
6.3 Temporal (Time) & Spatial (Space) Patterns of Temperature & Precipitation
India's crop year starts from July to June, a dictinction usually followed
in north & interior India. In south India, this distinction is not followed
because temperature remain high enough to plant the tropical crops
through out a year.
Summer Crop/Zaid
March to June
Crop sown b/w kharif
& rabi
Mainly for ancillary
crop & fodder which
are of short duration.
Kharif Crop
July to october
It depend on south-
west mansoon. Hence
also called mansoon
crops.
It facilitate the tropical
crop.
Major crops are: Rice,
Cereals, Maize, Pulses
etc.
It is the most important
agriculture season in
India.
Rabi Crop
October to March
This season is called
winter season of
cropping.
Mainly depend on
northeast mansoon.
Low temp. facilitates
the cultivation of
temperate &
subtropical crop
Major crops are:
Wheat, Barley, Oats,
chicpear/gram, mustard
etc.
1. TEMPORAL PATTERNS
1. Since 1970s, there has been a general pattern of rising temperature in both the
cropping seasons viz. kharif & rabi.
 The broad pattern of rising temperatures post 1970s is common in both the cropping seasons.
 The average increase in temperature b/w the most recent decade & 1970s is about 0.45
degree & 0.63 degree in kharif & rabi seasons respectively. And are consistent with other
research.
2. Since 1970s, there has been a general pattern of declining precipitation in both the
cropping seasons viz. kharif & rabi.
 Between the 1970s & the last decade, kharif rainfall has declined on average by 26
millimeters & rabi rainfall by 33 millimeters.
 Annual average rainfall for this period has on average declined by about 86 millimeters.
3. Since 1970s, there has been a general pattern of rising number of extremely hot & cold
days (temperature extremity)
 Hot days are defined as days with temperature greater than the 95th
percentile of the grid-
point specific temperature.
 Cold days are defined as days with temperature less than 5th
percentile of the grid-point
specific temperature
 Above figures are suggestive of rise in the no. of days with extremely high temperature, and
correspondingly a decline in the no. of days with extremely low temperature.
4. Since 1970s, there has been a general pattern of rising no. dry & wet days
(precipitation extremity).
 Dry days are defined as days with rainfall less than 0.1 mm per day.
 Wet days are defined as days with rainfall greater than 80mm per day.
 Above figures clearly suggestive of rise in no. of dry days with extremely low & wet days
with extremely high precipitation.
2. SECTORAL PATTERNS
5. The pattern of average increase in warming is clearly visible in India in large extent.
 Pattern of average increase in warming is completely visibly as part of the map is covered
with red.
 The worst effected states are North-East, Kerala, Tamil Nadu, Rajasthan and Gujrat.
 The least effected states are Punjab, Uttar Pradesh and Odisha.
 The pattern of extreme precipitation is clearly visible in India as some states are getting
more rainfall than average and some are getting less rainfall than average.
 Extreme deficiencies in rainfall are more concentrated in Uttar Pradesh, North- East, Kerala,
Chhattisgarh, and Jharkhand.
 There is actually increase in precipitation in Gujrat, Odisha and Andhra Pradesh.
6.4 Impact of weather (temperature & rainfall) on agricultural productivity
The concerns of climate change are most likely to be felt by developing, hotter and less rich
countries. India being developing countries is part of torrid/tropical part of world which is
usually hotter than other parts and also hugely dependent on agriculture. Therefore, a meaningful
analysis is required to understand the impact of weather changes on agriculture.
 TWO KEY FINDINGS
Gggggggggggggggggggggg
 dd
 What are the varied susceptibility of different crops (yields) to temperature &
precipitation?
Extreme vs Moderate Shock
 Impact of temperature & rainfall
shocks are highly non-linear and
felt almost only when temperature
increases and rainfall shortfall are
extreme.
Irrigated vs non-irrigated
 These extreme shocks have highly
divergent effects between irrigated
or unirrigated area (districts where
less than 50% of cropped area is
irrigated).
 Unirrigated or Rainfed crops are
twice more likely to be adversely
affected as compared to irrigated
crops.
 A large literature focuses on the impact of a
one unit increase in temperature or a unit
decrease in rainfall on agriculture
productivity.
 Survey’s analyses show that, in Indian
context, such marginal changes in
weather (temp. & rainfall) have little or
no impact, and that the adverse effect of
weather are concentrated in extreme,
 Crops that are grown in rainfed areas-Pulses in both the
kharif & rabi season are vulnerable to weather shock. For
example: soya, chickpeas, pearl miller, line seed etc.
 Cereals viz. both wheat & rice are relatively more
immune.
6.5 Impact on Farm Revenue
 What do these no. imply to farmer loses in short & long run?
 On average, extreme temperature shocks reduces farmer incomes by 4.3% and
4.1% in kharif & rabi seasons respectively, whereas extreme rainfall shocks reduces
farmer income by 13.7% & 5.5 % in karif and rabi respectively.
 However, average hides more than what it reveal. Largest impact of extreme weather
shocks being felt by unirrigated regions.
 Ex-ante it is not clear where will farm revenue go in long run because- on the hand it will
reduce the yield (reducing supply) and on the other it will increase the price (due to
reduction in supply). However, survey’s analyses show that the “Supply Shock” due
to reduction in yield lead to reduced revenue.
 Survey estimated that in the absence of major policy change and adoption by
farmers, farm income will be lower by 15-18% on an average in the coming years
(long run). Unirrigated areas are most severely affected, with potential losses
amounting to 20-25%.
6.6 Conclusion & policy implication
 Conclusion
1. Impact of rainfall & temperature is felt only in extremes- when temperatures are much
higher, rainfall significantly lower, and the no. of “dry days” greater than normal.
2. The impacts are significantly higher for unirrigated regions (rainfed crops such as pulses)
compare to irrigated regions (cereal crops such as rice & wheat).
3. In the long run climate change will induces agriculture distress in India. On an average,
farm income is likely to be decline by 15-18%, rising to 20-15% for unirrigated area.
This translate into Rs. 3,600 per year for median farm household.
 Challenges & Policy suggestions
1. Indian need to expand the irrigation and this has to done in the backdrop water scarcity i.e.
declining ground water level. Total irrigated area has increased from less than 20% in 1960s
to mid-40s in 2017. However, there remain region disparities in the spread of irrigation in
India. Indo-Gangetic plains, and parts of Gujrat & MP are well irrigated, whereas parts of
KA, MH, MP, RJ, CH, and JH are still extremely vulnerable to climate shocks.
a. Irrigation expansion has to be done in the backdrop of water scarcity. Aeschbach
(2012) hinted that India pump ground water twice more than china. Since most of
irrigation projects in India are based on ground water, therefore the problem of
depletion of groundwater level is more acute in well irrigated states, especially in
North-India. In fact, in North-India the ground water has decline by 13% in last 30
years.
b. Need of the hour in India is to spread the irrigation to mitigate the climate related
volatility that too in the presence of water scarcity in such way to ensure higher water
use efficiency. The spread of irrigation should be done by micro/ small/ mini
irrigation projects that doesn’t much water and also preserve associated bio-diversity,
livelihood and local habitation. In addition to spread of modern irrigation technology
viz. sprinkler & drip irrigation- “MORE CROP PER DROP” can lead to drastic
improvement water is use efficiency. Though costly, these technologies will likely to
Fully irrigating Indian
agriculture against the
backdrop of water
scarcity i.e. declining
ground water table.
Water-Power Nexus:-
issue of power subsidies.
Embracing agricutural
science & technology with
renewed ardour to tackle
emerging agricutural issue
such as climate change
impact, pest & crop
disease.
To mitigate the uncertainty of
weather - effective insurance
scheme should be devised
based on weather based model
& technology such drones.
For policy making, there
should be clear
understanding of India
agriculture whihc is vastly
heterogenous i.e. needs
norther states wouold be
different from central or
southerns states.
reduce social cost of production (accounting for water & electricity damage) in Indian
agriculture. The government of India should promote, subsidies as well as incentivize
farmer to use technologies.
2. The nexus between power and water overuse has to be break. Due to this nexus both these
sector are in distress. A “vicious circle of negligence” is operating in Indian agriculture
mainly due distorted market price of resources. The virtually free electricity to farmer leads
to overuse of water pump which lead to reduction in water level reduction.
a. To tackle this water-power nexus, strong political will is required especially at state
level because both agriculture & power are state subject in Indian constitution. Sadly,
farmers are the strong & major vote bank for state governments, any reformative step
will have repercussion in election result.
3. The agriculture science and technology need to embrace with renewed ardor to tackle the
emerging agriculture related issues such as climate change related impacts, and pest & crop
disease.
4. Indian agriculture is subject of uncertainties of various types. To hedge against these
uncertainties and protect to farmers, an effective insurance system is required which does the
quantification of risk/uncertainties, discovering effective premium rates and ensure quick,
timely, transparent and effective delivery mechanism. The introduction of PRADHAN
MANTRI FASAL BIMA YOJNA in January 2016 is a welcome step in this direction. The
necessary step forward is to use modern drone/weather based technology to forecast
uncertainties & then effectively devising premium rates.
5. Finally, in the policy making it should be clearly acknowledged that Indian agriculture is
heterogeneous across the country.
a. In fact, there are two agricultures in India. There is an agriculture which is well
irrigated, input addled, and price & procurement supported cereals grown in northern
India – where the challenge is do away with power & fertilizer subsidies and
implement less damaging DBT.
b. Then there is other agriculture (broadly non-cereals in central, western and southern
India) where the problems are very different:” inadequate irrigation, continued
rainfed, ineffective procurement, and insufficient investments in R&D (non-cereals
such as pulses, soya beans, and cotton), high market barriers, and weak post-harvest
infrastructure (fruits & vegetable), and challenging non-economic policy frame work
(livestock.)
6.7 Notes
1. Shah Committee (2015) on water
 High powered committee set up by government in September 2015 and it was headed
by Mihir Shah
 Objective: To ensure the development of water resources in country.
 Submitted its report titled “21st Century Institutional Architecture for India’s
Water Reforms: Restructuring the CWC and CGWB”
 Committee has recommended a complete overhaul of current management system
including Central Water Commission (CWC) and Central Ground Water Board
(CGWB) to face the new emerging challenges.
 Recommended the establishment of National Water Commission (NWC) as an apex
institution dealing with development, policy, data and governance.
2. Swaminathan committee (2004): National Commission on Farmer
 Committee was constituted on 2004 and head by MS Swaminathan, an eminent
agriculture scientist.
 Submitted 5 reports b/w 2004-06.
 5th
report – specifically deals with farmer distress & suicide and recommended a
holistic national policy for farmer.
 Findings and recommendations mainly focused on issues of access to resources and
social security entitlements.
 It contains suggestions for inclusive growth of farmers and agriculture sector in India.
 It is aimed at working out a system for food and nutrition security, sustainability in
the farming system, enhancing quality and cost competitiveness of farm commodities
and also to recommend measures for credit and other marketing related steps.
 MSP should be at least 50% more than the weighted average cost of production. The
“net take home income” of farmers should be comparable to those of civil servants.
 However, most of the recommendations in the reports of National Commission on
Farmers are not yet implemented.
3. Pradhan Mantri Fasal Bima Yojna (2016)
 PMFBY replaced the National Agricultural Insurance Scheme (NAIS) and Modified
National Agricultural Insurance Scheme (MNAIS). PMFBY is designed to reduce the
burden of crop insurance on farmers.
 The Weather-Based Crop Insurance Scheme (WBCIS) remains in place, though its
premium rates have been made the same as in PMFBY.
 State governments have the authority to decide whether they want PMFBY, WBCIS or
both in their respective states.
 The new Crop Insurance Scheme – PMFBY- is in line with ‘One Nation – One Scheme’
1
Chapter 7
Gender & Son meta-preferences: Is development itself an antidote?
7.1 Introduction
At this juncture of development, it is critically important to ask, how is India faring & how much
progress has been made toward women empowerment?
Is India the land of the empowered or the helpless/oppressed women?
EQUALITY VS EQUITY
1. Gender equality is desirable because it has significant economic & social gains.
a. There are growing evidence that there can be significant economic gains if women
acquire agency i.e. role in decision making, assume political & public spaces and
participate in labor force. In developing countries, especially in India, women labor force
participation is very low, which required a corrective measure. According to IMF
research, women labor force participation to the level of men will boost India GDP by
27%.
b. Working women will likely to invest more in children education, hence inducing human
capital formation.
2. How responsive is gender quality to development?
2
a. Methodological issue: Development time vs Chronological time
b. Gender Index such as the Global Gender Gap Index1 of World Economic Forum
(WEF) or Gender Inequality Index2 of United Nations Development Program
(UNDP) ranks countries in chronological time. However, such simple cross-sectional
comparisons are prone to potential flaw.
c. The role of women evolves with development. Scandinavia in the early 1900s was
demonstrably less well-disposed to women than the Scandinavia of today. Therefore,
accounting for the level of development is must for any kind of meaning comparison.
d. Survey intended to correct this by introducing a novel notion of “development time”
as opposed to chronological time which is used by most of the Gender Index.
To answer this question, survey has done two kind of assessment:
 LEVEL: How did India fare on the set of gender outcomes relative to the developing
countries in the late 1990s/early 2000s and in the most recent period 2015-16, controlling
for the level of development?
 CHANGE: Is there any kind of convergence effect? That is, are gender indicator more
responsive to household wealth in India than in other countries?
3. Gender equality is an inherently multi-dimensional issue. Survey has explored the gender
equality into 3 dimension and 17 variables.
a. Agency: related to women’s ability to make decisions on reproduction, spending on
themselves, their household and their own health & mobility.
b. Attitude: related to attitudes about violence against women/ wives, and the ideal
number of daughters preferred relative to no. of sons.
c. Outcomes: related to son preference (measured by sex ratio of last child), female
employment, age at first childbirth, and physical or sexual violence experience by
women.
Data used for this analyses is based on the Demographic and Health Survey (DHS) database
from 1980-2016. The survey has datasets at household level; both women & men are asked
detailed questions on gender related attitudes, agency, and outcomes, among other issue. The
National Family Health Survey (NFHS), which feeds into survey, has been with international
DHS datasets.
1 Global Gender Gap Index: In 2017, India ranks 108 in the list of 144 countries. Its rank
actually slips drastically from 87 in 2016 to 108 in 2017. This slip happened due to low female
labor participation & wages. Both Bangladesh & China ranks ahead of India. Their ranking in
2017 are 47 & 100 respectively.
2 Gender Inequality Index: In 2015, India ranks 125 in the list UN member coutries.
3
7.2 FINDINGS: Results has accounted for wealth difference across countries
1. LEVEL: INDIA’s Performance
4
a. On 12 out of 17 variables, average levels in India have improved overtime.
b. On 7 out of these 12 cases, India performs better than, or at par with the cohort of
other developing countries even after accounting for levels of development.
c. India has some distance to traverse on several dimensions (10 out of 17) to be on with
par other countries in development time. one such example is use of reversible
contraceptive => women have little control over when start reproduction, but only
seems have control when they seem to have control over when they stop having
children. This could possibly effect their prospect of labor market participation.
d. However, the major worrisome dimension is declining labor force participation
be females, from 36% in 2005-06 to 24% in 2015-16. The long list of literature
document this phenomena. Goldin et al. (1995) documented a U-shaped behavior
of female labor force participation with rest to development. India is on the
downward part of the “U” but even more so than the comparable developing
countries.
 REASONS FOR LOW FEMALE LABOR FORCE PARTICIPATION IN INDIA
h
e. Sex ratio at birth is biased against women & is low by 9.5 percentage point s in
2015-16 in comparison to other countries. And this has remained stagnant in the last
decade. The primary reasons for this is sex-selective of female fetus.
On the supply side, rising
incomes of men allows Indian
women to withdraw from the
labor force, therefore avoiding
the stigma of working; higher
education levels of women also
allow them to pursue leisure &
other non-work activities all of
which reduce female labor
force participation. (Bhalla &
Kaur, 2011; Kapsos, 2014;
Klasen, 2015).
On the demand side, the
structural transformation of
Indian agriculture due to farm
mechanization results in a
lower demand for female
agricultural laborer
(Chatterjee et al. 2015;
Mehrotra et al. 2017
Other reasons, insufficient
availability of type of jobs that
women preferred specifically –
regular, part-time jobs which
provide them steady income &
allow women to reconcile
Household duties with work
(Kannan & Raveendran, 2012).
This can interact with safety
norms, caring children, elders &
household work.
5
2. CHANGE: Is there a convergence effect? – India’s performance relative to other countries.
The assessment undertaken is at the household level to see if greater gender related indicators
improve with wealth both in India as well in other countries.
6
In above table, the column shows the impact on the relevant gender indicator of one standard
deviation increase in wealth in the typical country in sample. For example, row 1 indicates that if
wealth increase by one standard deviation in the average country, the no. of women involved in
decision making on their health increase by 5.5 percentage points. Column 2 shows that in India,
the no. of women having agency on heath matters increases by further 4.7 percentage point for
one standard deviation increase in wealth. Column 3 shows the overall effect in India, in this
case 10.2 percentage point increase in wealth.
 Key finding is that in 15 out of 17 cases, gender indicators are more responsive to wealth
in India which is similar to typical countries. This suggests that even if India is lagging in
development time, it can expect to catch up with other countries as household wealth
increases.
 Two notable cases where the convergence effect is not visible and India appear to be
lagging behind in development time is on women employment and sex of last child.
3. Performance of Indian states: relative to each-other & to their level of development.
a. In the score of hundred, scores of all the states except Delhi has increased from 2005-
06 to 2015-16. This underscore the earlier results that there is an improvement
overtime in gender equality.
b. There is also a “convergence” effect in the poorer performers in the earlier period
improve their score overtime.
c. Most North-Eastern states (except Tripura & Arunachal Pradesh) and Goa occupy the
North-East quadrant, are the best performers at all point of time. Kerala is the next
best performer.
d. The lagging performers are Bihar, Rajasthan, MP, UP, JH, and AP.
e. Delhi’s performance actually worsens in a decade, and it fall having highest in 2005-
06 (down from 73 in 2005-06 to 70.9 in 2015-16.
f. In developmental “time frame work” state have much better scores given their level
of income. The states like AP, Haryana, Bihar, and TN performed less well given
their level of income.
4. Son preference: Skewed Sex Ratio at Birth (SRB)
 Issue relating to son preference are a matter for India society as whole to reflect upon.
Sex Ratio at Birth (SRB)
Males per 1000 female
YEAR INDIA CHINA
1970 1060 1070
2014 1108 1156
India
Year Sex Ratio of
total
population
Child Sex Ratio (0-
6 age group)
2001 933 927
7
 Overtime SRB has declined for both India & China.
 The biologically determined SRB is 1.05 males per females. Any significant
deviation from this is on account of human intervention specifically female child
specific sex-selective abortions.
 China’s skewed SRB is mainly due to one child policy adopted in 1970s which
interacted with strong preference for male child.
 From 1991 to 2011, there is a general upward drift in SRB across in Indian states =>
worsening with development. Most striking is the performance of Punjab & Haryana
where the child sex ratio is approaching 1200 males per 1000 females, even though
they are rich states.
 Sen (1990) documented the skewed sex ratio of females to males, estimated that
nearly 100 million women were missing in the world (almost 40 million is India
alone). A large part of this driven by a combination of sex selective abortion &
neglect of girl child after birth.
 Anderson & Ray (2014) update the no. of missing women. In 2014, there were nearly
63 million missing women and more than 2 million go missing in every year.
5. Son “Meta” preference: sex ratio of last child (SRLC) and “Unwanted Girls”
 SON “META” PREFERENCE: Parent may choose to keep having children until they
get desired no. of sons.
 This type of preference doesn’t lead to skew child sex ratio, but remained detrimental
to overall development of girl child (Jayachandran & Pande, 2017).
 A different measure is required to detect such “meta” preferences. One indicator is
sex ratio of last child (SRLC).
 A preference for sons will manifest itself in the SRLC being heavily skewed in favor
boys.
2011 940 919
8
 Meghalaya stands out as an ideal state because both SRB & SLRB are close to
benchmark. States in circle 2 and 3 such as Kerala, TN, etc. do not seem to practice
sex selective abortions (sex ratio are closer to biological rate) but do indicate son
“meta” preference (skewed SLRC). Punjab & Haryana, on the other hand, exhibits
very high son preference & “meta” preference (SLRC> Ideal SLRC & SRB> Ideal
SRB).
 Intuitively it implies that families where son is born are most likely to stop having
children than families where a girl is born. This is suggestive of parent employing
“stopping rules” – having children till a son is born & stopping thereafter. The only
exception to this pattern is with regard to the first child. Even parents who have their
first born as son are likely to continue having children, which reflects a pure family
size preference- Indian parents, on average want at least two children.
 Jaychandaran (2015) lists a no. of reason for such son preference, including
patrilocality (women having to move to husbands’ house after marriage),
patrilineality (property passing from father to son), dowry (which leads to extra costs
of having girls), old age support & ritual performed by sons.
 Such “meta” preference give rise to “unwanted girls” – girls whose parented wanted
boys but instead had a girl. Survey presented first ever notional estimates of
“unwanted girl” in India which is 21 million. This is calculated as the gap b/w
benchmark sex ratio & the actual sex ratio among the families that do not stop
fertility.
7.3 Conclusion
1. There has been significant improvement in the majority of gender related
indicators from 2005-06 to 2015-16. This holds true even after accounting for
development level.
9
2. However, several dimension especially use of reversible contraceptive,
employment & sex-ratio has some distance to traverse to catch up with other
countries because development on its own has not proved to be an antidote.
3. Encouragingly, gender patterns are converging with development comparable to
other countries. Therefore, now as India seems to lagging but expected to catch up
later.
4. Significant heterogeneity across Indian states: North-Eastern States consistently
outperformed other states, despite low level of development.
5. Because challenge is long and requires attitude & behavioral change – all the
stakeholders viz. family, society, civil society, communities, & state need to work
on comprehensive & cooperative manner for gender empowerment.
6. Scheme such as “BETI BACHAO BETI PADHAO” and “SUKANYA
SAMRIDHI YOJNA” are welcome step in this direction. However, first
responsibility & duty lies within the doors of families, society & community.
7. Recently amended maternity bill (2017) which mandates 26 weeks of maternity
leave for women in both public & private sector alongside crèche facilities for
children is needed to implement vigorously.
7.4 Notes
1. BETI BACHAO BETI PADHAO SCHEME (2015)
a. Scheme for survival, protection & education of the girl child against the backdrop
declining child sex ratio of female girl child in India.
b. Aims to address the issue of declining Child Sex Ratio (CSR) through a mass
campaign across the country targeted at changing societal mindsets & creating
awareness about the criticality of the issue.
c. Scheme will have focused intervention & multi-sectoral action in 100 districts
with low Child Sex Ratio.
d. It is a tri-ministerial, convergent effort of Ministries of Women and Child
Development, Health & Family Welfare and Human Resource Development.
2. SUKANYA SAMRIDDHI YOJANA (2015)
a. Sukanya Samriddhi Account: A promise of security for the girl child
b. Scheme aims to ensure a bright future for the girl children by facilitating their
education and marriage expenses.
c. By mid-March 2015, within 2 months of launch, 1.8 lakh bank accounts had been
opened under the scheme.
3. Maternity Amendment Act (2017)
Key amendments:
 Increased the duration of paid maternity leave from existing 12 weeks to 26 weeks.
 Act has also introduced an enabling provision relating to "work from home" for
women, which may be exercised after the expiry of the 26 weeks' leave period.
10
Depending upon the nature of work, women employees may be able to avail this
benefit on terms that are mutually agreed with the employer.
 Act makes crèche facility mandatory for every establishment employing 50 or more
employees and allowed them to vising 4 times during their working hours.
1
Chapter 8
Transforming Science & Technology in India
8.1 Why do we need to promote and invest in Science, Technology & Innovation?
 One of the key drivers of economic growth (economics of technological
change/innovation) in the world.
 Development of scientific temper, with its free spirit of inquiry based on reasons, can
provide a bulwark against the darker forces of dogma, religion, and nativism that are
threateningly resurfacing around the world.
 Investing in science is also fundamental to India’s security: the human security of its
population; uncertainty stemming from climate change; and national security challenges
stemming from new emerging from new threats, ranging from cyberwarfare to
autonomous military systems such as drones.
8.2 Trends in investment in STI: Input & Output
 Inputs: Gross expenditure in Research & development (GERD) and Ph.Ds. in
Science, Technology, Engineering and Mathematics (STEM).
 Output: Research publications and Patents.
A. Input: Gross Expenditure in R&D
a. Exp. on GERD has been steadily rising over time in India.
b. In nominal term exp. on GERD has tripled between 2004-05 & 2014-15.
c. In real term ex. On GERD has doubled during the same period.
d. However, GERD as a fraction of GDP has remained stagnant – between 0.6-0.7 percent –
over the past two decades.
e. Public exp. is dominant, although its share has come down from 75 percent to 60 percent.
f. About three-fifth of public spending on R&D is spread over the key government funding
agencies like CSIR, DRDO, Department of Atomic Energy (DEA), Department of
Biotechnology (DBT), DST, Department of Space (DOS), ICAR, and ICMR.
2
g. Comparatively, India’s expenditure on R&D is very low.
 India: 0.6 %
 US: 2.8 %
 China: 2.1
 Korea: 4.2 %
 Israel: 4.3 %
h. What is unique is India is that the government do most of the R&D activities, whereas, in
countries mentioned above, it the corporate sector which assume the greater role in R&D.
i. Private investment in India on GERD have severely lagged behind.
j. There are only 26 Indian companies are on the list of top R&D spenders, while China has
301 companies. 19 out of 26 companies are in just three sectors viz. Pharmaceuticals,
Automobiles & Software (Forbes, 2017).
B. Input: Ph.Ds. in Science, Technology, Engineering & Mathematics
a. Well trained Ph.Ds. in the stem are critical input in the R&D process.
b. No. of Indian student doing Ph.Ds. in stem from the US is only that of half of China.
c. It appears that fewer Indian students have been enrolling in recent years for such degree,
whether due to more attractive options after a master’s degree or rising work visa challenges.
d. On the other hand, there have been an increase in Ph.D. enrollment in India. In 2015-16,
1, 25,451 students were enrolled in Ph.D. programs in India, of 62 percent were in the stem.
This may be due to increase in no. and quantum of fellowship (Prime Minister Research
Fellowship).
e. Despite rising no. of Ph.Ds., India has far fewer researchers than other countries.
 USA: 4,231 researchers per
million population
 Israel: 8,255 researchers per
million population
 China: 1,113 researchers per
million population
 India: 156 researchers per
million population
C. Outputs: Publications
a. Publication hinted at the quality of Indian research and advancement in science.
b. In 2013, India ranked 6th
in the world in scientific publication. Its ranking has been
increasing as well
c. Between the years 2009-14, annual publication growth was almost 14%. This increased
India’s share in global publications from 3.1% in 2009 to 4.4% in 2014 as per Scorpus Data.
d. However, issue of quality remained in Indian publication. There are many journals that
publish non peer reviewed manuscripts for substantial fees. The major catalyst for their
explosive growth is “the demand created by increasing emphasis on the number of research
publications as an important determinant of the academic performance of a faculty/scientist
being considered for appointment or promotion” (Lakhotia, 2017).
e. One positive trend is increasing no. of highly cited papers by India. The nature index (which
publish tables based on counts of high-quality research outputs) – ranked India at 13 in 2017.
3
D. Output: Patents
a. Patents reflect country’s standing in technology.
b. According to WIPO, India is 7th
largest Patent Filling Office in the world.
c. In 2015, India registered 45,658 patents in comparison to China (1,101,864), USA (589,410)
Japan (318,721), Korean Republic (213,694 & Germany (91,726).
d. One major challenge in India is domestic patent system. While India’s patent grant status has
improved in foreign jurisdiction, the same is not true at home.
e. Residential applications have increased substantially since India joined international patent
regime in 2005. However the no. of patent granted fell sharply post 2008 and has remained
low.
f. While Indian residents were granted 5000 patents in foreign offices in 2015, the no. for
resident fillings in India was little over 800.
g. This decrease in grants of could have been due to a stricter examination process. But
evidence suggest that there is a severe backlog & high rate of pendency for domestic patent
application.
h. This high pendency is due to manpower shortage. There is a backlog of almost 2 lakh patent
pending examination. In 2016-17, there were only 132 examiners for all patent application.
This has meant that patent examination & granting can take 5 or more years (Chatterjee,
2017). Given the rapid rate technological obsolescence, the inordinate delays in processing
patens penalize innovation & innovator within the country.
i. Government recent hiring of over 450 additional patent examiners & creation of expedited
filing system for Indian resident in 2017 will therefore be a welcome & crucial intervention
to fix the current patent system.
8.3 Expanding R&D in India: Way Forward
India needs to redouble its effort to improve science and R&D in country first and foremost by
doubling national expenditure on GERD with most of the increase coming from the private
sector & universities. But the metrics also need to beyond papers & patents to broader
contribution to providing value for society.
4
1. Improve math’s & cognitive skills at school level
a. The structure of R&D has to be supported by super-structure of strong primary &
secondary education.
b. Weakness in primary & secondary education denies India access to the intellect &
energies of millions of young people.
c. Even at tertiary level, scheme need to be devised to attract talent pool of
resources.
2. Encouraging Investigator-led Research
a. Move gradually to investigator-led research.
b. Welcome step in direction – establishment of Science & Engineering Research
Board (SERB) – has sanctioned about 3,500 new R&D projects to individual
scientists.
3. Increasing contribution of private sector & state government
a. Private sector should be incentivize to do both R&D and support STEM research
through CSR.
b. Current tax already favors CSR investment in R&D, but the types of R&D
activities can be expanded.
c. Govt. & Pvt. sector can work together to create R&D opportunities which are in
line with private sector interest. One such example is Ucchatar Avishkar Yojna
(UAY)
d. State govt. too need to recognize the need to invest in application oriented
research aimed at problem specific to their economies & populations. This would
strengthen state universities and provide much need knowledge in areas such as
crops, ecology & species.
4. Link national labs to universities & create new knowledge eco-system
a. Separation of research & teaching has been an “Achilles Heel” for Indian Science.
b. There are universities which specializing in teaching and research institute/labs
specializing in research.
c. A closer relationship/association between the two in specific geographical &
spatial setting settings would help nurture research and teaching. Together they
can link up with commercial sector and help develop clusters of knowledge eco-
systems.
5. Take a mission driven approach to R&D
India has potential to be a global leader in no. of areas if it willing to invest. However, it
required focus on specific areas in which India has relative advantage and which of
strategic interest.
5
 National mission on Dark Matter promote basic science, energy physics and
relevant mathematics. The payoff of this mission will have implications on space
technology, newer solution to energy problems etc.
 National Mission on Genomics promotes life sciences. The implications of this
mission will be on disease control, and determining biological pathways.
 National Mission on Energy Storage System: India is energy scare countries, a
national mission on energy storage (for example: solar batteries) will likely to help in
satisfying energy need of millions of Indians.
 National Mission on Mathematics: Mathematics has two advantages 1) it is not
capital intensive & 2) standard of excellence are universal. A national mission on
mathematics will improve teaching, seeks to establish center of excellence and help in
developing critical mind.
 National Mission on Cyber Security Systems: It means whole machine based
communication, analysis, inference, decision, action, and control in context of
physical world. It’s a deeply multidisciplinary area of math’s, artificial intelligence
(AI), big data analysis, computing & programming, block chain technology, and
robotics & automation. Together these are the building block of future industry that
will throw up both new challenges & opportunities.
 National Mission on Agriculture: Improving agriculture productivity in India is still
one of the major challenges. The newer threats such climate change induced distress,
and pest & crop diseases demand a major thrust on agriculture Science &
Technology.
6. Leverage Scientific diaspora
a. Currently more than 100,000 people with PhDs, who were born in India but now
living & working outside India (more than 91,000 in US alone).
b. With growing prospect of economy & anti-immigration atmosphere in some
western countries, India has an opportunity to attract back more scientist. In fact,
increasing no. of Indian scientist are returning back in India during the last five
years, however, their no. remains modest.
c. No. of govt. schemes has been introduced to attract Indian as well as foreign
researcher to work and to do projects for India in India. (Ramanujan Fellowship,
INSPIRE, VAJRA etc.)
7. Improving the culture of research
a. Improving the governance structure – more interactive which promote learning rather
than hierarchical.
b. Promote & fund risky venture with huge benefits if it succeed.
8. Greater public engagement of the science & research establishment
a. Need to engage & interact with society to garner support from it.
b. Much of science is “public good”. The value & awareness of science has to be
inculcated in broader public.
6
8.4 Notes
1. Science can be defined the systematic study of the physical or material world (natural
science) and of society (social science) that generates, or creates, knowledge from
which data and information is drawn.
Technology can be defined as the application of scientific knowledge to develop
techniques to produce a product and/or deliver a service or as the application of
scientific knowledge for practical ends.
Innovation can be defined as deriving the benefits from a new or significantly
improved product (good or service), or process (such as a new marketing method) or a
new organizational method (such as in business practices, workplace organization or
external relations).
STI has an integrated life cycle where science leads to new technologies from which
innovations develop. Innovative ways of doing things can change and influence the
development of science and how and what technologies are brought forth which, in
turn, also influence the innovation process.
2. Evolution of Science Policy in India
1958
 India’s first Scientific Policy Resolution.
 Foster, promote & sustain the cultivation of science & scientific research in all
aspects.
1983
 New policy focused on the need to attain technological competence and self-
reliance.
2003
1. Bring science and technology together
2. Bring higher investment into R&D to address national problems.
3. Science & Technology to meet the challenge posit by globalization
2013
 Holistic integration of Science, Technology & Innovation
(STI) – prepared by Department of Science & Technology
 SRISHTI= Science, Research and innovation system for High technology led
path for India.
2010-20
 India has declared this as “decade of innovation”
7
Key objective of SPR 2013
 STI for faster, sustainable and more inclusive growth
 Focus on both STI for people and people for STI.
 Positioning India among the top five global scientific powers by 2020
 Publish more research papers.
 Encouraging private sector to invest in Research and Development (R&D)
 Promoting gender parity in S&T. (meaning bring more female scientists)
3. Schemes for promoting higher education & research in Science & Technology.
a. Prime Minister Research Fellowship (2018) to convert brain drain into brain
gain. The fellowship is targeted to incentivize the best brains to pursue Ph.Ds.
in India.
b. Uchatar Avishkar Yojana (2017) was launched to promote industry-specific
need-based research so as to keep up the competitiveness of the Indian industry in the
global market
c. Impacting Research Innovation and Technology (IMPRINT) India (2017):
IMPRINT INDIA is a Pan-IIT and IISc joint initiative to develop a roadmap for
research to solve major engineering and technology challenges in ten technology
domains relevant to India.
d. Global Initiative of Academic Network (2014): GIAN is aimed at tapping
the talent pool of scientists and entrepreneurs, internationally to encourage their
engagement with the institutes of Higher Education in India so as to augment the
country's existing academic resources, accelerate the pace of quality reform, and
elevate India's scientific and technological capacity to global excellence.
e. Innovation in Science Pursuit for Inspired Research (INSPIRE) (2008) is an
innovative programme sponsored and managed by the Department of Science &
Technology for attraction of talent to Science. The basic objective of INSPIRE is to
communicate to the youth of the country the excitements of creative pursuit of
science, attract talent to the study of science at an early age and thus build the
required critical human resource pool for strengthening and expanding the Science &
Technology system and R&D base.
f. Visiting Advanced Joint Research-Faculty Scheme (2017) is a dedicated program
exclusively for overseas scientists and academicians with emphasis on Non-resident
Indians (NRI) and Persons of Indian Origin (PIO) / Overseas Citizen of India (OCI)
to work as adjunct / visiting faculty for a specific period of time in Indian Public
funded academic and research institutions.
1
Chapter 9
Ease of Doing Business’ Next Frontier: Timely Justice
The government efforts to make India as a business friendly country has been widely acknowledge.
The next frontier is judiciary reforms which allows time justice and significantly reduce the time
& cost of commercial projects.
There is an immediate need of addressing pendency, delays and backlog in the appellate bodies
and judicial arenas. These issues are hampering dispute resolutions, contract enforcement, and
discouraging investment, hampering tax collection, stressing tax payers, and escalating legal costs.
This calls for a vertical co-operation between judiciary and government to boost economic growth
& provide justice.
9.1. Introduction
a. India’s ranking in ease in doing business (EODB) index has jumped to 100 in 2018 (a
significant increase from 130 in 2017). This is mainly due to the concerted effort of
government to make India as a destination for doing business.
b. India leaped 53 & 33 spots in taxation & insolvency related indices, respectively on the back
of administrative reform on taxation and implementation of Insolvency and Bankruptcy Code
(IBC) in 2016. It has also made strides on protecting minority investors & obtaining credit, and
retained a high rank on getting electricity, after a 70 spot rise in 2017 due to government
electricity reforms.
c. However, on contract enforcement indicators India continue to lag behind. Although its
position has marginally improved from 172 in 2017 to 164 in 2016.
d. In recent years, the government has taken no. of steps and action to expedite & improve
contract enforcement mechanism. For example, scrapping & rationalizing over 1000 redundant
acts, amendment on The Arbitration & Conciliation Act, 2015, passed The commercial courts,
 Efficient, effective & expeditious contract
mechanism affect economic growth.
 Clear & certain legislative and executive
regime backed by an efficient judiciary
that fairly and punctually protects property
rights, preserve sanctity of contracts, and
enforces the rights and liabilities of parties
is pre-requisite for business & commerce.
Why an efficient
judiciary is desirable?
Economics  survey 2017-18 Notes

More Related Content

What's hot

Industrial Policy, Fiscal Policy and Licensing Policy
Industrial Policy, Fiscal Policy and Licensing PolicyIndustrial Policy, Fiscal Policy and Licensing Policy
Industrial Policy, Fiscal Policy and Licensing PolicyPRASOON VERMA
 
Budget 2017 Highlights
Budget 2017 HighlightsBudget 2017 Highlights
Budget 2017 HighlightsShruti Agarwal
 
Indian economy
Indian economyIndian economy
Indian economykmbvb
 
Concept note of Goods & Service Tax (GST) in India
Concept note of Goods & Service Tax (GST) in IndiaConcept note of Goods & Service Tax (GST) in India
Concept note of Goods & Service Tax (GST) in IndiaANAND GAWADE
 
Nuances of Doing Business In India
Nuances of Doing Business In IndiaNuances of Doing Business In India
Nuances of Doing Business In IndiaShruti Agarwal
 
Presentation on India Budget 2017
Presentation on India Budget 2017Presentation on India Budget 2017
Presentation on India Budget 2017Prashant Kotecha
 
4.optitax's presentation on gst (25 june 17)
4.optitax's presentation on gst (25 june 17)4.optitax's presentation on gst (25 june 17)
4.optitax's presentation on gst (25 june 17)Nilesh Mahajan
 
Union budget 2017 Impact
Union budget 2017 ImpactUnion budget 2017 Impact
Union budget 2017 ImpactRajender Kapoor
 
Salient features of Union Budget 2017
Salient features of Union Budget 2017Salient features of Union Budget 2017
Salient features of Union Budget 2017CA. Pramod Jain
 
Economic reforms since 1991: Class XII - Part-2
Economic reforms since 1991: Class XII - Part-2Economic reforms since 1991: Class XII - Part-2
Economic reforms since 1991: Class XII - Part-2AnjaliKaur3
 
India GST from April 1, 2017
India GST from April 1, 2017India GST from April 1, 2017
India GST from April 1, 2017Amitabh Khemka
 
Ietp Session 2 June 28
Ietp Session   2 June 28Ietp Session   2 June 28
Ietp Session 2 June 28FNian
 
Research report on gst
Research report on gstResearch report on gst
Research report on gsttara kumari
 

What's hot (20)

Industrial Policy, Fiscal Policy and Licensing Policy
Industrial Policy, Fiscal Policy and Licensing PolicyIndustrial Policy, Fiscal Policy and Licensing Policy
Industrial Policy, Fiscal Policy and Licensing Policy
 
Budget 2017 Highlights
Budget 2017 HighlightsBudget 2017 Highlights
Budget 2017 Highlights
 
Indian economy
Indian economyIndian economy
Indian economy
 
Concept note of Goods & Service Tax (GST) in India
Concept note of Goods & Service Tax (GST) in IndiaConcept note of Goods & Service Tax (GST) in India
Concept note of Goods & Service Tax (GST) in India
 
gst
gstgst
gst
 
Economic survey final
Economic survey finalEconomic survey final
Economic survey final
 
Nuances of Doing Business In India
Nuances of Doing Business In IndiaNuances of Doing Business In India
Nuances of Doing Business In India
 
Union budget 2017
Union budget 2017Union budget 2017
Union budget 2017
 
Presentation on India Budget 2017
Presentation on India Budget 2017Presentation on India Budget 2017
Presentation on India Budget 2017
 
4.optitax's presentation on gst (25 june 17)
4.optitax's presentation on gst (25 june 17)4.optitax's presentation on gst (25 june 17)
4.optitax's presentation on gst (25 june 17)
 
Union budget 2017 Impact
Union budget 2017 ImpactUnion budget 2017 Impact
Union budget 2017 Impact
 
Salient features of Union Budget 2017
Salient features of Union Budget 2017Salient features of Union Budget 2017
Salient features of Union Budget 2017
 
GOODS AND SERVICE TEX(GST) BY
GOODS AND SERVICE TEX(GST) BY GOODS AND SERVICE TEX(GST) BY
GOODS AND SERVICE TEX(GST) BY
 
Economic reforms since 1991: Class XII - Part-2
Economic reforms since 1991: Class XII - Part-2Economic reforms since 1991: Class XII - Part-2
Economic reforms since 1991: Class XII - Part-2
 
Corporate Tax Reforms
Corporate Tax ReformsCorporate Tax Reforms
Corporate Tax Reforms
 
India GST from April 1, 2017
India GST from April 1, 2017India GST from April 1, 2017
India GST from April 1, 2017
 
GST Parminder Singh
GST  Parminder Singh GST  Parminder Singh
GST Parminder Singh
 
Union Budget 2015
Union Budget 2015 Union Budget 2015
Union Budget 2015
 
Ietp Session 2 June 28
Ietp Session   2 June 28Ietp Session   2 June 28
Ietp Session 2 June 28
 
Research report on gst
Research report on gstResearch report on gst
Research report on gst
 

Similar to Economics survey 2017-18 Notes

Key Discussions about ‘Taxes’ and ‘IBC’ in Economic Survey
Key Discussions about ‘Taxes’ and ‘IBC’ in Economic SurveyKey Discussions about ‘Taxes’ and ‘IBC’ in Economic Survey
Key Discussions about ‘Taxes’ and ‘IBC’ in Economic SurveyTaxmann
 
Business environment and Value based management.pptx
Business environment and Value based management.pptxBusiness environment and Value based management.pptx
Business environment and Value based management.pptxMahimaMariamThomas
 
#New Scheme of Export Incentive RoDTEP - By SN Panigrahi & CA Rishabh Sawansu...
#New Scheme of Export Incentive RoDTEP - By SN Panigrahi & CA Rishabh Sawansu...#New Scheme of Export Incentive RoDTEP - By SN Panigrahi & CA Rishabh Sawansu...
#New Scheme of Export Incentive RoDTEP - By SN Panigrahi & CA Rishabh Sawansu...SN Panigrahi, PMP
 
Goods and Services Tax
Goods and Services TaxGoods and Services Tax
Goods and Services TaxSundar B N
 
Fiscal policy of india
Fiscal policy of indiaFiscal policy of india
Fiscal policy of indiaPavelSarkar2
 
Goods and service tax in india
Goods and service tax in indiaGoods and service tax in india
Goods and service tax in indiaDev Shrivastava
 
India Union Budget 2015 - An Overview | A BDO India Publication
India Union Budget 2015 - An Overview | A BDO India PublicationIndia Union Budget 2015 - An Overview | A BDO India Publication
India Union Budget 2015 - An Overview | A BDO India PublicationOperations BDO
 
Article on GST - ICSI Souvenir of 43rd National Convention
Article on GST - ICSI Souvenir of 43rd National ConventionArticle on GST - ICSI Souvenir of 43rd National Convention
Article on GST - ICSI Souvenir of 43rd National ConventionLex Bolster Global LLP
 
Business Environment - Unit-5 - IMBA - Osmania University
Business Environment - Unit-5 - IMBA - Osmania UniversityBusiness Environment - Unit-5 - IMBA - Osmania University
Business Environment - Unit-5 - IMBA - Osmania UniversityBalasri Kamarapu
 
Impact Of New Tax Code On Financial Markets
Impact Of New Tax Code On Financial MarketsImpact Of New Tax Code On Financial Markets
Impact Of New Tax Code On Financial MarketsDharmesh Gandhi
 
Good and service tax (gst)
Good and service tax (gst)Good and service tax (gst)
Good and service tax (gst)Avi Vani
 
New Export Promotion Scheme RoDTEP : Implemented without Rates Announced - By...
New Export Promotion Scheme RoDTEP : Implemented without Rates Announced - By...New Export Promotion Scheme RoDTEP : Implemented without Rates Announced - By...
New Export Promotion Scheme RoDTEP : Implemented without Rates Announced - By...SN Panigrahi, PMP
 
A Taxation Dynamics In India Presentation.pdf
A Taxation Dynamics In India Presentation.pdfA Taxation Dynamics In India Presentation.pdf
A Taxation Dynamics In India Presentation.pdfTusharGupta437675
 
Gst and its implications
Gst and its implicationsGst and its implications
Gst and its implicationsSubramanya Bhat
 
Rsm india budget_2018_key_aspects_in_a_nutshell
Rsm india budget_2018_key_aspects_in_a_nutshellRsm india budget_2018_key_aspects_in_a_nutshell
Rsm india budget_2018_key_aspects_in_a_nutshellCA.Amit Sharma
 
GST UNIT 1 learning and practice of goods and services
GST UNIT 1 learning and practice of goods and servicesGST UNIT 1 learning and practice of goods and services
GST UNIT 1 learning and practice of goods and serviceshpotter46103
 

Similar to Economics survey 2017-18 Notes (20)

Key Discussions about ‘Taxes’ and ‘IBC’ in Economic Survey
Key Discussions about ‘Taxes’ and ‘IBC’ in Economic SurveyKey Discussions about ‘Taxes’ and ‘IBC’ in Economic Survey
Key Discussions about ‘Taxes’ and ‘IBC’ in Economic Survey
 
Business environment and Value based management.pptx
Business environment and Value based management.pptxBusiness environment and Value based management.pptx
Business environment and Value based management.pptx
 
#New Scheme of Export Incentive RoDTEP - By SN Panigrahi & CA Rishabh Sawansu...
#New Scheme of Export Incentive RoDTEP - By SN Panigrahi & CA Rishabh Sawansu...#New Scheme of Export Incentive RoDTEP - By SN Panigrahi & CA Rishabh Sawansu...
#New Scheme of Export Incentive RoDTEP - By SN Panigrahi & CA Rishabh Sawansu...
 
Goods and Services Tax
Goods and Services TaxGoods and Services Tax
Goods and Services Tax
 
Fiscal policy of india
Fiscal policy of indiaFiscal policy of india
Fiscal policy of india
 
Bhagyashree H. Chauhan (GST)
Bhagyashree H. Chauhan (GST)Bhagyashree H. Chauhan (GST)
Bhagyashree H. Chauhan (GST)
 
IMPLEMENTATION OF GST IN INDIA - 1
IMPLEMENTATION OF GST IN INDIA - 1IMPLEMENTATION OF GST IN INDIA - 1
IMPLEMENTATION OF GST IN INDIA - 1
 
Goods and service tax in india
Goods and service tax in indiaGoods and service tax in india
Goods and service tax in india
 
India Union Budget 2015 - An Overview | A BDO India Publication
India Union Budget 2015 - An Overview | A BDO India PublicationIndia Union Budget 2015 - An Overview | A BDO India Publication
India Union Budget 2015 - An Overview | A BDO India Publication
 
Article on GST - ICSI Souvenir of 43rd National Convention
Article on GST - ICSI Souvenir of 43rd National ConventionArticle on GST - ICSI Souvenir of 43rd National Convention
Article on GST - ICSI Souvenir of 43rd National Convention
 
Business Environment - Unit-5 - IMBA - Osmania University
Business Environment - Unit-5 - IMBA - Osmania UniversityBusiness Environment - Unit-5 - IMBA - Osmania University
Business Environment - Unit-5 - IMBA - Osmania University
 
Impact Of New Tax Code On Financial Markets
Impact Of New Tax Code On Financial MarketsImpact Of New Tax Code On Financial Markets
Impact Of New Tax Code On Financial Markets
 
Good and service tax (gst)
Good and service tax (gst)Good and service tax (gst)
Good and service tax (gst)
 
New Export Promotion Scheme RoDTEP : Implemented without Rates Announced - By...
New Export Promotion Scheme RoDTEP : Implemented without Rates Announced - By...New Export Promotion Scheme RoDTEP : Implemented without Rates Announced - By...
New Export Promotion Scheme RoDTEP : Implemented without Rates Announced - By...
 
A Taxation Dynamics In India Presentation.pdf
A Taxation Dynamics In India Presentation.pdfA Taxation Dynamics In India Presentation.pdf
A Taxation Dynamics In India Presentation.pdf
 
Gst and its implications
Gst and its implicationsGst and its implications
Gst and its implications
 
Rsm india budget_2018_key_aspects_in_a_nutshell
Rsm india budget_2018_key_aspects_in_a_nutshellRsm india budget_2018_key_aspects_in_a_nutshell
Rsm india budget_2018_key_aspects_in_a_nutshell
 
GST UNIT 1 learning and practice of goods and services
GST UNIT 1 learning and practice of goods and servicesGST UNIT 1 learning and practice of goods and services
GST UNIT 1 learning and practice of goods and services
 
taxmemorandum2015
taxmemorandum2015taxmemorandum2015
taxmemorandum2015
 
Executive supplement gst
Executive supplement gstExecutive supplement gst
Executive supplement gst
 

Recently uploaded

The Economic History of the U.S. Lecture 22.pdf
The Economic History of the U.S. Lecture 22.pdfThe Economic History of the U.S. Lecture 22.pdf
The Economic History of the U.S. Lecture 22.pdfGale Pooley
 
(ANIKA) Budhwar Peth Call Girls Just Call 7001035870 [ Cash on Delivery ] Pun...
(ANIKA) Budhwar Peth Call Girls Just Call 7001035870 [ Cash on Delivery ] Pun...(ANIKA) Budhwar Peth Call Girls Just Call 7001035870 [ Cash on Delivery ] Pun...
(ANIKA) Budhwar Peth Call Girls Just Call 7001035870 [ Cash on Delivery ] Pun...ranjana rawat
 
TEST BANK For Corporate Finance, 13th Edition By Stephen Ross, Randolph Weste...
TEST BANK For Corporate Finance, 13th Edition By Stephen Ross, Randolph Weste...TEST BANK For Corporate Finance, 13th Edition By Stephen Ross, Randolph Weste...
TEST BANK For Corporate Finance, 13th Edition By Stephen Ross, Randolph Weste...ssifa0344
 
Gurley shaw Theory of Monetary Economics.
Gurley shaw Theory of Monetary Economics.Gurley shaw Theory of Monetary Economics.
Gurley shaw Theory of Monetary Economics.Vinodha Devi
 
Top Rated Pune Call Girls Viman Nagar ⟟ 6297143586 ⟟ Call Me For Genuine Sex...
Top Rated  Pune Call Girls Viman Nagar ⟟ 6297143586 ⟟ Call Me For Genuine Sex...Top Rated  Pune Call Girls Viman Nagar ⟟ 6297143586 ⟟ Call Me For Genuine Sex...
Top Rated Pune Call Girls Viman Nagar ⟟ 6297143586 ⟟ Call Me For Genuine Sex...Call Girls in Nagpur High Profile
 
The Economic History of the U.S. Lecture 19.pdf
The Economic History of the U.S. Lecture 19.pdfThe Economic History of the U.S. Lecture 19.pdf
The Economic History of the U.S. Lecture 19.pdfGale Pooley
 
Call US 📞 9892124323 ✅ Kurla Call Girls In Kurla ( Mumbai ) secure service
Call US 📞 9892124323 ✅ Kurla Call Girls In Kurla ( Mumbai ) secure serviceCall US 📞 9892124323 ✅ Kurla Call Girls In Kurla ( Mumbai ) secure service
Call US 📞 9892124323 ✅ Kurla Call Girls In Kurla ( Mumbai ) secure servicePooja Nehwal
 
00_Main ppt_MeetupDORA&CyberSecurity.pptx
00_Main ppt_MeetupDORA&CyberSecurity.pptx00_Main ppt_MeetupDORA&CyberSecurity.pptx
00_Main ppt_MeetupDORA&CyberSecurity.pptxFinTech Belgium
 
Log your LOA pain with Pension Lab's brilliant campaign
Log your LOA pain with Pension Lab's brilliant campaignLog your LOA pain with Pension Lab's brilliant campaign
Log your LOA pain with Pension Lab's brilliant campaignHenry Tapper
 
Basic concepts related to Financial modelling
Basic concepts related to Financial modellingBasic concepts related to Financial modelling
Basic concepts related to Financial modellingbaijup5
 
Indore Real Estate Market Trends Report.pdf
Indore Real Estate Market Trends Report.pdfIndore Real Estate Market Trends Report.pdf
Indore Real Estate Market Trends Report.pdfSaviRakhecha1
 
Call Girls Service Nagpur Maya Call 7001035870 Meet With Nagpur Escorts
Call Girls Service Nagpur Maya Call 7001035870 Meet With Nagpur EscortsCall Girls Service Nagpur Maya Call 7001035870 Meet With Nagpur Escorts
Call Girls Service Nagpur Maya Call 7001035870 Meet With Nagpur Escortsranjana rawat
 
05_Annelore Lenoir_Docbyte_MeetupDora&Cybersecurity.pptx
05_Annelore Lenoir_Docbyte_MeetupDora&Cybersecurity.pptx05_Annelore Lenoir_Docbyte_MeetupDora&Cybersecurity.pptx
05_Annelore Lenoir_Docbyte_MeetupDora&Cybersecurity.pptxFinTech Belgium
 
Best VIP Call Girls Noida Sector 18 Call Me: 8448380779
Best VIP Call Girls Noida Sector 18 Call Me: 8448380779Best VIP Call Girls Noida Sector 18 Call Me: 8448380779
Best VIP Call Girls Noida Sector 18 Call Me: 8448380779Delhi Call girls
 
Stock Market Brief Deck (Under Pressure).pdf
Stock Market Brief Deck (Under Pressure).pdfStock Market Brief Deck (Under Pressure).pdf
Stock Market Brief Deck (Under Pressure).pdfMichael Silva
 
Solution Manual for Principles of Corporate Finance 14th Edition by Richard B...
Solution Manual for Principles of Corporate Finance 14th Edition by Richard B...Solution Manual for Principles of Corporate Finance 14th Edition by Richard B...
Solution Manual for Principles of Corporate Finance 14th Edition by Richard B...ssifa0344
 
The Economic History of the U.S. Lecture 20.pdf
The Economic History of the U.S. Lecture 20.pdfThe Economic History of the U.S. Lecture 20.pdf
The Economic History of the U.S. Lecture 20.pdfGale Pooley
 

Recently uploaded (20)

(Vedika) Low Rate Call Girls in Pune Call Now 8250077686 Pune Escorts 24x7
(Vedika) Low Rate Call Girls in Pune Call Now 8250077686 Pune Escorts 24x7(Vedika) Low Rate Call Girls in Pune Call Now 8250077686 Pune Escorts 24x7
(Vedika) Low Rate Call Girls in Pune Call Now 8250077686 Pune Escorts 24x7
 
The Economic History of the U.S. Lecture 22.pdf
The Economic History of the U.S. Lecture 22.pdfThe Economic History of the U.S. Lecture 22.pdf
The Economic History of the U.S. Lecture 22.pdf
 
(ANIKA) Budhwar Peth Call Girls Just Call 7001035870 [ Cash on Delivery ] Pun...
(ANIKA) Budhwar Peth Call Girls Just Call 7001035870 [ Cash on Delivery ] Pun...(ANIKA) Budhwar Peth Call Girls Just Call 7001035870 [ Cash on Delivery ] Pun...
(ANIKA) Budhwar Peth Call Girls Just Call 7001035870 [ Cash on Delivery ] Pun...
 
TEST BANK For Corporate Finance, 13th Edition By Stephen Ross, Randolph Weste...
TEST BANK For Corporate Finance, 13th Edition By Stephen Ross, Randolph Weste...TEST BANK For Corporate Finance, 13th Edition By Stephen Ross, Randolph Weste...
TEST BANK For Corporate Finance, 13th Edition By Stephen Ross, Randolph Weste...
 
Gurley shaw Theory of Monetary Economics.
Gurley shaw Theory of Monetary Economics.Gurley shaw Theory of Monetary Economics.
Gurley shaw Theory of Monetary Economics.
 
Top Rated Pune Call Girls Viman Nagar ⟟ 6297143586 ⟟ Call Me For Genuine Sex...
Top Rated  Pune Call Girls Viman Nagar ⟟ 6297143586 ⟟ Call Me For Genuine Sex...Top Rated  Pune Call Girls Viman Nagar ⟟ 6297143586 ⟟ Call Me For Genuine Sex...
Top Rated Pune Call Girls Viman Nagar ⟟ 6297143586 ⟟ Call Me For Genuine Sex...
 
The Economic History of the U.S. Lecture 19.pdf
The Economic History of the U.S. Lecture 19.pdfThe Economic History of the U.S. Lecture 19.pdf
The Economic History of the U.S. Lecture 19.pdf
 
Call US 📞 9892124323 ✅ Kurla Call Girls In Kurla ( Mumbai ) secure service
Call US 📞 9892124323 ✅ Kurla Call Girls In Kurla ( Mumbai ) secure serviceCall US 📞 9892124323 ✅ Kurla Call Girls In Kurla ( Mumbai ) secure service
Call US 📞 9892124323 ✅ Kurla Call Girls In Kurla ( Mumbai ) secure service
 
00_Main ppt_MeetupDORA&CyberSecurity.pptx
00_Main ppt_MeetupDORA&CyberSecurity.pptx00_Main ppt_MeetupDORA&CyberSecurity.pptx
00_Main ppt_MeetupDORA&CyberSecurity.pptx
 
Log your LOA pain with Pension Lab's brilliant campaign
Log your LOA pain with Pension Lab's brilliant campaignLog your LOA pain with Pension Lab's brilliant campaign
Log your LOA pain with Pension Lab's brilliant campaign
 
Basic concepts related to Financial modelling
Basic concepts related to Financial modellingBasic concepts related to Financial modelling
Basic concepts related to Financial modelling
 
Veritas Interim Report 1 January–31 March 2024
Veritas Interim Report 1 January–31 March 2024Veritas Interim Report 1 January–31 March 2024
Veritas Interim Report 1 January–31 March 2024
 
Indore Real Estate Market Trends Report.pdf
Indore Real Estate Market Trends Report.pdfIndore Real Estate Market Trends Report.pdf
Indore Real Estate Market Trends Report.pdf
 
Call Girls Service Nagpur Maya Call 7001035870 Meet With Nagpur Escorts
Call Girls Service Nagpur Maya Call 7001035870 Meet With Nagpur EscortsCall Girls Service Nagpur Maya Call 7001035870 Meet With Nagpur Escorts
Call Girls Service Nagpur Maya Call 7001035870 Meet With Nagpur Escorts
 
05_Annelore Lenoir_Docbyte_MeetupDora&Cybersecurity.pptx
05_Annelore Lenoir_Docbyte_MeetupDora&Cybersecurity.pptx05_Annelore Lenoir_Docbyte_MeetupDora&Cybersecurity.pptx
05_Annelore Lenoir_Docbyte_MeetupDora&Cybersecurity.pptx
 
Best VIP Call Girls Noida Sector 18 Call Me: 8448380779
Best VIP Call Girls Noida Sector 18 Call Me: 8448380779Best VIP Call Girls Noida Sector 18 Call Me: 8448380779
Best VIP Call Girls Noida Sector 18 Call Me: 8448380779
 
VIP Independent Call Girls in Andheri 🌹 9920725232 ( Call Me ) Mumbai Escorts...
VIP Independent Call Girls in Andheri 🌹 9920725232 ( Call Me ) Mumbai Escorts...VIP Independent Call Girls in Andheri 🌹 9920725232 ( Call Me ) Mumbai Escorts...
VIP Independent Call Girls in Andheri 🌹 9920725232 ( Call Me ) Mumbai Escorts...
 
Stock Market Brief Deck (Under Pressure).pdf
Stock Market Brief Deck (Under Pressure).pdfStock Market Brief Deck (Under Pressure).pdf
Stock Market Brief Deck (Under Pressure).pdf
 
Solution Manual for Principles of Corporate Finance 14th Edition by Richard B...
Solution Manual for Principles of Corporate Finance 14th Edition by Richard B...Solution Manual for Principles of Corporate Finance 14th Edition by Richard B...
Solution Manual for Principles of Corporate Finance 14th Edition by Richard B...
 
The Economic History of the U.S. Lecture 20.pdf
The Economic History of the U.S. Lecture 20.pdfThe Economic History of the U.S. Lecture 20.pdf
The Economic History of the U.S. Lecture 20.pdf
 

Economics survey 2017-18 Notes

  • 1. Notes Economic Survey Vol. 1 2017-18 Prepared by Mr. Krishan PhD Scholar Centre for Development Studies
  • 2. 1 Chapter 1 Overview of Indian Economy 1. GIST 1. Major reforms were undertaken during the last few years. 2. GST – One nation one Tax – 1st July 2017 3. Twin Balance Sheet (TBS) problem, Assets Reconstruction Companies (ARC) were formed, and Insolvency and Bankruptcy Code (IBC) were implement in 2016. 4. Bank recapitalization package was announced – 1.2% of GDP. 5. These reforms will likely to spiral India’s growth trajectory. 6. Expected growth rate 2017-18 = 6.75%. 7. Expected growth Rate 2018-19 = 7-7.5%. 8. However, need to be vigilant about rising oil prices & sudden capital flows. 9. Short term agenda: stabilize GST, complete the resolution on TBS – pass & implement FRDI, private Air India, reduce macroeconomic instability – fiscal correction. 10. Medium term agenda: Employment: youth & women, Education: educated & healthy workforce, and Agriculture: rising farm productivity. 11. However, India must improve climate for sustained economic growth through private investment and exports. 2. Short term: Overview 1. In the first half of current fiscal (2017-18), Indian economy suffered from temporarily “de-coupled” – decelerating as the rest of world accelerated – although it remained second fastest growing economy. 2. The reasons for this decoupling are series of actions & development that buffeted the economy: GST, demonetization, high & rising real interest rate, TBS challenge, and sharp falls in certain food prices that impacted agricultural prices. 3. However, in the second half of the year, the economy witnessed robust signs of revival. Economic growth improved as shocks began to fade. 4. India’s historic macroeconomic vulnerabilities – Fiscal deficit, CAD and inflation were all higher than expected, albeit not threateningly so. 5. Over the coming years, the government will need to focus on 4 R’s (Recognition, Resolution, Recapitalization & Reform) ensuring that the process of resolving the major indebted cases carried to a successful conclusion. 6. The government need to stabilize the GST in its implementation, treatment of exporter, facilitate easier compliance, and expand the tax base. 7. Privatization of Air India. 8. If these objective are achieved, the world economy maintains its growth momentum, and oil prices do not persist at current levels, the Indian economy should resume converging towards its medium-term growth potential which is around 8%.
  • 3. 2 3. Medium term: Overview 1. India has created one of the most effective institutional mechanism for cooperative federalism, the GST council. This “cooperative federalism technology” can be further used to create common agriculture markets, integrate fragmented and efficient electricity markets, solve inter-state water disputes, implemented direct benefit transfer (DBT) and combating air pollution. 2. “Exit” problem of corporate sector has been partly addressed by the introduction of Insolvency and Bankruptcy Code (IBC) in 2016. The recently proposed Financial Resolution and Deposit Insurance (FRDI) bill would do the same for financial sector. 3. Subsidies need to rationalize – through DBT mechanism. Data suggested that household access to basic services (Toilets, power & Housing), financial inclusion – basic bank accounts has shown progress. The strength of these provisioning should be reflected in greater use these services. 4. Historical macroeconomic vulnerabilities – Fiscal and Current A/C deficit – both of which tend to increase when oil prices rises. a. Overcoming the fiscal vulnerability require breaking the inertia of the Tax-GDP ratio. India’s Tax-GDP ratio is no higher than it was in 1980s, despite average economic growth of 6.5%. The introduction of GST will likely to break this inertia. b. Fiscal vulnerability also require halting the steady conversion of contingent1 liabilities into actual ones (typically through the assumption of state discom debts and public sector bank recapitalization), which has impeded progress of debt reduction even in the face of solid growth & apparently favorable debt dynamics. c. Addressing CAD vulnerability requires raising the trajectory of export growth. Reviving the manufacturing and making sector internationally competitive has been the goal of “Make in India” in program, unpinned by a strategy of reducing the cost of doing business. However, the international competitiveness of manufacturing has not made great strides, reflected in the declining manufacturing export-GDP ratio and manufacturing trade balance. 5. Need to have broader policy on corruption, which minimize moral hazard and rent seeking (Corruption in coal, land and environment permits, voluntary default of debt by individuals). 6. Domain of operations of market vs state and private capital vs public institutions should be clearly defined. Unfinished agenda: addressing inefficient redistribution; accelerating the limited progress in delivery of public services especially health & education; and correcting the ambivalence toward property rights, the private sector, and price incentive. 1 Contingent Liabilities of the Government are like insurance obligations, which are contingent or conditional upon the occurrence of certain events, requiring payments by the Government, who had promised or agreed in the past to make good such liabilities, regardless of its financial health. It is a possible obligation and not a present obligation. It arises from some past events and its existence will be confirmed only by the occurrence of some future events. Its time of payment or the quantum of payment or both are uncertain.
  • 4. 1 Chapter 2 India Economy through GST 2.1 Brief overview of GST in India # GST is one indirect tax for whole nation, which makes India one unified fiscal market. GST is a single tax on the supply of goods and services, right from the manufacturer to the consumer. Credits of input taxes paid at each stage will be available in the subsequent stage of value addition, which makes GST essentially a tax only on value addition at each stage. The final consumer will thus bear only the GST charged by the last dealer in the supply chain, with set-off benefits at all the previous stages. ## Salient feature of GST 1. SS based tax as against the current system of mfg. based tax. 2. Destination based consumption tax: Tax would accrue to the State or the Union Territory where the consumption takes place. It would be a dual GST with the Centre and States simultaneously levying tax on a common tax base. The GST to be levied by the Centre on intra-State supply of goods or services would be called the Central tax (CGST) and that to be levied by the States including Union territories with legislature/Union Territories without legislature would be called the State tax (SGST)/ Union territory tax (UTGST) respectively. 3. The GST would apply to all goods other than alcoholic liquor for human consumption and five petroleum products, viz. petroleum crude, motor spirit (petrol), high speed diesel, natural gas and aviation turbine fuel. It would apply to all services barring a few to be specified. 4. An Integrated tax (IGST) would be levied and collected by the Centre on inter-State supply of goods and services. Accounts would be settled periodically between the Centre and the States to ensure that the SGST/UTGST portion of IGST is transferred to the destination State where the goods or services are eventually consumed. 5. Exports and supplies to SEZ shall be treated as zero-rated supplies. The exporter shall have an option to either pay output tax and claim its refund or export under bond without tax and claim refund of Input Tax Credit. 6. Import of goods and services would be treated as inter-State supplies and would be subject to IGST in addition to the applicable customs duties. The IGST paid shall be available as ITC for further transactions. ### Benefits of GST Commented [S1]: Definition: Indirect tax is a type of tax where the incidence and impact of taxation does not fall on the same entity. Description: In the case of indirect tax, the burden of tax can be shifted by the taxpayer to someone else. Indirect tax has the effect to raising the price of the products on which they are imposed. Customs duty, central excise, service tax and value added tax are examples of indirect tax. Commented [S2]: GST is based on Value added principle, i.e. tax on value addition. Commented [S3]: A tax base is a total amount of assets or income that can be taxed by a taxing authority, usually by the government
  • 5. 2 Business and industry Easy compliance: robust IT system which makes registration, returns, and claims on input tax credit easy and transparent. Uniformity in tax rate and structure: it effect ease of doing business positively => by making investment tax neutral irrespective of choice of place. Removal of cascading effect: by providing input tax credit on subsequent stages of production, GST eliminates the cascading effect of taxation. Improved competition: Due to easy compliance => transaction cost will reduce => effect trade and industry. Gain to manufacturer and exporters: subsuming of various taxes on single tax => leads to reduction in prices which in turn provide competitive edge to manufacturers in both the national and international market. Governments Easy to administered: subsuming of all indirect tax into GST combined with robust IT technology makes GST simple and easy to administered at both center and state level. Better control on leakages: Input tax credit combined with robust IT infrastructure => incentivize tax compliance by traders. Higher revenue efficiency: cost of tax collection will likely to reduce by GST. Consumers Single and transparent tax proportionate to the value of goods and services. Relief in overall tax burden: Because of efficiency gains and prevention of leakages, the overall tax burden on most commodities will come down, which will benefit consumers. Commented [S4]: Cascading effect: A tax on tax. Commented [S5]: Revenue efficiency of tax: cost of tax collection/ tax revenue.
  • 6. 3 ###Why is GST so important? The biggest tax reform since independence - GST - will pave the way for realization of the goal of One Nation - One Tax - One Market. GST will benefit all the stakeholders namely industry, government and consumer. It will lower the cost of goods and services, give a boost to the economy and make the products and services globally competitive, giving a major boost to ‘Make in India’ initiative. Under the GST regime, exports will be zero-rated in entirety unlike the present system where refund of some of the taxes does not take place due to fragmented nature of indirect taxes between the Centre and the States. GST will make India a common market with common tax rates & procedures and remove economic barriers. GST is largely technology driven and will reduce the human interface to a great extent. GST is expected to improve ease of doing business in India. #### Which taxes at the Centre and State level are being subsumed into GST?  Centre List o Central Excise Duty o Duties of Excise (Medicinal and Toilet Preparations) o Additional Duties of Excise (Goods of Special Importance) o Additional Duties of Excise (Textiles and Textile Products) o Additional Duties of Customs (commonly known as CVD) o Special Additional Duty of Customs (SAD) o Service Tax o Central Surcharges and Cesses so far as they relate to supply of goods and services  State List o State VAT o Central Sales Tax o Luxury Tax o Entry Tax (all forms) o Entertainment and Amusement Tax (except when levied by the local bodies) o Taxes on advertisements o Purchase Tax o Taxes on lotteries, betting and gambling o State Surcharges and Cesses so far as they relate to supply of goods and services. ##### Chronological events that have led to the introduction of GST  Took 13 years to implement, first discussed in Kelkar task force (2003) on indirect taxes which suggested a comprehensive GST based on VAT principle.  Budget speech of 2006-07, mooted the idea for nationwide adoption of GST by 1st April 2010. Since the stakeholders of GST is not only Centre but States also, therefore, an Empowered committee of States Finance ministers was set up to design to road map of GST.
  • 7. 4  GST involved major overhaul of constitution (required constitutional amendment) constitutional amendment bill 115 was introduced in parliament in March 2011 and referred to standing committee on finance in parliament.  Meanwhile, on 8th Nov 2012, Committee on GST Design’, consisting of the officials of the Government of India, State Governments and the Empowered Committee was constituted.  This committee in their Bhubaneshwar meeting on January 2013 decided on three subcommittees on: (a) Committee on Place of Supply Rules and Revenue Neutral Rates (b) Committee on dual control, threshold and exemptions; (c) Committee on IGST and GST on imports.  Parliamentary standing committee submitted its report to Lok Sabha in August 2013. Most of the recommendations of standing committee and Empowered Committee was accepted and GST Bill was subsequently revised.  Final revised draft of GST bill was sent of EC for further consideration in September 2013. EC once again made certain changes in the draft in its Shillong meeting in November 2013 and send it to standing committee for further consideration.  The 115th Constitutional (Amendment) Bill, 2011, for the introduction of GST introduced in the Lok Sabha in March 2011 lapsed with the dissolution of the 15th Lok Sabha.  In June 2014, the draft Constitution Amendment Bill was sent to the Empowered Committee after approval of the new Government.  Based on a broad consensus reached with the Empowered Committee on the contours of the Bill, the Cabinet on 17.12.2014 approved the proposal for introduction of a Bill in the Parliament for amending the Constitution of India to facilitate the introduction of Goods and Services Tax (GST) in the country. The Bill was introduced in the Lok Sabha on 19.12.2014, and was passed by the Lok Sabha on 06.05.2015. It was then referred to the Select Committee of Rajya Sabha, which submitted its report on 22.07.2015. 2.2 Introduction GST heralded for: One nation One Tax, Expanding tax base, promoting cooperative federalism. However, GST can also provide vast information repositories which enhances our understanding of Indian Economy. Some of finding on the basis of this information are as follows: 1. Large increase in no. of taxpayers, many (especially small enterprises) have voluntarily chosen to register for GST to avail input tax credit. 2. GST base of States is proportional to their respective GDP. Allying fear of loss of tax revenue (because GST is consumption/destination based tax as compare to earlier system which is production based tax). 3. Strong correlation b/w exports by states and their standard of living (measured in term of SGDP). 4. Larger firms in India accounts for much lower % of exports comparatively to similar large firms in ROW. 5. Internal trade is 60% of GDP, which is greater than the estimates of last survey and compare favorably to ROW. 6. India’s formal sector non-farm payroll is substantially greater than currently believed. Formality defined in term of social security => formal non-farm payroll is 31% of non- Commented [S6]: In which both Centre and states government interact and collectively to solve common problem. Commented [S7]: Registration of small enterprises up to certain threshold are not mandatory. They are tax exempted. Commented [S8]: Basically means non-farm employment. Non-farm sectors includes: Dairy, manufacturing, retails, transportations etc.
  • 8. 5 agricultural workforce. Formality defined in term of being of GST net => formal sector payroll is 53%. 7. Size of formal sector (defined as either by social security net or GST net) is 13% of the total firms in private non-agriculture sector. In term of turnover (Sales) is 93%. 2.3 TAXPAYERS 1. As of December 2017, 9.8 million unique GST registrant. Adjusting the base after double, triple counting, the GST has increased the unique indirect taxpayers by more than 50% => 3.4 million. 2. Profile of new filers (3.4 million) => of their total turnover => 34% are B2B transaction, 17% are B2C transaction, and export are 30%. 3. Composition vs Normal GST registration => more and more registrant are choosing to register as normal because to claim input tax credit which is not allowed in composition scheme. 4. Maharashtra, U.P., T.N., Gujrat are the states with the largest no. of GST registrant. 5. U.P., and W.B., saw the largest increase in GST registration. 2.3 TAX BASE AND ITS SPATIAL DISTRIBUTION 1. Discussion on GST centered around two issues: 1. Tax Base and 2. Revenue Neutral Rate (RNR). a. RNR committee (2015) estimated tax base of 68.8 Lakh Crore and GST council estimated tax base of 65.8 Lakh Crore on the base year of 2013-14. Current estimates of tax base are approximately around 65-70 Lakh Crore. b. RNR committee suggested a revenue neutral rate (RNR) of 15-16%. 2. Because GST is mainly consumption based tax as opposed to manufacturing based tax, does it lead to revenue loss to major manufacturing states like Maharashtra, Gujrat etc.? a. Data revealed that state wise share of total GST base is still higher for major manufacturing states. MH 16%, TN 10%, KA 9%, UP 7%, GJ 6%. b. Each state GST base is almost perfectly correlated (0.95) with SGDP => biggest tax base still seems to with major producers states. c. Tax base is more closely correlated with overall GDP (0.95) rather than Mfg (.82). The possible explanation is that the states with strong manufacturing base has also strong services base for Ex. MH, KA etc. therefore their tax revenue remain virtually same. d. Overall, data seems to suggest fairness and balance in GST outcome. 2.4 International Trade, Inter-state trade and Economic prosperity 1. GST database allowed for the first time in history to look at state wise distribution of international export of good and service. MH, GJ, KA, TN, and Telangana account for 70% of India’s Export. 2. SGDP (measure of prosperity) is highly correlated (.70) with Export share in SGDP (for 20 major states). One major outlier is Kerala, likely reason would be remittances. 3. Last yr. survey estimated India’s internal (inter-state) trade of goods was b/w 30-50% based on central sales tax data. GST data suggest that India’s internal trade of goods and services is about 60% of GDP. 4. Interstate Trade: Commented [S9]: Workforce = Employed + unemployed. Commented [S10]: Under old system (VAT) same entity may have obtained multiple registration across different states. Commented [S11]: Mainly on the basis of turnover (sales) => threshold limit. Commented [S12]: Chaired by Arvind Subramanian. Commented [S13]: Need to develop a comprehensive globalization index accounting for remittances.
  • 9. 6 a. Largest Exporters: MH, GJ, HR, TN, KN. b. Largest Importers: MH, TN, UP, KN, GJ. c. Largest trade surplus: GJ, HR, MH, Odisha, TN. 5. Two Questions: a. States which are exporting more are the one which are importing more? b. States which export more are the most competitive and run the largest trade surplus? The answers to both the questions are yes. Correlation coefficient b/w states gross (X+M) and net trade (X-M) b/w is .80. Correlation coefficient b/w states share in export and share in import is .93. 6. Is Internal trade enhances prosperity? The correlation coefficient b/w states trade (X+M)/ SGDP ratio and their GSDP is only 0.49. In conclusion international trade is more likely to be associated with prosperity as compare to internal trade. However, more research is required on this issue. 2.5 Export Superstars: Indian Export Egalitarian Exceptionalism 1. Export Superstars: Firms accounting for disproportionately large share of export. 2. Freund and Pierola (2013) finds that top 1% firms account for more than 50% of export. Further, it is argued that having and fostering bigness influences the sectoral composition of exports and also helps create comparative advantage and improve long term prospects. 3. With GST database it is possible to construct firm level export: Top firms US Germany Brazil Mexico India 1% 55 68 72 67 38 5% 74 86 91 91 59 25% 93 98 99 99 82 Source: Economic Survey 2017-18 Note = Data does not include petroleum & petroleum product for Germany, Brazil, Mexico and India but US 5. One caveat is that India’s data include services export where concentration level is much lower than mfg. 6. The evidence of such an egalitarian export superstars are unclear. It has both the positive (spillover, more competitive etc.) and negative effect (limiting competition). 2.7 Informality of Indian Economy 1. Survey defined formality in two ways: Social security net and GST net. 2. Social security benefits are provided by firms to its employees. In India Govt. provide this for its employees and Employees’ Provident Fund Organization (EPFO) provides it to Private sector employees in respect of pensions and provident funds; and the Employees’ State Insurance Corporation (ESIC) in respect of medical benefits.
  • 10. 7 3. EPFO contributions are mandatory for industries employing >20 workers and whose monthly wages/salaries are less than 15k. Above that contribution are voluntary. 4. ESIC contributions are mandatory for certain firms, employing >10 workers and whose monthly salaries/wages are less than 21k. 5. Second way of defining formality is when firms are part of tax net. This can done using GST database. Notes: MSME amendment act (2015) to change the criteria of classification of MSME on the basis of turnover (sales) as opposed to current classification which is based on investment in plant and machinery for mfg. and investment in equipment for service sector. The criterion of investment in plant and machinery stipulates self-declaration which in turn entails verification if deemed necessary and leads to transaction costs. Turnover (T) in crores Micro T < 5 Small 5 < T < 75 Medium 75 < T < 250 This will encourage ease of doing business, make the norms of classification growth oriented and align them to the new tax regime revolving around GST (Goods & Services Tax). Commented [S14]: 98% opted for provident fund- pension scheme. Commented [S15]: Cabinet approved the amendments but pending in Lok Sabha.
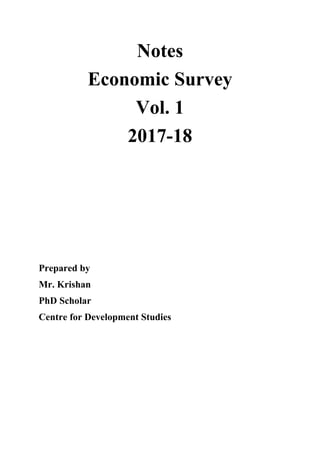
  • 11. 1 Chapter 3 Investment and Savings Slowdown in India Source: WDI. 3.1 GIST 1. S&I peaked in mid-2000s, but after that they both declined profoundly. 2. What are the cross countries experiences and lesson to be drawn for India? 3. Investment slowdown has bearing on growth, but saving not necessarily effect growth. 4. Investment slowdown due to TBS => tends to be slow. However, mean reversion/ automatic bounce back is absent => gradual or slower recovery. 5. Policy should priorities investment revival. Some of welcoming measures are resolution on bad loans and liquidation/recapitalization of private banks. 3.2 INTRODUCTION 1. 8-10% Growth rate => structural reforms + S&I acceleration. 2. Structural reforms such as implementation of GST, resolution on bad loans, bank recapitalization etc. are already taken by govt. of India, now S&I acceleration is required. However, S&I is not unduly depressed, in fact, it remained higher than the 90’s. 3. Mainly due to global commodity boom, S&I rates in India has reached their respective peak in mid-2000, however, decline thereafter, perhaps reaching its normal level in 2017. 0.00 5.00 10.00 15.00 20.00 25.00 30.00 35.00 40.00 1991 1992 1993 1994 1995 1996 1997 1998 1999 2000 2001 2002 2003 2004 2005 2006 2007 2008 2009 2010 2011 2012 2013 2014 2015 2016 2017 India's Saving & Investment rate Gross fixed capital formation (% of GDP) Gross domestic savings (% of GDP) Commented [S1]: See: IBC (2016) and FRDI (2017) Commented [S2]: See: Indradhanush plan/scheme (2015) primarily for bank recapitalization.
  • 12. 2 Years Investment Rate Saving Rate 2003 26.5 29.2 2007 35.4 38.3 2017 26.4 29 Source: ES 2018 4. Such swing in the behavior of S&I have never happened in Indian history – neither in BOP crisis (1991) nor in Asian Financial Crisis (1998). Only other country showing similar pattern of S&I is Brazil. 5. Which sector is responsible for the decline in S&I rate b/w 2007-08 to 2015-16? a. Investment decline (6.3 percentage point) due decline in private investment (5 percentage point) b. Saving decline (7.7 percentage point) due to decline in HH savings (5.2 percentage point) and Govt. savings (4 percentage point). 6. This chapter deals with:  Identifying episodes of S&I slowdown  Studying their patterns  Examine how investment behaves in the aftermath of crisis  Drawing policy lessons. Relationship b/w Saving and Investment a. S = I b. Total savings = public savings + private saving. c. Private saving = Household savings + corporate saving, therefore, d. Total savings = public savings + HH savings + corporate savings = Investment. Decline in HH savings are mainly due to the decline in physical savings (bank deposit) and increasing investment in market driven instrument such as bonds, mutual funds etc. The main reason for this shift is demonetization.
  • 13. 3 3.3 Identifying S&I slowdown In ES, the slowdown are defined using “filters/conditions”. A “short fall” is defined as a. difference b/w average of investment/saving in the slowdown year and subsequent two years b. average of previous 5 years Then a “slowdown” year is defined as one where the shortfall in that year exceeds certain threshold. If there are two or more consecutive slowdown years, this count as “slowdown episode”. Second the average investment rate for the 5 years prior to the slowdown year is at least 15% of GDP. The threshold considered are of 2, 3 and 4 percentage points. As Rodrick (2000) argued that lower the threshold, greater the risk of capturing episodes of temporary voluntary rather than more enduring slowdowns. Also, India’s current I&S slowdown has been so gradual it is best captured in the 2% threshold. Moreover, the results are likely to be hold true for 3 & 4 % threshold as well. Survey has studied the 55 countries, in the effective time span of 40 years (1975-2014), which a sample of total 2200 observations. The results are as follows: 1. At 3% threshold, investment slowdown are more frequent than savings slowdown. This pattern, however, has reversed after 2008, with saving episodes are catching up with investment episodes (increasing savings slowdown episodes). However, both S&I episodes has declined in the latest period, mainly due to concerted effort of global economies to revive growth via stimulus and other policies. 2. The magnitude of investment slowdown is 33% which is significantly greater than the magnitude of saving slowdown which is 22%. (This means investment slowdown are more lasting as compare to saving slowdown). 3. Investment slowdowns are more extreme, as compare to saving slowdown in terms of cumulative magnitude. 4. Both S&I slowdowns are quite frequent in all the countries under consideration, even appearing in China (1998), Singapore (1985, 1999) and Mauritius (1981, 1995, 2012). 5. How does India fit into the broader picture? a. India => special case. India never experienced the S&I slowdown – neither in BOP crisis (1991) nor in Asian crisis (1998), the current episode of slowdown in S&I is first in Indian history. b. Slowdown is most fully detected only in 2% threshold level, mainly because in India, the decline in both the S&I has been gradual unlike sharp adjustment that occur in other countries. c. Inv. slowdown started in 2012 (surpassing 2% threshold) and subsequently intensified (surpassing the 3% and 4% threshold in 2013 and 2014 respectively). The slowdown episode in investment is still ongoing currently it is in 6th years, however, the decline remain gradual. Commented [S3]: Magnitude are shortfalls, cumulated over entire slowdown episode.
  • 14. 4 d. Savings slowdown started in 2010 (surpassing 2% threshold), and also seems to be still ongoing. Owing to data limitations, however, the last year that can be captured as a slowdown year in 2014. e. In conclusion, the current S&I slowdown in India is lengthy and doesn’t seems to over yet. 3.4 Savings vs Investment: Growth consequences Which should be priorities for growth revival? Should policies that boost investment (infrastructure, ease of doing business, Make in India) be given priority over that boost savings? The issue is of relative importance and urgency. However, in the long run, both the S&I are crucial. The standard solution is to boost S & I simultaneously. However, Rodrick (2000) provides evidence that simultaneous push doesn’t necessarily lead to growth. He argued for investment revival which in turn leads to growth and savings. (Savings doesn’t necessarily lead to investment growth). Minsky also accorded the primacy of investment over savings. Therefore, in short run investment need to be priorities. Does similar conclusion hold for India as well? 1. In cross-country analysis, the relationship b/w growth slowdown and investment slowdown is found to be positive. But the relationship b/w growth slowdown and savings slowdown in unclear (not associated with sharp decline in growth). 2. India is above the line of best fit, though not an outlier, suggesting that the impact on growth has been relatively moderate than other comparable countries. 1 percentage point decline in investment is expected to dent growth by 0.4-0.7%. 3.5 Recovery from “India Type” Investment Slowdowns "India Type Investment Slowdown" Unusual: First in Indian History Started from very high peak rate of 36% moderate in magnitute, i.e. gradual decline Long in duration Specific in nature, mainly due to Balance sheet stress. In other word, many companies have had to curtail their investments because their finances are stressed, as investment they undertook during the boom have not generated enough revenues to allow them to service the debts they have incurred.
  • 15. 5 When would be expected recovery from “India type investment Slowdown”? Survey analyses two cases: a. Recovery after balance sheet stress b. Where investment fell by 8.5 percentage points peak to trough over 9 years.  Survey estimated the investment recovery for 11, 14 &17 year after the peak of 2007 (Balance sheet and non-balance sheet recovery).  Investment slowdown from balance sheet problem are more difficult to reverse. Investment remains highly depressed, even after 17 years of peak.  Non-balance sheet slowdown are short and tends to reverse.  India’s inv. decline is unusually large when compare to other balance sheet cases.  Survey analyzed the experience of countries with similar investment decline. And estimated the investment rate of 11, 14 & 17 year after the peak.  There are 30 such cases in the sample. The median country reverses only 25% after 14 year and 40% after 17 year. If India confirm this pattern, Investment- GDP ratio improve by 2.5 percentage point in short run.  However, India has paid moderate cost in term of growth b/w 2007-16 by about 2.3% due to investment decline.
  • 16. 6 3.6 CONCLUSION: LESSONS AND POLICY SUGGESTIONS 1. Investment slowdowns are more detrimental to growth than saving slowdown => Short run policy priority is the revival of investment. 2. Channelize savings via unearthing black money, and encouraging conversion of gold into financial investment. 3. India’s investment slowdown is far from over, however, it has unfolded gradually and its effect on growth are rather moderate. 4. How will investment slowdown reverse, so that India can regain 8-10% growth rate? The answer is both the bleak and hopeful. Due to balance sheet nature of India’s investment slowdown, its reversal seems difficult in the absence of any bounce back mechanism. The deeper the slowdown, the slower and shallower the recovery. At the same time, it remain true that some countries in the similar situation have fairly strong recoveries, suggesting that policy action can decisively improve the outlook. 5. Need to have a clear and urgent policy agenda, GOI is working on this direction; first step-up (increase) in public investment in 2015 and then constraint in public investment to solve TBS. These steps in combination with complementary measures such, providing conducive environment for MSME sector, easing the cost of doing business, and clear, transparent and stable tax and regulatory framework will help in unleashing the “ANIMAL SPIRIT” of India’s corporate sector.
  • 17. 1 Chapter 4 Fiscal Federalism, Taxation and Accountability 4.1 INTRODUCTION 1. Taxation is not just the vehicle of revenue collection. It is also critically important for economic and political development. Besley & Persson (2013) State’s Role To create the conditions for prosperity for all by providing essential services and protecting the less well- off via redistribution. Citizen’s role To hold state accountable when it fails to honor that contract. Taxation is a two way social contract b/w state and citizen. Citizen’s stake in exercising accountability diminishes when  When he does not pay visible and direct taxes and choose to free ride (use service without payment), and cannot complain about poor quality.  When he exit (not using service at all), then he loses his interest in holding state accountable. Only if citizens pays taxes & uses services then he will try to hold state accountable. “NO REPRESENTATION WITHOUT TAXATION” In other word, taxation is a glue that binds citizens to the state in a necessary two-way relationship (Economic Survey 2015-16, Chapter 7).
  • 18. 2 2. Which tax (direct or indirect) bind citizens to be more accountable and responsible? The answer is direct tax. 3. Two international stylized facts about fiscal federalism, taxation, accountability and development: Direct Taxation and development: General (federal) Government For general govt. economic and political development has been associated with a rising share of direct taxes in total taxes. Advanced countries collect a substantially higher share of their taxes as direct taxes than do emerging economies. This proportion has also risen overtime. India has a lower share of direct taxes in total taxes. However, India is not an outlier. Its share of direct tax is similar to other countries at comparable stage of development. However, unlike in other countries it reliance on direct taxes seems to be declining and more so with the implementation of GST. Direct taxation and development: Sub- federal level Survey compares India, Germany and Brazil countries which have 3 tier governance structure. All three countries are similar in their reliance on devolved resources. However, share of direct tax in total tax revenue at state level is 6% in India compared to 19% & 44% in Germany & Brazil respectively in 2016. At 3rd tier, India's rural local govt. (RLGs) stand out on both counts. RLGs reliance on own resources is just 6% compare to 40% in Germany & Brazil. And panchayat raises only 4% of their overall resources in the form of direct taxes, compared with 19% &26 in Brazil and Germany. India's Urban Local bodies (ULGs) are close to international standard. Their own revenue in total revue is higher than both Germany & Brazil. Their direct tax share is 18% compare to 19 % of Brazil and 26 % of Germany. This iimples that India's ULg's are more fiscally empowered. Limitation: Only big/large ULGs are considered for India. Direct Tax  Citizen stake would be greater because it hurt to pay directly.  Direct taxes fee more like expropriation because they reduce citizens’ disposable income, earnings. Indirect tax  With indirect taxes, citizens are burdened but that sense is leavened (weak) to the extent that citizens feel they are exercising choices.
  • 19. 3 4. Is the current system in India appropriate, and if not, can it be changed? This chapter shed light on this question. 4.2 Local Governments: What do we know? 73rd and 74th constitutional amendments recognized panchayat and urban local bodies as institutions of self-government. RLGs or Panchayats were mandated to have three tiers (district, Intermediate and village) in states with the population of 20 lakh. States were mandate to devolve such functions and authorities to RLGs which would enable them to function as institutions of self-governance. Indian constitution also provides the specific list of 29 matters which are the focus of their governance. Such as agriculture and land reform, minor irrigation, small scale industries, rural communication, drinking water, poverty alleviation programme. States are also supposed to constitute quinquennial (5 year) State Finance Commission (SFC) to determine the share of their resources going to local tiers. Over the past two decades, local governments have gained prominence as institutions with substantial say in grass root level development, albeit with significant spatial variations, and space of political contestability. Therefore any policy prescription for the third tier must be based on the understanding of their performance. Some specific facts about local government are as follows: Exp. patterns of various tier of govt.  Central & State govt. spend on an average 15-20 times more per capita than do RLGs.  ULGs spends about 3 times more per capita than RLGs.  The gap b/w spending of various tier of govt. is persisting. From where ULGs and RLGs derive their resources to spending?  ULGs are different: ULGs generate 44% of their total revenue from own sources. RLGs, on contrast, rely about 95% on devolution.  Variation across states: in term of own revenue generation. There are RLGs of states (Kerala, AP, KA) which that collect some direct tax & revenue. On the other hand RLGs of states (UP) almost dependent in devolution. Other Issues  In many states, RLGs & ULGs have not been assigned enough taxation powers. Successive devolution report of Ministry of Panchayati Raj (MoPR) show that the share of revenue assigned to local bodies in many states as much less vis-à-vis exp. assignment.  Despite the formation of FC by most states, it recommendation has been adopted by few only. With Kerala being exception accepting 100 % recommendation.
  • 20. 4 4.3 State vs Local Government performance: A common answer is that higher levels especially at the states have not devolved enough taxation powers to panchayat. For example, the permissible taxes for panchayats include property taxes & entertainment taxes but not land taxes or toll taxes (except local panchayat roads). Why is the own revenue collection, especially from direct taxes, so poor for both the state & local government? Given their powers to tax, how have state & local govt. performed? And have they collected revenue close to the potential? These questions has been analyzed for property taxes which include land, house, building & property taxes. a. Land tax is assessed & collected by state. b. Building tax including property/house tax collected by municipality & gram a. Land tax vis-à-vis potential: States Survey estimated actual & potential revenue from land tax. The stark finding is that states collect a small fraction of their potential. An all India average of 19% if unreasonable low value of land is assumed & about 7% on more realistic land value assessment. b. House tax vis-à-vis potential: RLGs Survey estimated actual & potential revenue from land tax. Even in the states viz. Kerala and Karnataka that are ahead of others in devolutions of powers to RLGs, the collection vis-à-vis potential is only around 1/3. All these are upper bounds on tax collection vis-à-vis potential given the lack of data on commercial property taxes.
  • 21. 5 In conclusion, it can be said that local tier of government is not performing well because they are not utilizing their tax potential rather than limited taxation power. 4.4 Conclusion: A low Equilibrium trap? 1. State & local govt. in India do not conform to the cross trends on own tax revenue & direct taxes. Indian state & local govt. rely more on devolution and less on own tax revenue and generate very low direct tax. => The reason for this is not the limit power of taxation but rather a much bigger problem of underutilization of tax potential. Is undercollection a matter of capacity/ resources/ expenditure/ effiency? Is the problem a potential unwilling to tax by state, stemming possibly from very proximity b/w state & citizens upon which decentralization is promised? Is the problem a potential unwilling to tax by state, stemming possibly from very proximity b/w state & citizens upon which decentralization is promised? There is another possibility. the status quo can be an equilibrium desired by all actor with higher tier (both centre & states) using their devolution powers to control & influence lower level; and the later, unable and unwilling to tax their proximate citizens, need outside resources even if they are not always untied. This is called a "LOW-EQUILIBRIUM TRAP" Why this is so? In context of growing decentralization of economic & political power, how to break this equilibrium is one of the more pressing issue confronting fiscal federalism.
  • 22. 6 2. Broader challenge - afflicting all tier of government - in the limited ability to collect direct taxes. Given the quality of public service delivery, such taxes are often viewed as a “tribute" to a state rather than a contribution to and acknowledgement of the state in raising the quality of life (Aiyar & Pritchett, 2015). On consequence of this is that the exit of middle class to more privately-provided services (safety, health & education) that only serves to exacerbate the problem. Self-reinforcing cycle Breaking this self- reinforcing cycle is perhaps at the heart of the governance challenge. Inadequate delivery of public services Low direct collection Weak Accoutability
  • 23. 1 Chapter 5 “Late convergence Stall”: Can India escape? 5.1 GIST 1. Developing countries are living in the time of unprecedented prosperity (economic growth) and that is true for India as well which emerged as one of the most dynamic economic performer in the world. 2. This is mainly due to economic “CONVERGENCE” => poorer countries have grown faster than the richer countries and closed the gap b/w the two in term of standard of living. To quote Subramanian (2011) there has been a “CONVERGENCE WITH VENGENGE”. 3. Convergence process has been broadening (no. of countries growing faster than US = the benchmark country) and accelerating (average excess growth rate over US = the benchmark country) for last 20-30 years. 4. However, there are possibility of late convergence stall due to four horseman/headwinds that emerged after the global financial crisis of 2008, leaving countries into middle income trap. Can India escape and become middle income country from its current status of lower-middle country? 5. Four Horseman/Headwinds are: 5.2 INTRODUCTION 1. Best economic time for humanity especially for these living in poorer regions. The global “BAD” such as war, famine, violence, deprivation and poverty are at all-time low. Whereas the global “good” such as standard of living, access to essential services, and material wellbeing etc. are at all-time low. This is particularly true for India which emerged as one of most dynamic economy since 1980. 2. The rise of global “good” is mainly driven by “convergence” process which states that poorer country tends to grow faster and catch up with rich counterparts in terms of standard of living. 3. From 1980-2017, the convergence process has been both broadening (68.6% countries in the sample of 153 has grown faster than US = the benchmark country) and accelerating (with the average excess growth rate of 1.7% over US = the benchmark country). 4. During the same period, India too has moved upward in hierarchy of development. From being low income country in 1960 to lower middle country in 2008. Protectionism: that reduces trade opportunities Thwarted Structural transformation: shift from less to less productive sector Human Capital regression: Growing demand from Knowledge Intensive sector. Climate change induced agriculture distress. Commented [S1]: After Global Financial Crisis of 2008, when the economic growth economy tumbles. Commented [S2]: Based on biblical story which symbolize the arrival of evil.
  • 24. 2 5. But, recently doubts about the convergence process have been articulated along the notion of “MIDDLE INCOME TRAP” “Middle Income Trap”: Middle income countries would grow more slowly than what would be expected given their level of income (i.e. slower than richer countries), impending the transition from middle income to higher income status. Reasons for Middle Income Trap/ Stall a. As countries attained middle income status, they squeezed out of MFG. and other dynamic sectors by poorer, lower-cost competitor. b. Lack the institutional, human & technological capital to move them up higher in the value chain ladder. Pushed from below & unable to gasp the top: trapped in middle.  There is neither a middle income trap nor stall. Middle income countries as a group continued to grow as fast as or faster than the convergence standard demanded (Survey).  Even after the GFC (2008), i.e. late convergence, the convergence process is actually accelerating. Growth rate: poorer countries > lower middle income > upper middle income > richer countries
  • 25. 3 6. Since, India is late converging country i.e. attempting to converge after the GFC of 2008, its prospect of transition from lower middle to middle income status is gloomy. The GFC of 2008 thwarted the global growth of all countries. Underlying these slowdowns are some are major developments that could not only damage growth over long the long term, but eventually even slow the process of convergence. These are discussed in the next section. 2.3 Four Horseman/ Headwinds 1. Hyper globalization repudiation a. Early converging countries (Such as China, Korea, Japan etc.) benefitted from hyper globalization, however, later converging countries now faces altogether different trading environment. After GFC 2008, there is a backlash against free trade which is reflected in the declining world trade to GDP ratio. => DIMINSHING EXPORT OPPORTUNITIES. 2. Thwarted Structural Transformation a. Successful development requires two kind of structural transformations 1. Shift of resources from low to high productive sectors (Lewsian Transformation) 2. Larger share of resources devoted to more dynamic sector which has potential for rapid productive growth. b. c. Rodrick (2015) identifies manufacturing as a most critical/ dynamic sector which has potential of unconditional convergence and successful transformation. This is main reason why “PRE-MATURE DE-INDUSTRIALIZATION” – tendency for manufacturing in the late converging countries to peak at low productive sectors. In many cases, the resources doesn’t shift in above mentioned ways. They shift instead from informal, low productivity sectors to ones that are marginally more productive/informal. This is called thwarted structural transformation. Are late converging countries particularly vulnerable to thwarted transformation?  Survey analyzed the good growth sector in which labor share increases along with productivity growth (manufacturing, telecom, finance & professional services etc. and bad growth sectors (hotels, transportation, restaurant etc.)  For both India & China, the share of good growth sector in overall growth is declining, especially after GFC of 2008. This is a matter of concern.
  • 26. 4 3. Human Capital Regression a. One key difference b/w early convergence based on mfg. & late convergence against the strong headwind of automation & globalization backlash is Human Capital. b. In early convergence countries, industrialization fueled demands for unskilled & semiskilled worker that allowed structural transformation of Lewisian type (from farm to factory). However, late converging countries are challenged by growth of knowledge economy which required highly skill workforce. c. In other word, there is shift in the determinant of growth from labor based comparative advantage in early convergence to absolute human capital attainment in late convergence. 4. Climate change-induced agricultural stress a. For later convergers, agriculture productivity is critical not just for feeding people but for ensuring human capital accumulation in those who move from agriculture to modern sector. b. Survey estimated that rainfall shock & climate change induced temperature rises will lead to 20-25% decline in revenues in non-irrigated regions in India. 2.5 Notes 1. Learning poverty count (LPC) measures the no. of children who do not meet the basic learning benchmark. 2. Learning poverty gap (LPG) measures how far each student is from this benchmark performance. Annual survey of educational attainment (ASER) does the periodic assessment of LPC & LPG.
  • 27. Chapter 6 Climate change & Agriculture 6.1 GIST 1. This chapter examined the long term trend of rising temperature, declining average precipitation & increase in extreme precipitation on India agriculture using district level data. 2. One significant finding the threat of climate change exert its influence on extreme i.e. in case when temperature is much higher than normal, rainfall significantly lower & no. of “dry days” greater than normal. 3. Second significant finding is that the effect of climate change are more adverse for unirrigated areas (rainfed crop). 4. The projected long term weather patterns implies on an average, agriculture incomes are likely to decline up to 15-18% and up to 20-25% in the unirrigated area. 5. To minimize the loom of climate change there is need of extension of irrigation to non-irrigated region especially in the form sprinkler & drip irrigation which are more water saving & efficient. In addition to that the untargeted power & fertilizer subsidies has to done away with more cereal centric subsidies in the form of DBT. 6.2 INTRODUCTION  Why Agriculture in India matters?  Why agriculture cannot be permanent/ dominant source of livelihood in India? For economic reasons because it still account for a 16% of GDP & 49% of total employment.  Because agriculture is subject to diminishing returns & hence the living standards it sustains can approach – those in mfg. & services.  Economic development is always & everywhere about getting people out of agriculture and in relative terms it is getting less important for GDP & employment (Lewis 1954). However, this should happen along with the rise in agriculture productivity so that it could support industrialization & urbanization.  For social concerns raised by Dr. Ambedkar => village is sinking ship of localism, a den of ignorance, narrow mindedness, and communalism. t
  • 28.  How has the Indian agriculture performed in the long run (1960-2017)? Growth  Real agriculture growth since 1960 has been averaged about 2.8% in India.  In comparison to India, China’s annual agriculture growth has exceeded that of china by a substantial 1.5 percentage point. Variability  Volatility of Indian agriculture has declined substantially overtime. From a standard deviation of 6.3% b/w 1960-2004 to 2.9% since 2004.  The reasons high volatility is vagaries of weather => 52% (73.2 million hectare area of 141.4 million hectares net sown area) is still un-irrigated and rainfed.
  • 29. Against the mentioned background, this chapter pursue three objectives  Document the changes in temperature & rainfall over the past six decade  Estimate the effects of fluctuations in weather (temperature & rainfall) on agriculture productivity.  Use these short run estimates in conjunction with predicted changes in climate (long term patterns of weather –temperature & rainfall) over the long run to arrive at estimates of the impact of climate change on Indian agriculture. All these analyses has been done using IMD database of precipitation & temperature and district level on crop production. 6.3 Temporal (Time) & Spatial (Space) Patterns of Temperature & Precipitation India's crop year starts from July to June, a dictinction usually followed in north & interior India. In south India, this distinction is not followed because temperature remain high enough to plant the tropical crops through out a year. Summer Crop/Zaid March to June Crop sown b/w kharif & rabi Mainly for ancillary crop & fodder which are of short duration. Kharif Crop July to october It depend on south- west mansoon. Hence also called mansoon crops. It facilitate the tropical crop. Major crops are: Rice, Cereals, Maize, Pulses etc. It is the most important agriculture season in India. Rabi Crop October to March This season is called winter season of cropping. Mainly depend on northeast mansoon. Low temp. facilitates the cultivation of temperate & subtropical crop Major crops are: Wheat, Barley, Oats, chicpear/gram, mustard etc.
  • 30. 1. TEMPORAL PATTERNS 1. Since 1970s, there has been a general pattern of rising temperature in both the cropping seasons viz. kharif & rabi.  The broad pattern of rising temperatures post 1970s is common in both the cropping seasons.  The average increase in temperature b/w the most recent decade & 1970s is about 0.45 degree & 0.63 degree in kharif & rabi seasons respectively. And are consistent with other research. 2. Since 1970s, there has been a general pattern of declining precipitation in both the cropping seasons viz. kharif & rabi.
  • 31.  Between the 1970s & the last decade, kharif rainfall has declined on average by 26 millimeters & rabi rainfall by 33 millimeters.  Annual average rainfall for this period has on average declined by about 86 millimeters. 3. Since 1970s, there has been a general pattern of rising number of extremely hot & cold days (temperature extremity)  Hot days are defined as days with temperature greater than the 95th percentile of the grid- point specific temperature.  Cold days are defined as days with temperature less than 5th percentile of the grid-point specific temperature  Above figures are suggestive of rise in the no. of days with extremely high temperature, and correspondingly a decline in the no. of days with extremely low temperature. 4. Since 1970s, there has been a general pattern of rising no. dry & wet days (precipitation extremity).
  • 32.  Dry days are defined as days with rainfall less than 0.1 mm per day.  Wet days are defined as days with rainfall greater than 80mm per day.  Above figures clearly suggestive of rise in no. of dry days with extremely low & wet days with extremely high precipitation. 2. SECTORAL PATTERNS 5. The pattern of average increase in warming is clearly visible in India in large extent.  Pattern of average increase in warming is completely visibly as part of the map is covered with red.  The worst effected states are North-East, Kerala, Tamil Nadu, Rajasthan and Gujrat.  The least effected states are Punjab, Uttar Pradesh and Odisha.
  • 33.  The pattern of extreme precipitation is clearly visible in India as some states are getting more rainfall than average and some are getting less rainfall than average.  Extreme deficiencies in rainfall are more concentrated in Uttar Pradesh, North- East, Kerala, Chhattisgarh, and Jharkhand.  There is actually increase in precipitation in Gujrat, Odisha and Andhra Pradesh. 6.4 Impact of weather (temperature & rainfall) on agricultural productivity The concerns of climate change are most likely to be felt by developing, hotter and less rich countries. India being developing countries is part of torrid/tropical part of world which is usually hotter than other parts and also hugely dependent on agriculture. Therefore, a meaningful analysis is required to understand the impact of weather changes on agriculture.
  • 34.  TWO KEY FINDINGS Gggggggggggggggggggggg  dd  What are the varied susceptibility of different crops (yields) to temperature & precipitation? Extreme vs Moderate Shock  Impact of temperature & rainfall shocks are highly non-linear and felt almost only when temperature increases and rainfall shortfall are extreme. Irrigated vs non-irrigated  These extreme shocks have highly divergent effects between irrigated or unirrigated area (districts where less than 50% of cropped area is irrigated).  Unirrigated or Rainfed crops are twice more likely to be adversely affected as compared to irrigated crops.  A large literature focuses on the impact of a one unit increase in temperature or a unit decrease in rainfall on agriculture productivity.  Survey’s analyses show that, in Indian context, such marginal changes in weather (temp. & rainfall) have little or no impact, and that the adverse effect of weather are concentrated in extreme,  Crops that are grown in rainfed areas-Pulses in both the kharif & rabi season are vulnerable to weather shock. For example: soya, chickpeas, pearl miller, line seed etc.  Cereals viz. both wheat & rice are relatively more immune.
  • 35. 6.5 Impact on Farm Revenue  What do these no. imply to farmer loses in short & long run?  On average, extreme temperature shocks reduces farmer incomes by 4.3% and 4.1% in kharif & rabi seasons respectively, whereas extreme rainfall shocks reduces farmer income by 13.7% & 5.5 % in karif and rabi respectively.  However, average hides more than what it reveal. Largest impact of extreme weather shocks being felt by unirrigated regions.  Ex-ante it is not clear where will farm revenue go in long run because- on the hand it will reduce the yield (reducing supply) and on the other it will increase the price (due to reduction in supply). However, survey’s analyses show that the “Supply Shock” due to reduction in yield lead to reduced revenue.  Survey estimated that in the absence of major policy change and adoption by farmers, farm income will be lower by 15-18% on an average in the coming years (long run). Unirrigated areas are most severely affected, with potential losses amounting to 20-25%. 6.6 Conclusion & policy implication  Conclusion 1. Impact of rainfall & temperature is felt only in extremes- when temperatures are much higher, rainfall significantly lower, and the no. of “dry days” greater than normal. 2. The impacts are significantly higher for unirrigated regions (rainfed crops such as pulses) compare to irrigated regions (cereal crops such as rice & wheat).
  • 36. 3. In the long run climate change will induces agriculture distress in India. On an average, farm income is likely to be decline by 15-18%, rising to 20-15% for unirrigated area. This translate into Rs. 3,600 per year for median farm household.  Challenges & Policy suggestions 1. Indian need to expand the irrigation and this has to done in the backdrop water scarcity i.e. declining ground water level. Total irrigated area has increased from less than 20% in 1960s to mid-40s in 2017. However, there remain region disparities in the spread of irrigation in India. Indo-Gangetic plains, and parts of Gujrat & MP are well irrigated, whereas parts of KA, MH, MP, RJ, CH, and JH are still extremely vulnerable to climate shocks. a. Irrigation expansion has to be done in the backdrop of water scarcity. Aeschbach (2012) hinted that India pump ground water twice more than china. Since most of irrigation projects in India are based on ground water, therefore the problem of depletion of groundwater level is more acute in well irrigated states, especially in North-India. In fact, in North-India the ground water has decline by 13% in last 30 years. b. Need of the hour in India is to spread the irrigation to mitigate the climate related volatility that too in the presence of water scarcity in such way to ensure higher water use efficiency. The spread of irrigation should be done by micro/ small/ mini irrigation projects that doesn’t much water and also preserve associated bio-diversity, livelihood and local habitation. In addition to spread of modern irrigation technology viz. sprinkler & drip irrigation- “MORE CROP PER DROP” can lead to drastic improvement water is use efficiency. Though costly, these technologies will likely to Fully irrigating Indian agriculture against the backdrop of water scarcity i.e. declining ground water table. Water-Power Nexus:- issue of power subsidies. Embracing agricutural science & technology with renewed ardour to tackle emerging agricutural issue such as climate change impact, pest & crop disease. To mitigate the uncertainty of weather - effective insurance scheme should be devised based on weather based model & technology such drones. For policy making, there should be clear understanding of India agriculture whihc is vastly heterogenous i.e. needs norther states wouold be different from central or southerns states.
  • 37. reduce social cost of production (accounting for water & electricity damage) in Indian agriculture. The government of India should promote, subsidies as well as incentivize farmer to use technologies. 2. The nexus between power and water overuse has to be break. Due to this nexus both these sector are in distress. A “vicious circle of negligence” is operating in Indian agriculture mainly due distorted market price of resources. The virtually free electricity to farmer leads to overuse of water pump which lead to reduction in water level reduction. a. To tackle this water-power nexus, strong political will is required especially at state level because both agriculture & power are state subject in Indian constitution. Sadly, farmers are the strong & major vote bank for state governments, any reformative step will have repercussion in election result. 3. The agriculture science and technology need to embrace with renewed ardor to tackle the emerging agriculture related issues such as climate change related impacts, and pest & crop disease. 4. Indian agriculture is subject of uncertainties of various types. To hedge against these uncertainties and protect to farmers, an effective insurance system is required which does the quantification of risk/uncertainties, discovering effective premium rates and ensure quick, timely, transparent and effective delivery mechanism. The introduction of PRADHAN MANTRI FASAL BIMA YOJNA in January 2016 is a welcome step in this direction. The necessary step forward is to use modern drone/weather based technology to forecast uncertainties & then effectively devising premium rates. 5. Finally, in the policy making it should be clearly acknowledged that Indian agriculture is heterogeneous across the country. a. In fact, there are two agricultures in India. There is an agriculture which is well irrigated, input addled, and price & procurement supported cereals grown in northern India – where the challenge is do away with power & fertilizer subsidies and implement less damaging DBT. b. Then there is other agriculture (broadly non-cereals in central, western and southern India) where the problems are very different:” inadequate irrigation, continued rainfed, ineffective procurement, and insufficient investments in R&D (non-cereals such as pulses, soya beans, and cotton), high market barriers, and weak post-harvest infrastructure (fruits & vegetable), and challenging non-economic policy frame work (livestock.) 6.7 Notes
  • 38. 1. Shah Committee (2015) on water  High powered committee set up by government in September 2015 and it was headed by Mihir Shah  Objective: To ensure the development of water resources in country.  Submitted its report titled “21st Century Institutional Architecture for India’s Water Reforms: Restructuring the CWC and CGWB”  Committee has recommended a complete overhaul of current management system including Central Water Commission (CWC) and Central Ground Water Board (CGWB) to face the new emerging challenges.  Recommended the establishment of National Water Commission (NWC) as an apex institution dealing with development, policy, data and governance. 2. Swaminathan committee (2004): National Commission on Farmer  Committee was constituted on 2004 and head by MS Swaminathan, an eminent agriculture scientist.  Submitted 5 reports b/w 2004-06.  5th report – specifically deals with farmer distress & suicide and recommended a holistic national policy for farmer.  Findings and recommendations mainly focused on issues of access to resources and social security entitlements.  It contains suggestions for inclusive growth of farmers and agriculture sector in India.  It is aimed at working out a system for food and nutrition security, sustainability in the farming system, enhancing quality and cost competitiveness of farm commodities and also to recommend measures for credit and other marketing related steps.  MSP should be at least 50% more than the weighted average cost of production. The “net take home income” of farmers should be comparable to those of civil servants.  However, most of the recommendations in the reports of National Commission on Farmers are not yet implemented. 3. Pradhan Mantri Fasal Bima Yojna (2016)  PMFBY replaced the National Agricultural Insurance Scheme (NAIS) and Modified National Agricultural Insurance Scheme (MNAIS). PMFBY is designed to reduce the burden of crop insurance on farmers.  The Weather-Based Crop Insurance Scheme (WBCIS) remains in place, though its premium rates have been made the same as in PMFBY.  State governments have the authority to decide whether they want PMFBY, WBCIS or both in their respective states.  The new Crop Insurance Scheme – PMFBY- is in line with ‘One Nation – One Scheme’
  • 39. 1 Chapter 7 Gender & Son meta-preferences: Is development itself an antidote? 7.1 Introduction At this juncture of development, it is critically important to ask, how is India faring & how much progress has been made toward women empowerment? Is India the land of the empowered or the helpless/oppressed women? EQUALITY VS EQUITY 1. Gender equality is desirable because it has significant economic & social gains. a. There are growing evidence that there can be significant economic gains if women acquire agency i.e. role in decision making, assume political & public spaces and participate in labor force. In developing countries, especially in India, women labor force participation is very low, which required a corrective measure. According to IMF research, women labor force participation to the level of men will boost India GDP by 27%. b. Working women will likely to invest more in children education, hence inducing human capital formation. 2. How responsive is gender quality to development?
  • 40. 2 a. Methodological issue: Development time vs Chronological time b. Gender Index such as the Global Gender Gap Index1 of World Economic Forum (WEF) or Gender Inequality Index2 of United Nations Development Program (UNDP) ranks countries in chronological time. However, such simple cross-sectional comparisons are prone to potential flaw. c. The role of women evolves with development. Scandinavia in the early 1900s was demonstrably less well-disposed to women than the Scandinavia of today. Therefore, accounting for the level of development is must for any kind of meaning comparison. d. Survey intended to correct this by introducing a novel notion of “development time” as opposed to chronological time which is used by most of the Gender Index. To answer this question, survey has done two kind of assessment:  LEVEL: How did India fare on the set of gender outcomes relative to the developing countries in the late 1990s/early 2000s and in the most recent period 2015-16, controlling for the level of development?  CHANGE: Is there any kind of convergence effect? That is, are gender indicator more responsive to household wealth in India than in other countries? 3. Gender equality is an inherently multi-dimensional issue. Survey has explored the gender equality into 3 dimension and 17 variables. a. Agency: related to women’s ability to make decisions on reproduction, spending on themselves, their household and their own health & mobility. b. Attitude: related to attitudes about violence against women/ wives, and the ideal number of daughters preferred relative to no. of sons. c. Outcomes: related to son preference (measured by sex ratio of last child), female employment, age at first childbirth, and physical or sexual violence experience by women. Data used for this analyses is based on the Demographic and Health Survey (DHS) database from 1980-2016. The survey has datasets at household level; both women & men are asked detailed questions on gender related attitudes, agency, and outcomes, among other issue. The National Family Health Survey (NFHS), which feeds into survey, has been with international DHS datasets. 1 Global Gender Gap Index: In 2017, India ranks 108 in the list of 144 countries. Its rank actually slips drastically from 87 in 2016 to 108 in 2017. This slip happened due to low female labor participation & wages. Both Bangladesh & China ranks ahead of India. Their ranking in 2017 are 47 & 100 respectively. 2 Gender Inequality Index: In 2015, India ranks 125 in the list UN member coutries.
  • 41. 3 7.2 FINDINGS: Results has accounted for wealth difference across countries 1. LEVEL: INDIA’s Performance
  • 42. 4 a. On 12 out of 17 variables, average levels in India have improved overtime. b. On 7 out of these 12 cases, India performs better than, or at par with the cohort of other developing countries even after accounting for levels of development. c. India has some distance to traverse on several dimensions (10 out of 17) to be on with par other countries in development time. one such example is use of reversible contraceptive => women have little control over when start reproduction, but only seems have control when they seem to have control over when they stop having children. This could possibly effect their prospect of labor market participation. d. However, the major worrisome dimension is declining labor force participation be females, from 36% in 2005-06 to 24% in 2015-16. The long list of literature document this phenomena. Goldin et al. (1995) documented a U-shaped behavior of female labor force participation with rest to development. India is on the downward part of the “U” but even more so than the comparable developing countries.  REASONS FOR LOW FEMALE LABOR FORCE PARTICIPATION IN INDIA h e. Sex ratio at birth is biased against women & is low by 9.5 percentage point s in 2015-16 in comparison to other countries. And this has remained stagnant in the last decade. The primary reasons for this is sex-selective of female fetus. On the supply side, rising incomes of men allows Indian women to withdraw from the labor force, therefore avoiding the stigma of working; higher education levels of women also allow them to pursue leisure & other non-work activities all of which reduce female labor force participation. (Bhalla & Kaur, 2011; Kapsos, 2014; Klasen, 2015). On the demand side, the structural transformation of Indian agriculture due to farm mechanization results in a lower demand for female agricultural laborer (Chatterjee et al. 2015; Mehrotra et al. 2017 Other reasons, insufficient availability of type of jobs that women preferred specifically – regular, part-time jobs which provide them steady income & allow women to reconcile Household duties with work (Kannan & Raveendran, 2012). This can interact with safety norms, caring children, elders & household work.
  • 43. 5 2. CHANGE: Is there a convergence effect? – India’s performance relative to other countries. The assessment undertaken is at the household level to see if greater gender related indicators improve with wealth both in India as well in other countries.
  • 44. 6 In above table, the column shows the impact on the relevant gender indicator of one standard deviation increase in wealth in the typical country in sample. For example, row 1 indicates that if wealth increase by one standard deviation in the average country, the no. of women involved in decision making on their health increase by 5.5 percentage points. Column 2 shows that in India, the no. of women having agency on heath matters increases by further 4.7 percentage point for one standard deviation increase in wealth. Column 3 shows the overall effect in India, in this case 10.2 percentage point increase in wealth.  Key finding is that in 15 out of 17 cases, gender indicators are more responsive to wealth in India which is similar to typical countries. This suggests that even if India is lagging in development time, it can expect to catch up with other countries as household wealth increases.  Two notable cases where the convergence effect is not visible and India appear to be lagging behind in development time is on women employment and sex of last child. 3. Performance of Indian states: relative to each-other & to their level of development. a. In the score of hundred, scores of all the states except Delhi has increased from 2005- 06 to 2015-16. This underscore the earlier results that there is an improvement overtime in gender equality. b. There is also a “convergence” effect in the poorer performers in the earlier period improve their score overtime. c. Most North-Eastern states (except Tripura & Arunachal Pradesh) and Goa occupy the North-East quadrant, are the best performers at all point of time. Kerala is the next best performer. d. The lagging performers are Bihar, Rajasthan, MP, UP, JH, and AP. e. Delhi’s performance actually worsens in a decade, and it fall having highest in 2005- 06 (down from 73 in 2005-06 to 70.9 in 2015-16. f. In developmental “time frame work” state have much better scores given their level of income. The states like AP, Haryana, Bihar, and TN performed less well given their level of income. 4. Son preference: Skewed Sex Ratio at Birth (SRB)  Issue relating to son preference are a matter for India society as whole to reflect upon. Sex Ratio at Birth (SRB) Males per 1000 female YEAR INDIA CHINA 1970 1060 1070 2014 1108 1156 India Year Sex Ratio of total population Child Sex Ratio (0- 6 age group) 2001 933 927
  • 45. 7  Overtime SRB has declined for both India & China.  The biologically determined SRB is 1.05 males per females. Any significant deviation from this is on account of human intervention specifically female child specific sex-selective abortions.  China’s skewed SRB is mainly due to one child policy adopted in 1970s which interacted with strong preference for male child.  From 1991 to 2011, there is a general upward drift in SRB across in Indian states => worsening with development. Most striking is the performance of Punjab & Haryana where the child sex ratio is approaching 1200 males per 1000 females, even though they are rich states.  Sen (1990) documented the skewed sex ratio of females to males, estimated that nearly 100 million women were missing in the world (almost 40 million is India alone). A large part of this driven by a combination of sex selective abortion & neglect of girl child after birth.  Anderson & Ray (2014) update the no. of missing women. In 2014, there were nearly 63 million missing women and more than 2 million go missing in every year. 5. Son “Meta” preference: sex ratio of last child (SRLC) and “Unwanted Girls”  SON “META” PREFERENCE: Parent may choose to keep having children until they get desired no. of sons.  This type of preference doesn’t lead to skew child sex ratio, but remained detrimental to overall development of girl child (Jayachandran & Pande, 2017).  A different measure is required to detect such “meta” preferences. One indicator is sex ratio of last child (SRLC).  A preference for sons will manifest itself in the SRLC being heavily skewed in favor boys. 2011 940 919
  • 46. 8  Meghalaya stands out as an ideal state because both SRB & SLRB are close to benchmark. States in circle 2 and 3 such as Kerala, TN, etc. do not seem to practice sex selective abortions (sex ratio are closer to biological rate) but do indicate son “meta” preference (skewed SLRC). Punjab & Haryana, on the other hand, exhibits very high son preference & “meta” preference (SLRC> Ideal SLRC & SRB> Ideal SRB).  Intuitively it implies that families where son is born are most likely to stop having children than families where a girl is born. This is suggestive of parent employing “stopping rules” – having children till a son is born & stopping thereafter. The only exception to this pattern is with regard to the first child. Even parents who have their first born as son are likely to continue having children, which reflects a pure family size preference- Indian parents, on average want at least two children.  Jaychandaran (2015) lists a no. of reason for such son preference, including patrilocality (women having to move to husbands’ house after marriage), patrilineality (property passing from father to son), dowry (which leads to extra costs of having girls), old age support & ritual performed by sons.  Such “meta” preference give rise to “unwanted girls” – girls whose parented wanted boys but instead had a girl. Survey presented first ever notional estimates of “unwanted girl” in India which is 21 million. This is calculated as the gap b/w benchmark sex ratio & the actual sex ratio among the families that do not stop fertility. 7.3 Conclusion 1. There has been significant improvement in the majority of gender related indicators from 2005-06 to 2015-16. This holds true even after accounting for development level.
  • 47. 9 2. However, several dimension especially use of reversible contraceptive, employment & sex-ratio has some distance to traverse to catch up with other countries because development on its own has not proved to be an antidote. 3. Encouragingly, gender patterns are converging with development comparable to other countries. Therefore, now as India seems to lagging but expected to catch up later. 4. Significant heterogeneity across Indian states: North-Eastern States consistently outperformed other states, despite low level of development. 5. Because challenge is long and requires attitude & behavioral change – all the stakeholders viz. family, society, civil society, communities, & state need to work on comprehensive & cooperative manner for gender empowerment. 6. Scheme such as “BETI BACHAO BETI PADHAO” and “SUKANYA SAMRIDHI YOJNA” are welcome step in this direction. However, first responsibility & duty lies within the doors of families, society & community. 7. Recently amended maternity bill (2017) which mandates 26 weeks of maternity leave for women in both public & private sector alongside crèche facilities for children is needed to implement vigorously. 7.4 Notes 1. BETI BACHAO BETI PADHAO SCHEME (2015) a. Scheme for survival, protection & education of the girl child against the backdrop declining child sex ratio of female girl child in India. b. Aims to address the issue of declining Child Sex Ratio (CSR) through a mass campaign across the country targeted at changing societal mindsets & creating awareness about the criticality of the issue. c. Scheme will have focused intervention & multi-sectoral action in 100 districts with low Child Sex Ratio. d. It is a tri-ministerial, convergent effort of Ministries of Women and Child Development, Health & Family Welfare and Human Resource Development. 2. SUKANYA SAMRIDDHI YOJANA (2015) a. Sukanya Samriddhi Account: A promise of security for the girl child b. Scheme aims to ensure a bright future for the girl children by facilitating their education and marriage expenses. c. By mid-March 2015, within 2 months of launch, 1.8 lakh bank accounts had been opened under the scheme. 3. Maternity Amendment Act (2017) Key amendments:  Increased the duration of paid maternity leave from existing 12 weeks to 26 weeks.  Act has also introduced an enabling provision relating to "work from home" for women, which may be exercised after the expiry of the 26 weeks' leave period.
  • 48. 10 Depending upon the nature of work, women employees may be able to avail this benefit on terms that are mutually agreed with the employer.  Act makes crèche facility mandatory for every establishment employing 50 or more employees and allowed them to vising 4 times during their working hours.
  • 49. 1 Chapter 8 Transforming Science & Technology in India 8.1 Why do we need to promote and invest in Science, Technology & Innovation?  One of the key drivers of economic growth (economics of technological change/innovation) in the world.  Development of scientific temper, with its free spirit of inquiry based on reasons, can provide a bulwark against the darker forces of dogma, religion, and nativism that are threateningly resurfacing around the world.  Investing in science is also fundamental to India’s security: the human security of its population; uncertainty stemming from climate change; and national security challenges stemming from new emerging from new threats, ranging from cyberwarfare to autonomous military systems such as drones. 8.2 Trends in investment in STI: Input & Output  Inputs: Gross expenditure in Research & development (GERD) and Ph.Ds. in Science, Technology, Engineering and Mathematics (STEM).  Output: Research publications and Patents. A. Input: Gross Expenditure in R&D a. Exp. on GERD has been steadily rising over time in India. b. In nominal term exp. on GERD has tripled between 2004-05 & 2014-15. c. In real term ex. On GERD has doubled during the same period. d. However, GERD as a fraction of GDP has remained stagnant – between 0.6-0.7 percent – over the past two decades. e. Public exp. is dominant, although its share has come down from 75 percent to 60 percent. f. About three-fifth of public spending on R&D is spread over the key government funding agencies like CSIR, DRDO, Department of Atomic Energy (DEA), Department of Biotechnology (DBT), DST, Department of Space (DOS), ICAR, and ICMR.
  • 50. 2 g. Comparatively, India’s expenditure on R&D is very low.  India: 0.6 %  US: 2.8 %  China: 2.1  Korea: 4.2 %  Israel: 4.3 % h. What is unique is India is that the government do most of the R&D activities, whereas, in countries mentioned above, it the corporate sector which assume the greater role in R&D. i. Private investment in India on GERD have severely lagged behind. j. There are only 26 Indian companies are on the list of top R&D spenders, while China has 301 companies. 19 out of 26 companies are in just three sectors viz. Pharmaceuticals, Automobiles & Software (Forbes, 2017). B. Input: Ph.Ds. in Science, Technology, Engineering & Mathematics a. Well trained Ph.Ds. in the stem are critical input in the R&D process. b. No. of Indian student doing Ph.Ds. in stem from the US is only that of half of China. c. It appears that fewer Indian students have been enrolling in recent years for such degree, whether due to more attractive options after a master’s degree or rising work visa challenges. d. On the other hand, there have been an increase in Ph.D. enrollment in India. In 2015-16, 1, 25,451 students were enrolled in Ph.D. programs in India, of 62 percent were in the stem. This may be due to increase in no. and quantum of fellowship (Prime Minister Research Fellowship). e. Despite rising no. of Ph.Ds., India has far fewer researchers than other countries.  USA: 4,231 researchers per million population  Israel: 8,255 researchers per million population  China: 1,113 researchers per million population  India: 156 researchers per million population C. Outputs: Publications a. Publication hinted at the quality of Indian research and advancement in science. b. In 2013, India ranked 6th in the world in scientific publication. Its ranking has been increasing as well c. Between the years 2009-14, annual publication growth was almost 14%. This increased India’s share in global publications from 3.1% in 2009 to 4.4% in 2014 as per Scorpus Data. d. However, issue of quality remained in Indian publication. There are many journals that publish non peer reviewed manuscripts for substantial fees. The major catalyst for their explosive growth is “the demand created by increasing emphasis on the number of research publications as an important determinant of the academic performance of a faculty/scientist being considered for appointment or promotion” (Lakhotia, 2017). e. One positive trend is increasing no. of highly cited papers by India. The nature index (which publish tables based on counts of high-quality research outputs) – ranked India at 13 in 2017.
  • 51. 3 D. Output: Patents a. Patents reflect country’s standing in technology. b. According to WIPO, India is 7th largest Patent Filling Office in the world. c. In 2015, India registered 45,658 patents in comparison to China (1,101,864), USA (589,410) Japan (318,721), Korean Republic (213,694 & Germany (91,726). d. One major challenge in India is domestic patent system. While India’s patent grant status has improved in foreign jurisdiction, the same is not true at home. e. Residential applications have increased substantially since India joined international patent regime in 2005. However the no. of patent granted fell sharply post 2008 and has remained low. f. While Indian residents were granted 5000 patents in foreign offices in 2015, the no. for resident fillings in India was little over 800. g. This decrease in grants of could have been due to a stricter examination process. But evidence suggest that there is a severe backlog & high rate of pendency for domestic patent application. h. This high pendency is due to manpower shortage. There is a backlog of almost 2 lakh patent pending examination. In 2016-17, there were only 132 examiners for all patent application. This has meant that patent examination & granting can take 5 or more years (Chatterjee, 2017). Given the rapid rate technological obsolescence, the inordinate delays in processing patens penalize innovation & innovator within the country. i. Government recent hiring of over 450 additional patent examiners & creation of expedited filing system for Indian resident in 2017 will therefore be a welcome & crucial intervention to fix the current patent system. 8.3 Expanding R&D in India: Way Forward India needs to redouble its effort to improve science and R&D in country first and foremost by doubling national expenditure on GERD with most of the increase coming from the private sector & universities. But the metrics also need to beyond papers & patents to broader contribution to providing value for society.
  • 52. 4 1. Improve math’s & cognitive skills at school level a. The structure of R&D has to be supported by super-structure of strong primary & secondary education. b. Weakness in primary & secondary education denies India access to the intellect & energies of millions of young people. c. Even at tertiary level, scheme need to be devised to attract talent pool of resources. 2. Encouraging Investigator-led Research a. Move gradually to investigator-led research. b. Welcome step in direction – establishment of Science & Engineering Research Board (SERB) – has sanctioned about 3,500 new R&D projects to individual scientists. 3. Increasing contribution of private sector & state government a. Private sector should be incentivize to do both R&D and support STEM research through CSR. b. Current tax already favors CSR investment in R&D, but the types of R&D activities can be expanded. c. Govt. & Pvt. sector can work together to create R&D opportunities which are in line with private sector interest. One such example is Ucchatar Avishkar Yojna (UAY) d. State govt. too need to recognize the need to invest in application oriented research aimed at problem specific to their economies & populations. This would strengthen state universities and provide much need knowledge in areas such as crops, ecology & species. 4. Link national labs to universities & create new knowledge eco-system a. Separation of research & teaching has been an “Achilles Heel” for Indian Science. b. There are universities which specializing in teaching and research institute/labs specializing in research. c. A closer relationship/association between the two in specific geographical & spatial setting settings would help nurture research and teaching. Together they can link up with commercial sector and help develop clusters of knowledge eco- systems. 5. Take a mission driven approach to R&D India has potential to be a global leader in no. of areas if it willing to invest. However, it required focus on specific areas in which India has relative advantage and which of strategic interest.
  • 53. 5  National mission on Dark Matter promote basic science, energy physics and relevant mathematics. The payoff of this mission will have implications on space technology, newer solution to energy problems etc.  National Mission on Genomics promotes life sciences. The implications of this mission will be on disease control, and determining biological pathways.  National Mission on Energy Storage System: India is energy scare countries, a national mission on energy storage (for example: solar batteries) will likely to help in satisfying energy need of millions of Indians.  National Mission on Mathematics: Mathematics has two advantages 1) it is not capital intensive & 2) standard of excellence are universal. A national mission on mathematics will improve teaching, seeks to establish center of excellence and help in developing critical mind.  National Mission on Cyber Security Systems: It means whole machine based communication, analysis, inference, decision, action, and control in context of physical world. It’s a deeply multidisciplinary area of math’s, artificial intelligence (AI), big data analysis, computing & programming, block chain technology, and robotics & automation. Together these are the building block of future industry that will throw up both new challenges & opportunities.  National Mission on Agriculture: Improving agriculture productivity in India is still one of the major challenges. The newer threats such climate change induced distress, and pest & crop diseases demand a major thrust on agriculture Science & Technology. 6. Leverage Scientific diaspora a. Currently more than 100,000 people with PhDs, who were born in India but now living & working outside India (more than 91,000 in US alone). b. With growing prospect of economy & anti-immigration atmosphere in some western countries, India has an opportunity to attract back more scientist. In fact, increasing no. of Indian scientist are returning back in India during the last five years, however, their no. remains modest. c. No. of govt. schemes has been introduced to attract Indian as well as foreign researcher to work and to do projects for India in India. (Ramanujan Fellowship, INSPIRE, VAJRA etc.) 7. Improving the culture of research a. Improving the governance structure – more interactive which promote learning rather than hierarchical. b. Promote & fund risky venture with huge benefits if it succeed. 8. Greater public engagement of the science & research establishment a. Need to engage & interact with society to garner support from it. b. Much of science is “public good”. The value & awareness of science has to be inculcated in broader public.
  • 54. 6 8.4 Notes 1. Science can be defined the systematic study of the physical or material world (natural science) and of society (social science) that generates, or creates, knowledge from which data and information is drawn. Technology can be defined as the application of scientific knowledge to develop techniques to produce a product and/or deliver a service or as the application of scientific knowledge for practical ends. Innovation can be defined as deriving the benefits from a new or significantly improved product (good or service), or process (such as a new marketing method) or a new organizational method (such as in business practices, workplace organization or external relations). STI has an integrated life cycle where science leads to new technologies from which innovations develop. Innovative ways of doing things can change and influence the development of science and how and what technologies are brought forth which, in turn, also influence the innovation process. 2. Evolution of Science Policy in India 1958  India’s first Scientific Policy Resolution.  Foster, promote & sustain the cultivation of science & scientific research in all aspects. 1983  New policy focused on the need to attain technological competence and self- reliance. 2003 1. Bring science and technology together 2. Bring higher investment into R&D to address national problems. 3. Science & Technology to meet the challenge posit by globalization 2013  Holistic integration of Science, Technology & Innovation (STI) – prepared by Department of Science & Technology  SRISHTI= Science, Research and innovation system for High technology led path for India. 2010-20  India has declared this as “decade of innovation”
  • 55. 7 Key objective of SPR 2013  STI for faster, sustainable and more inclusive growth  Focus on both STI for people and people for STI.  Positioning India among the top five global scientific powers by 2020  Publish more research papers.  Encouraging private sector to invest in Research and Development (R&D)  Promoting gender parity in S&T. (meaning bring more female scientists) 3. Schemes for promoting higher education & research in Science & Technology. a. Prime Minister Research Fellowship (2018) to convert brain drain into brain gain. The fellowship is targeted to incentivize the best brains to pursue Ph.Ds. in India. b. Uchatar Avishkar Yojana (2017) was launched to promote industry-specific need-based research so as to keep up the competitiveness of the Indian industry in the global market c. Impacting Research Innovation and Technology (IMPRINT) India (2017): IMPRINT INDIA is a Pan-IIT and IISc joint initiative to develop a roadmap for research to solve major engineering and technology challenges in ten technology domains relevant to India. d. Global Initiative of Academic Network (2014): GIAN is aimed at tapping the talent pool of scientists and entrepreneurs, internationally to encourage their engagement with the institutes of Higher Education in India so as to augment the country's existing academic resources, accelerate the pace of quality reform, and elevate India's scientific and technological capacity to global excellence. e. Innovation in Science Pursuit for Inspired Research (INSPIRE) (2008) is an innovative programme sponsored and managed by the Department of Science & Technology for attraction of talent to Science. The basic objective of INSPIRE is to communicate to the youth of the country the excitements of creative pursuit of science, attract talent to the study of science at an early age and thus build the required critical human resource pool for strengthening and expanding the Science & Technology system and R&D base. f. Visiting Advanced Joint Research-Faculty Scheme (2017) is a dedicated program exclusively for overseas scientists and academicians with emphasis on Non-resident Indians (NRI) and Persons of Indian Origin (PIO) / Overseas Citizen of India (OCI) to work as adjunct / visiting faculty for a specific period of time in Indian Public funded academic and research institutions.
  • 56. 1 Chapter 9 Ease of Doing Business’ Next Frontier: Timely Justice The government efforts to make India as a business friendly country has been widely acknowledge. The next frontier is judiciary reforms which allows time justice and significantly reduce the time & cost of commercial projects. There is an immediate need of addressing pendency, delays and backlog in the appellate bodies and judicial arenas. These issues are hampering dispute resolutions, contract enforcement, and discouraging investment, hampering tax collection, stressing tax payers, and escalating legal costs. This calls for a vertical co-operation between judiciary and government to boost economic growth & provide justice. 9.1. Introduction a. India’s ranking in ease in doing business (EODB) index has jumped to 100 in 2018 (a significant increase from 130 in 2017). This is mainly due to the concerted effort of government to make India as a destination for doing business. b. India leaped 53 & 33 spots in taxation & insolvency related indices, respectively on the back of administrative reform on taxation and implementation of Insolvency and Bankruptcy Code (IBC) in 2016. It has also made strides on protecting minority investors & obtaining credit, and retained a high rank on getting electricity, after a 70 spot rise in 2017 due to government electricity reforms. c. However, on contract enforcement indicators India continue to lag behind. Although its position has marginally improved from 172 in 2017 to 164 in 2016. d. In recent years, the government has taken no. of steps and action to expedite & improve contract enforcement mechanism. For example, scrapping & rationalizing over 1000 redundant acts, amendment on The Arbitration & Conciliation Act, 2015, passed The commercial courts,  Efficient, effective & expeditious contract mechanism affect economic growth.  Clear & certain legislative and executive regime backed by an efficient judiciary that fairly and punctually protects property rights, preserve sanctity of contracts, and enforces the rights and liabilities of parties is pre-requisite for business & commerce. Why an efficient judiciary is desirable?