World as a Supply Chain Infographic
•
0 likes•78 views

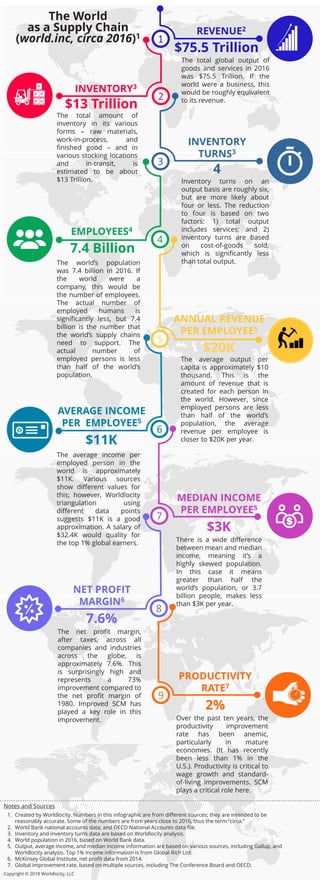
Infographic describing the world as if it were a company, or a supply chain. Includes, population, revenue, inventory, inventory turns, income, and productivity. A powerful statement for the importance of supply chain management.

Recommended
More Related Content
Similar to World as a Supply Chain Infographic
Similar to World as a Supply Chain Infographic (20)
Recently uploaded
Recently uploaded (20)
World as a Supply Chain Infographic
- 1. The World as a Supply Chain (world.inc, circa 2016)1 REVENUE2 The total global output of goods and services in 2016 was $75.5 Trillion. If the world were a business, this would be roughly equivalent to its revenue. $75.5 Trillion Inventory turns on an output basis are roughly six, but are more likely about four or less. The reduction to four is based on two factors: 1) total output includes services; and 2) inventory turns are based on cost-of-goods sold, which is significantly less than total output. INVENTORY TURNS3 INVENTORY3 $13 Trillion The total amount of inventory in its various forms – raw materials, work-in-process, and finished good – and in various stocking locations and in-transit, is estimated to be about $13 Trillion. 1 2 4 3 4 EMPLOYEES4 7.4 Billion The world’s population was 7.4 billion in 2016. If the world were a company, this would be the number of employees. The actual number of employed humans is significantly less, but 7.4 billion is the number that the world’s supply chains need to support. The actual number of employed persons is less than half of the world’s population. ANNUAL REVENUE PER EMPLOYEE5 5 $20K The average output per capita is approximately $10 thousand. This is the amount of revenue that is created for each person in the world. However, since employed persons are less than half of the world’s population, the average revenue per employee is closer to $20K per year. 6 AVERAGE INCOME PER EMPLOYEE5 $11K The average income per employed person in the world is approximately $11K. Various sources show different values for this; however, Worldlocity triangulation using different data points suggests $11K is a good approximation. A salary of $32.4K would quality for the top 1% global earners. There is a wide difference between mean and median income, meaning it’s a highly skewed population. In this case it means greater than half the world’s population, or 3.7 billion people, makes less than $3K per year. Notes and Sources MEDIAN INCOME PER EMPLOYEE5 $3K 7 Over the past ten years, the productivity improvement rate has been anemic, particularly in mature economies. (It has recently been less than 1% in the U.S.). Productivity is critical to wage growth and standard- of-living improvements. SCM plays a critical role here. NET PROFIT MARGIN6 8 The net profit margin, after taxes, across all companies and industries across the globe, is approximately 7.6%. This is surprisingly high and represents a 73% improvement compared to the net profit margin of 1980. Improved SCM has played a key role in this improvement. 7.6% PRODUCTIVITY RATE7 9 2% 1. Created by Worldlocity. Numbers in this infographic are from different sources; they are intended to be reasonably accurate. Some of the numbers are from years close to 2016, thus the term “circa.” 2. World Bank national accounts data, and OECD National Accounts data file. 3. Inventory and inventory turns data are based on Worldlocity analysis. 4. World population in 2016, based on World Bank data. 5. Output, average income, and median income information are based on various sources, including Gallup, and Worldlocity analysis. Top 1% income information is from Global Rich List. 6. McKinsey Global Institute, net profit data from 2014. 7. Global improvement rate, based on multiple sources, including The Conference Board and OECD. Copyright © 2018 Worldlocity, LLC