The money nevigator
•
1 like•383 views

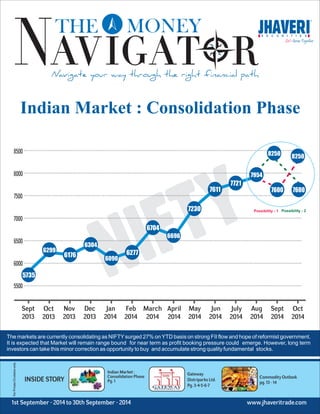
The document summarizes the Indian market as being in a consolidation phase in September 2014. Key points include: 1) The NIFTY surged 27% YTD on strong FII inflows and hopes for economic reforms under the new government. 2) The market is expected to remain range-bound in the near term due to potential profit-taking, but long-term investors can view minor corrections as buying opportunities in quality stocks. 3) Earnings growth has started to show green shoots, while the PM's first 90 days in office were seen as promising but not impressive. Brent crude prices hitting 14-month lows will provide a boost to the economy and oil sector.

Recommended
Recommended
More Related Content
What's hot
What's hot (20)
Similar to The money nevigator
Similar to The money nevigator (20)
More from kailash tawaniya
Recently uploaded
Recently uploaded (20)
The money nevigator
- 1. Indian Market : Consolidation Phase NIFTY Indian Market : Consolidation Phase Pg. 1 1st September - 2014 to 30th September - 2014 Gateway Distriparks Ltd. Pg. 3-4-5-6-7 8250 7600 Possibility - 1 Possibility - 2 Commodity Outlook pg. 13 - 14 Sept 2013 Oct 2013 Nov 2013 Dec 2013 Jan 2014 Feb 2014 March 2014 April 2014 May 2014 Jun 2014 July 2014 Aug 2014 Sept 2014 Oct 2014 8500 8000 7500 7000 6500 6000 5500 6299 6176 6304 6090 6277 6704 6696 7230 7611 7721 7954 7600 8250 5735 The markets are currently consolidating as NIFTY surged 27% on YTD basis on strong FII flow and hope of reformist government. It is expected that Market will remain range bound for near term as profit booking pressure could emerge. However, long term investors can take this minor correction as opportunity to buy and accumulate strong quality fundamental stocks. 1st September - 2014 to 30th September - 2014 www.jhaveritrade.com
- 2. Trade Whenever & Wherever Faster Smarter & Simpler For Demo & More Detail Give Missed Call : 08049336177 SMS JeTrade to : 9601336677 FREE OF COST No Hidden Charges Easy to Operate Trade in EQUITY / FUTURE / OPTION Common Market Watch for all Segment i.e. BSE,NSE & NSEFO Live Price Movement Live Chart Track your DP Holding & Balance Global Market Jhaveri Research JHAVERI SECURITIES LTD 301/302, Payal Tower-II, Sayajigunj Vadodara - 390020, Web.: www.jhaveritrade.com I www.jetrade.in Ph.: + 91 265-3071200 SEBI REGISTRATION NO.:NSE:INB/F/E 230823233, BSE:INB/F 010823233, MCX SX:INE:260823233 and NSDL:IN-DP-NSDL-166-2000 NCDEX:TMID 00749 / FMC REG NO.NCDEX / TCM / TCM / CORP / 0736 MCX: TMID 29040/FMC REG NO.MCX/TC/CORP/0963 Note* : Dealing in commodity segment through it’s grop company jhaveri credit & capital Ltd. Distributer for IPOs & Mutual Funds. Past performance is not a measure for future returns
- 3. www.jhaveritrade.com From The MD’s Desk Market closed at all time high As we have seen, the market has sustained at all time high, SENSEX at 26867 and NIFTY at 8027. There are certain facts and data driving the market. Following are the few points which have driven market to new highs and still can provide necessary fire to the market. 1. Optimistic statements by RBI about the economic recovery even if there will be rain deficit. 2. The oil reforms undertaken by the government are clearly reducing the subsidy burden. Any cut in LPG subsidy will be a big positive for the market going ahead. 3. Expectations of upward revision of Indian rating by S&P and Moody's is really driving the FII money in equity and debt market. 4. Almost all hurdles to rollout GST are cleared and can turn to reality soon. 5. The global oil prices are declining meaningfully and the oil supply is on track even there is continued geopolitical risk in Ukraine, Gaza and Iraq. The FIIs really believe India story and have full faith in economic recovery under Narendra Modi government. The business confidence has clearly increased after 100 days of Modi government. People are optimistic and so are the FIIs. Some global analysts are confident about revenue upgrades in certain sectors. Pharmaceutical is one of the sector having clear chances of revenue upgrade. We have seen some good buying in mid-cap pharma companies in last certain days. In case of oil and gas sector, the market is waiting for cabinet decision on gas pricing. The market also think that the worst for PSU banks is over and the economic recovery will lead to credit growth for the banks. Under the circumstances, the market will continue with sound support at 7700/25800. Any decisive close above 7920-7950 range will give more confidence to the market. Kamlesh Jhaveri Managing Director Jhaveri Securities Ltd.
- 4. Why Equity Sip ? Transparency Cost Effective Goal Based Investment of `1000 per month condition apply* Call +91 265 3071200, +91 99254 20000 Email : product@jetrade.in Web : www.Jetrade.in
- 5. Parameters Q1 FY 15 Q1 FY 14 Net Profit (` in Cr.) 62040 46792 % Change (YoY) 33.4 8.8 Net Sales (` in Cr.) 554426 491689 % Change (YoY) 12.8 4.8 Net Profit Margin (%) 11.3 9.5 According to Care Ratings, over 1,204 companies have registered a substantial growth in Q1 FY 15. However, underlying parameters such as (1) loan growth, credit quality for banks (2) volume growth for consumer stocks (3) domestic order inflows for industrial companies were largely weak in 1QFY15. Some industries (like automobiles, electricity) are starting to show strong growth. So we can consider earnings green shoots have started and as far as underlying parameters are concerned it will take not more than two quarters to improve. Narendra Modi has completed three months into office as prime minister and in Ninety days, Modi has made some unpopular decisions, such as approving diesel price hikes and increase the cost of railway tickets. However, PM has also taken decisions like : 1) FDI allowed in insurance firms was raised from 26 percent to 49 percent. 2) The formalization of rules for long-term infrastructure bonds. 3) Hiking foreign direct investment limits in defense firms (from 26 percent to 49 percent) and railways (up to 100 percent) 4) Simplifying environmental and forest clearance rules. 5) Controlling inflation by releasing food grain stock. PM 's work so far as "not impressive, but promising.” PM established his credentials and has pledged to do more for the country as a whole, but what he plans on doing remains to be seen. Brent crude at 14 month low - big booster for Indian economy www.jhaveritrade.com Issue Theme Indian Market : Consolidation Phase 1 Earnings green shoots have started PM’s 90 day scorer card : not impressive but promising The 2014-15 budget estimated India’s subsidy bill at Rs.2.6 trillion, or 2.03% of gross domestic product (GDP), with oil subsidies amounting to Rs.63,500 crore and calculated the fuel subsidy bill assuming a crude oil price of $110 per barrel. With the price coming down to $100.04 per barrel (touching 14th month low ) and the Indian rupee also stabilizing around the Rs.60 per dollar mark, a rough calculation shows that the government could save up to Rs.5,000-6,000 crore in oil subsidies if crude prices remain around these levels till the end of the fiscal year. India’s ambitious plans to contain its fiscal deficit at 4.1% of GDP in 2014-15, against 4.5% of GDP in the previous year. According to estimates, a one dollar change in the price of crude oil in the Indian energy basket has an impact of Rs.8,000 crore on under-recoveries. Oil and Gas sector is expected to re-rate : According to Goldman Sachs, losses on retail diesel sales are now down to 80 paisa/ litre from ` 1.30/ litre in the first fortnight of August this year. The gap is expected to close down 30 paisa /litre after the scheduled price increases from September-1 assuming that oil price remain around same level. As the current rate of diesel deregulation is in continution, in the next two months diesel will be market priced which will give big boost to OMCs and its under recoveries. Conclusion Some of the good steps which were taken by UPA government in last six months have started to give positive reactions in reviving almost stagnant economy. The good actions on the part of UPA government is being continued with new enthusiasm and new policy initiatives by NDA government. As Indian economy expanded 5.7% in the first quarter of FY15, the highest in nine quarters, against a growth of 4.6% in Q4 of 2013-14. Everybody is slowly and steadily convince that the market is at a multi-year bull run. Currently It is entering in a consolidation phase, which makes it a “buy on dips market”.
- 6. IPO Sign & Submit Online IPO Form Existing customer of JHAVERI can download Limited POA for Online IPO from website www.jhaveritrade.com and signed submit to Online KYC Dept., JeTrade, Payal Tower II, Sayajigunj, Vadodara - 390020. After necessary verification & confirmation, Online KYC Dept. will grant the permission to process further. www.jhaveritrade.com JSL Classroom Product Guide - Online IPO Online is an online platform which enables the investor to submit applications in the public issues (whether it is under Book Building/Fixed Price) through our website www.JeTrade.in & through JeTrade trading applications saving the trouble of submitting application in paper form to the bidding / collection centers & removing any time constraint. Also, get detailed information & news on IPO Online, Open Issues, Closed issues, Forthcoming Issues and a lot more. Existing customer of Jhaveri or JeTrade who had signed the KYC as well as POA agreement can apply for Online IPO. JeTrade Customer can invest in Online IPO through our website as well as through our trading application. Banking & Processing • Allotment & 2 1. What is Online IPO…? 2. Who can apply in Online IPO…? 3. What is the process for registration in Online IPO…? 4. Whom to contact for Online IPO process…? 5. Is there any deadline defined for applying in online IPO…? 6. Why should I go for Online IPO ? 7. How can I capitalize on this opportunity? To activate Online IPO facility customer can contact at branch or contact JeTrade Customer Care Desk or Activation Desk on 0265 3071225/ 227. For any inquiry, customer can write us email to myaccout@JeTrade.in. Customer can apply till last day of the defined time frame of IPO. • Can be applied anywhere anytime • You can apply IPO against ledger balance / RTGS • Shorter IPO cycle - Total 7-10 days from announcement to allotment • Approximately 30 -35 IPO/FPO & ETFs under pipeline in F.Y.2014-15 • Apply in multiple family a/c to maximize allotment • Apply on click – First cum first serve basis • Greater allotment without any rejection JHAVERI Client Apply & Get allotment online Online IPO facility activated Get notifications for IPO/FPO /OFS • Announcement of IPO/FPO • 3-4 days prior Form Distribution • IPO/FPO period • 2-3 days Listing • 5-10 days Listing
- 7. Gateway Distriparks Ltd was incorporated on April 6, 1994. The company was originally promoted by NTSC, CWT Distribution Ltd, NUR Investment and Trading Pvt Ltd and Intercontinental Forest Products Pte Ltd as joint venture company, to conduct the business of warehousing, container freight stations and all related activities. Gateway Distriparks is a Container logistics company with Pan-India presence. The company is a world-class state-of-the-art logistics facilitator in one of the world's fastest growing markets. They are providing Container Freight Station (CFS) / Inland Container Depot (ICD) services. The company is armed with modern Container Freight Stations at Dronagiri in Navi Mumbai, Manali in Chennai and Vishakapatnam in Andhra Pradesh besides an Inland Container Depot at Garhi Harsaru in Haryana. 3 www.jhaveritrade.com Gateway Distriparks Ltd. Company Basics “Buy” CMP : `258 TGT : `348 BSE ID NSE Symbol GROUP EQUITY (` in Cr.) MKT.CAP(` in Cr.) 532622 GDL B 108.73 2805.18 Financial Basics FV (`) EPS (x) (TTM) P/E (x) P/BV (x) BETA RONW (%) 10.00 13.13 19.65 0.38 0.4545 8.53 Investment Rationale Investment Horizon: 12 to 18 Months Share Holding Pattern Holder's Name Foreign Institutions Promoters Mutual Funds Public & Others Bodies Corporate % Holding 28.46 20.61 37.77 4.44 8.72 0.00 Company Description Investment Rational Indian port traffic is expected to grow CAGR 14% from 2012 to 2017E Ports play a pivotal role in the overall economic development of the country. According to industry estimates about 90% by volume and 70% by value of the country’s international trade is carried out through maritime transport. India has 7517 KMs of longest cost line with 13 major and 176 non major ports. According to Maritime Agenda 2010-2020, Maharashtra (15%), Andhra Pradesh (13%), and Tamil Nadu (11%) have significantly contributed in Indian port traffic through major port. Indian port traffic has grown CAGR 8.5% from 00-01 to 2011-12 (898 MMT in 2011-12 v/s 368 MMT in 2000-01). Inspite of significant growth rate achieved in last decade in port traffic and geographical advantage, Indian port development / Indian port traffic is not up to global standards and has being handling lower in comparison to global parts. So there is huge space of development is there. To achieve this target, Ministry of Shipping has initiated a policy measure called Marine Time Agenda 2010-2020 which has major thrust on development of India’s major and non major port through various Private Public Partnership and various FDI initiative in Port Sector.Some of ambitious target of 2010 - 2020 are Company Analysis 2009-10 2011-12 2016-17E 2019-20E 3500 3000 2500 2000 1500 1000 500 0 850 963 1032 1240 2020 1240 2500 3200 Traffic Capacity Indices Nifty Sensex Valuations Value 7904 26442 Currently, GDL is trading at `258 . We Recommend “Buy” with, assigning target multiple 11x EV/EBITDA FY16E with target price of `348 . ROI : 35%
- 8. Containerized cargo traffic : The major driver of Container Freight Station (CFS) and Inland Container Depot (ICD) 10494 14% 12077 15% 14011 16% Chennai 600 www.jhaveritrade.com Gateway Distriparks Ltd. (A) Create Port capacity of 3200 M.T. for handling about 2500 M.T. of cargo (B) Improve Port performance on par with the best in the world ( C ) Full mechanization of cargo handling at ports. Company Analysis 2007 2008 6248 7618 21% 22% 16% 18% 4 2009 7871 3% 18% 2010 8130 3% 18% 2011 9189 13% 20% TEU ('000s) YoY Growth (%) Ports handle various kinds of cargo (Break bulk, Dry, Container, Liquid) at terminals. Container cargo constitutes around 22- 23% of overall cargo handling at port which is much lower as compared to global average of 70-80%. Indian container traffic has grown from 6248 000 TEU in 2007 to 14011 000 TEU in 2014, more than double during the span of seven years. The growth of container cargo is mainly dependent on two main reason Rising major EXIM trade at various major and non major port The development of major and non major port with improvement in infrastructure facilities is the key growth driver of EXIM trade. Change in types of commodities transport from container cargo The pattern of change in commodity type is the major reason for growth in EXIM. Initially, commodities like garments, electronic goods agro products, cotton yarn, machinery & machinery parts, granite products, coir products, leather products and jute products are the mainly containerized from Indian port . However, due to economies of scale and cost optimization, break bulk cargos like rice, cement iron ore, sugar, soya, rice are now moving in containers. Moreover, some of commodities have permanent container fixtures which further move commodities swiftly. Indian CFS / ICD market grown CAGR 14% from 2009-2013 The growth of container Freight Station / Inland container Depot has directly co-related with the growth of containerization level and port traffic growth at various major and non major ports in India. As international trade is increasing , Indian CFS market size has grown from ` 74 billion in 2009 to ` 125 billion in 2013 and the segment has grown an average of 14% YoY in last five years. CFS accounts for 40% of the container load while ICD accounts for 60%. We believe that Indian CFS /ICD market is expected to grow in range of 15-18% in coming years on development of container terminals in existing major ports, emerging growth in east cost ports and policy frame work in the form of Marine Time Vision 2020. Further development of container terminals at major and non major port 2012 22% 2013 NA Year Containerization (% of overall Cargo) 2014 NA Port Proposed Projects Estimated Cost of Project (` in Cr.) Chennai-Ennore Port road connectivity Development ofChennai Mega Terminal Development of Integrated Dry Port & Multi-modal Logistics Hub near by place 3686 415
- 9. JNPT (I+II) Various road infrastructure / connectivity NA The DMIC is the ambitious project by government of India which pass through highly industrial state of county U.P, NCR of Delhi, Haryana, Rajasthan, Gujarat and Maharashtra, with end terminals at Dadri in the National Capital Region of Delhi and Jawaharlal Nehru Port near Mumbai.The main objective of this project is expanding the manufacturing and services base in India. We believe DMIC is the key growth driver for EXIM trade in India. Indian Cold Chain industry is expected to grow at a CAGR of ~28% over the next 4 years and reach a market size of ~USD 13 Bn in 2017 and is largely unorganized in nature. Thereby, presenting a great opportunity for foreign companies The Indian cold chain market is highly fragmented with more than 3,500 companies in the whole value system Organized players contribute only ~8% - 10% of the cold chain industry market. Most equipment in use is outdated and single e-commodity based. GDL entered into the cold chain business with the acquisition of a 50.1% stake in Snowman Frozen Foods in 2006. The remaining ownership is distributed with GDL at 54% followed by Mitsubishi, IFC and NVP at 18%, 14% and 14%, respectively. The segment increased its revenue contribution significantly from 8% in FY12 to 16% in FY14. EBITDA margin for the segment also expanded improved significantly from 16% to 18.5% over the same period. We expect that the pallet capacity is expected to expand to 91,000 in FY16 from 55000 in FY14 . GDL has 785,000 TEUs capacity in ICD segment and 21 rakes in Rail Freight and it is the second largest container train operator (CTO) in the country. Combined Rail and ICD throughput grew at a CAGR of ~7% over FY12-14 to 205538 TEUs. We believe that it is expected to grow at ~11% CAGR over FY14-16E. The rakes ply mainly run on the EXIM route, so this reducing empty running and expected higher margins. In FY14, GDL was able to pass on FY13 freight hikes and enhanced its operational efficiency with double stacking and closure of unprofitable routes, which enabled the rail/ICD segment to report a 500 bps YoY improvement in EBITDA margin. As the Faridabad ICD becoming operational and expected to gain in the next couple of quarters, throughput of the rail/ICD segment is expected to improve further. GDL is planning to develop Ahmedabad ICD in next 12-24 months. 5 www.jhaveritrade.com Gateway Distriparks Ltd. Company Analysis Standalone Container handling facility Development of fourth container terminal 600 7915 Strong growth is expected in Indian container logistic market Cold chain logistics : an emerging segment in Indian logistic industry The key growth driver for GDL will be ICD and Rail segment in future Q1 FY 15 : Quarter update • Gateway Distriparks reported consolidated growth of 14% increase to ` 279 Cr. for June'14 quarter, lead by a 43% increase in revenue from cold chain and Snowman business. • Operating profit increase by 22% to Rs 75.34 crore. Operating profit margin increased by 190 bps to 26.9% due to higher throughput from CFS business and higher volume growth in Snowman and Rail business resulting in
- 10. Gateway Distriparks Ltd. Q3 FY 14 43.60 5.79 21.67 16.14 17.55% 14% 30% 12% Q4 FY 14 48.20 5.79 18.13 24.27 21.59% 8% 12% 16% Q1 FY 14 42.20 6.04 12.17 23.99 17.10% 17% 17% 17% Q2 FY 14 45.61 5.49 26.68 13.44 18.14% 16% 35% 10% 6 www.jhaveritrade.com better economies of scale for the company. • Lower other income, down by 15% and higher interest and depreciation costs up by 35% and 28% restricted the PBT growth to 14%. After paying total tax up by 11% and MI down by 58%, consolidated PAT for June'14 quarter stood at Rs 36.92 crore, up by 23% YoY. Segment Performance • Net sales from CFS business which constitute about 28% of total revenue were up by 8% to Rs 79.06 crore. PBIT from CFS segment was down by 3% to Rs 23.24 crore and PBIT margin stood at 49.4%. • Net sale from Rail Logistics which constitute about 54% of total revenue was up by 9% to Rs 151.71 crore. PBIT from Rail Logistics business stood at Rs 21.71 crore, up by 78% YoY and PBIT margin stood at 14.3%. • Revenue from Snowman cold chain logistic business which constitutes about 18% of total sales grew by about 43% to Rs 49.52 crore. EIBT from Cold chain Logistics business stood at Rs 6.23 crore and PBIT margin stood at 12.6%. Key Financials EBIT (` in Cr.) Cold Chain Logistics Container Freight Station Container Rail Logistics EBIT Margin (%) Cold Chain Logistics Container Freight Station Container Rail Logistics Key update from Q1 FY 15 conference call • Gateway Rail started operations from Faridabad in 1st week of Aug'14. This is a big breakthrough for the company as there is a sizable volume waited to be channelized through railway segment in between Faridabad, Delhi and the corridor region. • Management is confident of ramping up and volume in CFS segment to kick start before the year FY 2015 ends. There was some further improvement in port throughput in July'14 that was visible. • Currently the rail division has about 80000 pallets as compared to about 66000 to start with in FY 2014. Management expects further about 6000 more pallets will be added to reach 86000 pallets by end of March 2015. • Realization in Mumbai CFS improved on QoQ basis. Value added services increased like warehousing, export proportion has gone up. These activities give more profitability and should drive the margins going forward. Company Analysis
- 11. Gateway Distriparks Ltd. 107.9 874.19 1003.63 50.96 234.31 183.35 12.46 516.61 389.41 2.08 138.48 117.87 92.99 72.38 108 1120.19 1143.41 132.26 282.9 150.64 9.5 602.46 444.89 2.26 174.26 154.36 124.02 104.12 108.28 1176.67 1230.3 156.38 308.14 151.76 14.36 821.5 586.17 2.79 264.16 249.26 201.35 186.45 108.5 1342.93 1509.55 129.12 310.14 181.02 15.49 954.02 726.58 3.51 261.87 243.19 192.02 173.34 7 www.jhaveritrade.com Company Analysis • Capex for FY 2015 for cold chain segment will be around Rs 125 crore, for rail will be around Rs 75 crore and no major capex is expected in CFS business. Key Financials Financial Statements Equity Paid Up Networth Capital Employed Gross Block (Excl. Reval. Res.) Net Working Capital ( Incl. Def. Tax) Current Assets ( Incl. Def. Tax) Current Liabilities and Provisions ( Incl. Def. Tax) Total Assets/Liabilities Net Sales Other Income Value Of Output Cost of Production Selling Cost PBIDT PBDT PBIT PBT PAT after Minority Interest Adjusted PAT FY 10 664.26 1057.06 516.61 79.14 79.12 FY 11 687.94 1270.83 602.46 96.75 97.55 FY 12 747.78 1328.43 821.45 132.03 131.61 FY 13 788.68 1523.95 954.07 126.69 126.7
- 12. P/E (x) P/BV (x) www.jhaveritrade.com Sector Valuation Analyst Special 8 Current 2.80 1.60 3.80 10 Yrs. Avg. 2.90 2.70 3.10 Premium / Dis. (%) -4.3 Valuation Multiples Sector Auto Our Preferred Picks Current 12.80 7.90 24.50 10 Yrs. Avg. 12.20 10.90 31.00 Premium / Dis. (%) 5.00 -28.00 -21.00 -40.00 31 P/E (x) TATA Motors Amar Raja Batteries P/BV (x) Current 0.90 10 Yrs. Avg. 1.10 Premium / Dis. (%) -20.40 Valuation Multiples Sector Bank - PSU Our Preferred Picks Current 7.20 10 Yrs. Avg. 7.00 Premium / Dis. (%) 2.70 Current 3.30 7.50 3.00 10 Yrs. Avg. 4.40 6.90 3.90 Premium / Dis. (%) -26.20 Valuation Multiples Sector Capital Goods Our Preferred Picks Current 29.20 62.20 20.90 10 Yrs. Avg. 20.70 67.40 18.70 Premium / Dis. (%) 41.10 -8.00 11.00 8.00 -23.00 P/E (x) ABB Voltas P/BV (x) Current 2.10 0.80 1.10 10 Yrs. Avg. 2.40 1.20 1.60 Premium / Dis. (%) -12.40 Valuation Multiples Sector Cement Our Preferred Picks Current 19.90 19.10 10.50 10 Yrs. Avg. 13.80 15.40 7.50 Premium / Dis. (%) 44.00 24.00 4.00 -35.00 -35.00 P/E (x) India Cements Birla Corporation P/BV (x) Current 5.10 2.70 3.10 10 Yrs. Avg. 4.20 2.30 3.70 Premium / Dis. (%) 20.60 Valuation Multiples Sector Health Care Our Preferred Picks Current 25.20 19.60 23.50 10 Yrs. Avg. 21.90 16.20 21.60 Premium / Dis. (%) 14.80 21.00 9.00 16.00 17.00 P/E (x) Biocon Cipla P/BV (x) 0.70 0.60 1.00 0.90 5.80 5.80 5.80 0.40 0.00 -10.00 -30.00 -34.00 Canara Bank Oriental Bank
- 13. Sector Valuation Analyst Special Current 1.90 2.30 0.90 10 Yrs. Avg. 2.40 2.40 1.50 Premium / Dis. (%) -23.70 P/E (x) P/BV (x) 9 www.jhaveritrade.com Valuation Multiples Sector Telecom Our Preferred Picks Current 22.60 18.10 20.20 10 Yrs. Avg. 22.60 25.70 23.90 Premium / Dis. (%) 0.00 -29.00 -15.00 -1.00 -40.00 P/E (x) Idea Cellular RCOM P/BV (x) Current 1.20 1.60 2.00 10 Yrs. Avg. 1.80 2.30 4.80 Premium / Dis. (%) -33.40 Valuation Multiples Sector Metal Our Preferred Picks Current 10.90 9.60 9.40 10 Yrs. Avg. 9.50 11.00 15.10 Premium / Dis. (%) 14.40 -12.00 -37.00 -31.00 -58.00 P/E (x) Tata Steel NMDC P/BV (x) Current 1.50 1.30 0.90 10 Yrs. Avg. 1.70 1.70 1.20 Premium / Dis. (%) -16.10 Valuation Multiples Sector Oil and Gas Our Preferred Picks Current 11.00 11.90 5.80 10 Yrs. Avg. 11.00 12.60 13.60 Premium / Dis. (%) -0.40 -5.00 57.00 -22.00 -26.00 P/E (x) RIL Cairn India P/BV (x) Current 1.20 10 Yrs. Avg. 1.40 Premium / Dis. (%) -14.50 Valuation Multiples Sector Real Estate Our Preferred Picks Current 28.40 10 Yrs. Avg. 21.40 Premium / Dis. (%) 33.00 Current 11.60 10.90 1.30 10 Yrs. Avg. 8.50 6.90 3.40 Premium / Dis. (%) 36.50 Valuation Multiples Sector Consumer Our Preferred Picks Current 31.10 26.30 11.60 10 Yrs. Avg. 24.40 22.20 27.00 Premium / Dis. (%) 27.60 18.00 -57.00 59.00 -61.00 P/E (x) ITC Radico Khaitan P/BV (x) 1.70 1.60 2.20 1.80 15.30 10.50 18.10 25.20 -16.00 -58.00 -22.00 -12.00 Sobha Developers Mahindra Life
- 14. BUY BTWN 157-163 SL 148 TGT 174-179 BUY BTWN 2840-2920 SL 2705 TGT 3095-3150 www.jhaveritrade.com Monthly Technical Picks Monthly Technical Picks HEXAWARE DRREDDY UNICHEMLAB RCOM 10 On weekly chart, stock has taken support of median line of its andrew pitchfork pattern. Now, stock is likely to move towards upper line of its andrew pitchfork pattern. Weekly stochastic is in positive crossover suggesting buying interest. Also stock is trading above its 20 week SMA. On weekly chart, stock has given crossover above median line of its andrew pitchfork pattern. Breakout point is 2920. Weekly stochastic is in positive crossover suggesting buying interest. Also stock is trading above its 21 week EMA. On weekly chart, stock has taken support of lower line of its andrew pitchfork pattern. Now, stock is likely to move towards median line of its andrew pitchfork pattern. Weekly stochastic is in positive crossover suggesting buying interest. Also stock is trading above its 21 week EMA. On weekly chart, stock is trading below neckline of its head and shoulder pattern. Here, breakdown point is 120.Weekly stochastic is in negative crossover suggesting selling interest. Also stock is trading below its 21 week EMA. SELL BTWN 117-121 SL 129 TGT 108-101 BUY BTWN 214-223 SL 202 TGT 238-249
- 15. 71910607.29 www.jhaveritrade.com Mutual Fund Can I Really Save Tax And Aim To Earn More At The Same Time? Take the ELSS (sec 80C) Advantage ELSS V/S PPF 2850000.00 6785376.11 Total Investments PPF ELSS 11 Advantage 1 - Tax Free Returns Income / Returns in the form of Dividend or Capital (On Redemption) are Totally Tax Free. Gains Advantage 2 - Lower Lock In Period In comparison to the various other investment avenues Under section 80C of the income Tax Act, ELSS has the Shortest lock in Period 3 Years. Advantage 3 - Better Return Since there is period of 3 years, the fund manager has The opportunity to invest the funds for long term as he does not Have to worry about sudden redemption pressures. i.e. there is More stability in terms of exit Advantage 4 - Low Expense Expanses are quit low in ELSS compare to other options Available for tax planning. Particulars Lock-in Period (Yrs) Return CAGR (%) Taxation on returns PPF 15 8 Interest is Tax Free NSC 6 8 Interest is Taxable Bank FDs 5 8.5 Interest is Taxable Post Office Time Deposits 5 7.5 Interest is Taxable ELSS 3 Linked to Market Div as well as cap Gain are Exempt Interesting analysis of HDFC TaxSaver Fund (ELSS) v/s PPF Consider an example, where investor A has Invested 150000/- p.a. in PPF since 1996 whereas Investor B has chosen the HDFC Tax Saver Fund (ELSS) route. Investor B has Invested 150000/- p.a. in HDFC Tax Saver Fund for the same period. 80000000.00 70000000.00 60000000.00 50000000.00 40000000.00 30000000.00 20000000.00 10000000.00 0.00 Let us see how the investments of both the Investors A & B fared in the last 19 years. The Below table shows the wealth created by Investor A and investor B in the last 19 years. Investor A who Chose PPF, has gathered Rs.67.85 lacs, which is almost 2.38 times the investment made. On the other Side, investor B who chose the HDFC Tax Saver Fund (ELSS) Route has generated a Wealth of Rs. 7.19 Crores, which is almost 25 times the Investment made.
- 16. Current Value PPF Investments HDFC TaxSaver Fund Sensex www.jhaveritrade.com Mutual Fund Can I Really Save Tax And Aim To Earn More At The Same Time? Take the ELSS (sec 80C) Advantage Investment Per Annum 12 Time Horizon 19 19 Investment Made In PPF HDFC TaxSaver(ELSS) 150000 150000 Investment Till Date 28.5 Lacs 28.5 Lacs 67.85 Lacs 7.19 Crores HDFC Tax Saver Fund V/S PPF Period 29/03/1996 31/03/1997 31/03/1998 31/03/1999 31/03/2000 30/03/2001 28/03/2002 31/03/2003 31/03/2004 31/03/2005 31/03/2006 30/03/2007 31/03/2008 31/03/2009 31/03/2010 31/03/2011 30/03/2012 28/03/2013 31/03/2014 Amount Deposited Every Year 150000.00 150000.00 150000.00 150000.00 150000.00 150000.00 150000.00 150000.00 150000.00 150000.00 150000.00 150000.00 150000.00 150000.00 150000.00 150000.00 150000.00 150000.00 150000.00 Total Investments 150000.00 300000.00 450000.00 600000.00 750000.00 900000.00 1050000.00 1200000.00 1350000.00 1500000.00 1650000.00 1800000.00 1950000.00 2100000.00 2250000.00 2400000.00 2550000.00 2700000.00 2850000.00 - 12.00% 12.00% 12.00% 11.00% 9.50% 9.00% 8.00% 8.00% 8.00% 8.00% 8.00% 8.00% 8.00% 8.00% 8.00% 8.60% 8.80% 8.70% 150000.00 318000.00 506160.00 716899.20 945758.11 1185605.13 1442309.59 1707694.36 1994309.91 2303854.70 2638163.08 2999216.13 3389153.42 3810285.69 4265108.55 4756317.23 5315360.51 5933112.24 6599293.00 10.00 9.04 12.40 19.84 41.56 15.72 19.86 18.64 40.12 67.56 131.22 133.88 152.02 97.06 205.68 232.90 223.70 225.33 276.79 150000.00 285600.00 541752.21 1161391.29 3443000.68 2781196.15 3663648.57 3588590.61 7874518.29 13408504.04 26195119.97 26875917.35 30666999.71 19730522.25 41959485.46 47662697.76 45929929.11 46414599.58 57165411.51 3367 3361 3893 3740 5001 3604 3469 3049 5591 6493 11280 13072 15644 9901 17692 19445 17478 18865 22386 Rete of Interest Valuation in PPF Nav Valuation Value as 02/08/2014 - 28,50,000.00 8.70% 67,85,376.11 348.19 7,19,10,607.29 25481
- 17. Commodity Outlook: BULLION & ENERGY Gold’s safe-haven buying dried up after Russia's Defense Ministry said it had finished military exercises near its border with Ukraine. Overall sentiments remain weak while recovery seen in the late session, paring losses on safe-haven buying as equity markets slid. Gold has traded in a tight range around $1,300 over the past few weeks, supported by investor expectations that the Fed could raise rates soon. Gold is usually seen as an insurance against political and financial risk, which burnish its appeal as an alternative investment. Sources had expected jobless claims to rise by 2,000 to 305,000 last week, and the numbers confirmed market expectations for the Federal Reserve to close its monthly bond-buying stimulus program in October and begin hiking interest rates afterwards in 2015. Loose monetary policies such as Fed asset purchases bolster gold by suppressing long term interest rates, which weakens the dollar, bullion’s traditional hedge. Meanwhile, the European Central Bank said it was maintaining its benchmark interest rate at a record-low 0.15%, in line with market expectations. The central bank also held its marginal lending at 0.40% and left its deposit facility rate unchanged at -0.10%.Speaking at the ECB’s post-policy meeting press conference, Draghi said that the central bank will continue to monitor developments closely and will consider all instruments available to support growth. Key resistance at Comex is $1340 & MCX at 28800. Key support at Comex is $1265 and at MCX is at 27400. Crucial resistance is at $20.40 and support is at $18.80. On MCX Crucial resistance is at 44200 and support is at 40800. RECOMMENDATION : BUY SILVER @ 41500 SL 40000 TGT 44500 Crude oil continued its drop towards $92 a barrel with weak economic data clouding the outlook for demand. Germany's economy shrank in the second quarter and France again failed to conjure up any growth, snuffing out any signs of a recovery in the euro zone which is now also weighed down by tit-for-tat sanctions with Russia. The European news came a couple of days after China's implied oil demand dropped 6 percent in July from June as crude runs fell slightly and the world's largest energy consumer exported its highest net volume of fuel so far this year. In the oil producing Middle East, Libya is set to resume oil exports from its largest port, Es Sider, in a few days after being closed for almost a year by protests, a National Oil Corporation official said. Global oil demand growth will accelerate next year as the world economy expands and will again be met by rising supplies from the United States and Canada, further eroding OPEC's market share. But the International Energy Agency (IEA) sQaid in its monthly report that risks to oil production in several regions remained acute. While on the other hand Natural gas too dropped as a break in a U.S. heat wave prompted traders to head for the exits. Updated weather-forecasting models predicted cooler-than normal weather over the next week or so, before warmer weather moves in across much of the Central part of the country over the subsequent 6-10-days. Demand for natural gas tends to fluctuate in the summer based on hot weather and air conditioning use. Inventories rose by 70 billion cubic feet in the same week a year earlier, while the five-year average change is a build of 45 billion cubic feet. Injections of gas into storage have surpassed the five-year average for 19 consecutive weeks, alleviating concerns over tightening supplies. Total U.S. natural gas storage stood at 2.467 trillion cubic feet. Crucial resistance is at $100 and support is at $90 at Nymex. On MCX, resistance is at 6000 and support is at Natural gas is getting support at 222.00 and below same could see a test of 210.00 level, and resistance is www.jhaveritrade.com Commodity Outlook RECOMMENDATION : BUY GOLD @ 27900 SL 27300 TGT 28800 5400. RECOMMENDATION : SELL CRUDE OIL @ 5900 SL 6100 TGT 5400 now likely to be seen at 244.00, a move above could see prices testing 258.00. RECOMMENDATION : SELL NAT.GAS @ 245 SL 258 TGT 218 13 TECHNICAL VIEW GOLD: SILVER: TECHNICAL VIEW CRUDE OIL: NATURAL GAS:
- 18. Commodity Outlook: Base Metals Base metals prices showed mixed node though prices seen underprices dragged by increased supply and lacklustre demand from top consumer China. Buoyant exports from China pushed its trade surplus to a record last month, fuelling optimism that global demand will help counter pressure on the domestic economy from a weakening property sector. Aluminium prices showed more than one and half percent gains on the speculation that the market could remain in deficit beyond 2015 but that historically high global aluminium inventories are likely to prevent much of a rise in prices. Nickel prices dropped by half percent however downside seen limited as support seen after report that Norilsk Nickel, said that refined nickel prices are still too low, particularly if nickel markets are to move into a deficit next year on the expectation that Indonesia’s mineral ore export ban remains in effect. Also support seen after the update that the Ramu nickel and cobalt mine in Papua New Guinea was shut by its Chinese owners after it was attacked by villagers, according to media reports. Nickel inventories in warehouses monitored by the LME extended gains to a record after China, the biggest producer and consumer, shipped more metal out than it imported amid a financing scandal. TECHNICAL VIEW COPPER: Now copper is getting support at 406.00 and below same could see a test of 396.00 level, and resistance is now PROFIT / LOSS MARGIN REQUIRED www.jhaveritrade.com likely to be seen at 428.00, a move above could see prices testing 442.00. RECOMMENDATION : SELL COPPER @ 428 SL 440 TGT 400 NICKEL: Nickel is getting support at 1110 and below same could see a test of 1070 level, and resistance is now likely to be seen at 1170, a move above could see prices testing 1210 . RECOMMENDATION : BUY NICKEL @ 1110 SL 1070 TGT 1200 Zinc is getting support at 136.00 and below same could see a test of 128.00 level, and resistance is now likely to be ZINC: seen at 144.20, a move above could see prices testing 150.00. RECOMMENDATION : BUY ZINC @ 137 SL 133 TGT 148 Lead is getting support at 131.80 and below same could see a test of 126.60 level, and resistance is now likely to be LEAD: seen at 139.20, a move above could see prices testing 145.00. RECOMMENDATION : BUY LEAD @ 132 SL 128 TGT 140 ALUMINIUM: Aluminium is getting support at 118.00 and below same could see a test of 113.20 level, and resistance is now likely to be seen at 127.40, a move above could see prices testing 132.80. RECOMMENDATION : BUY ALUMINIUM @ 119 SL 114 TGT 128 Commodity Outlook STOP LOSS CALLS 14 JULY 2014 CALL PERFORMANCE REPORT COMMODITY GOLD GOLD MINI SILVER SILVER MINI COPPER CRUDE OIL NATURAL GAS NICKEL LEAD ZINC ALUMINIUM TOTAL CALLS 14 1 11 3 13 24 11 6 5 10 8 PROFIT CALLS 10 0 5 0 3 14 5 5 3 8 6 1 0 3 2 2 4 3 0 1 1 0 CALLS NOT ACTIVE 0 1 2 1 4 4 3 0 1 0 1 EARLY EXIT 3 0 1 0 4 2 0 1 0 1 1 67800 0 12000 -2800 3300 64700 6250 17125 13500 24250 23000 138903 0 92460 11313 19437 30909 18356 17309 32909 34733 29100 TOTAL 106 59 17 17 13 229125 425429
- 19. Say... Good Bye to IPO Forms Apply IPO Online Why should I go for Online IPO? How can I capitalize on this Opportunity? Apply in multiple family a/c to maximize allotment Apply on click – First cum first serve basis Greater allotment without any rejection www.jhaveritrade.com I www.jetrade.in • Can be applied anywhere anytime • You can apply IPO against ledger balance / RTGS • Shorter IPO cycle – Total 7-10 days from announcement to allotment • Approx 30 -35 IPO/FPO & ETFs under pipeline in F.Y.2014-15 To get registered for Online IPO, Please contact your branch or SMS “JeTrade IPO” on 9601336677
- 20. Date Time in IST Country/Event 6:30am 7:15am 1:30pm All Day 7:15pm 7:30pm 2:30pm 6:30am 7:15am 1:30pm 2:30pm 7:30pm 5:00pm 5:15pm 5:45pm 6:00pm 1:40pm 7:15pm 7:30pm 8:00pm 8:30pm 6:00pm Tentative All Day 7:00am Tentative 11:00am 5:00pm 7:30pm 7:30pm 8:00pm 11:30pm 7:30am 6:00pm 8:00pm 2:30pm 6:00pm 7:25pm 7:30pm CNY Manufacturing PMI CNY HSBC Final Manufacturing PMI EUR Final Manufacturing PMI USD Bank Holiday USD Final Manufacturing PMI EUR PPI m/m USD ISM Manufacturing PMI USD Construction Spending m/m USD IBD/TIPP Economic Optimism USD ISM Manufacturing Prices CNY Non-Manufacturing PMI CNY HSBC Services PMI EUR Final Services PMI EUR Retail Sales m/m EUR Revised GDP q/q USD Factory Orders m/m EUR Retail PMI USD Challenger Job Cuts y/y EUR Minimum Bid Rate USD ADP Non-Farm Employment Change USD Trade Balance USD Unemployment Claims USD Revised Nonfarm Productivity q/q USD Revised Unit Labor Costs q/q USD Final Services PMI USD ISM Non-Manufacturing PMI USD Natural Gas Storage USD Crude Oil Inventories USD Non-Farm Employment Change USD Unemployment Rate USD Treasury Currency Report CNY Bank Holiday CNY CPI y/y CNY PPI y/y CNY Trade Balance CNY Industrial Production y/y CNY Retail Sales y/y USD NFIB Small Business Index USD JOLTS Job Openings USD Wholesale Inventories m/m USD Crude Oil Inventories USD Federal Budget Balance CNY CB Leading Index m/m USD Unemployment Claims USD Natural Gas Storage EUR Industrial Production m/m EUR Employment Change q/q USD Core Retail Sales m/m USD Retail Sales m/m USD Import Prices m/m USD Prelim UoM Consumer Sentiment USD Prelim UoM Inflation Expectations USD Business Inventories m/m Date Time in IST Country/Event Mon Sep 15 Tue Sep 16 Wed Sep 17 Thu Sep 18 Fri Sep 19 Mon Sep 22 Tue Sep 23 Wed Sep 24 Thu Sep 25 Fri Sep 26 Mon Sep 29 Tue Sep 30 2:30pm 6:00pm 6:45pm 2:30pm 6:00pm 6:30pm 2:30pm 6:00pm 7:30pm 8:00pm 11:30pm 6:00pm 7:30pm 8:00pm 7:30pm 1:30pm 7:30pm 6:30pm 7:30pm 7:15am 7:30pm 8:00pm 1:30pm 6:00pm 7:15pm 8:00pm 6:00pm 7:25pm 6:00pm 7:30pm 1:40pm 2:30pm 6:30pm 7:15pm 7:30pm Trading Options Benefit of Online Trading EUR Trade Balance USD Empire State Manufacturing Index USD Capacity Utilization Rate USD Industrial Production m/m EUR German ZEW Economic Sentiment EUR ZEW Economic Sentiment USD PPI m/m USD Core PPI m/m USD TIC Long-Term Purchases EUR Final CPI y/y EUR Final Core CPI y/y USD Core CPI m/m USD CPI m/m USD Current Account USD NAHB Housing Market Index USD Crude Oil Inventories USD FOMC Statement USD Federal Funds Rate USD Building Permits USD Unemployment Claims USD Housing Starts USD Philly Fed Manufacturing Index USD Natural Gas Storage EUR Current Account USD CB Leading Index m/m EUR Consumer Confidence USD Existing Home Sales USD HPI m/m USD Richmond Manufacturing Index USD New Home Sales USD Crude Oil Inventories CNY HSBC Flash Manufacturing PMI EUR Flash Manufacturing PMI EUR Flash Services PMI USD Core Durable Goods Orders m/m USD Unemployment Claims USD Durable Goods Orders m/m USD Flash Manufacturing PMI USD Flash Services PMI USD Natural Gas Storage USD Final GDP q/q USD Revised UoM Consumer Sentiment USD Revised UoM Inflation Expectations USD Core PCE Price Index m/m USD Personal Spending m/m USD Personal Income m/m USD Pending Home Sales m/m EUR Retail PMI EUR CPI Flash Estimate y/y EUR Core CPI Flash Estimate y/y EUR Unemployment Rate USD S&P/CS Composite-20 HPI y/y USD Chicago PMI USD CB Consumer Confidence Trade Whenever & Wherever Paper Less Trading 100% control Over your Investment Call-N-Trade Facility Quick Technical Support-(Live Chat/support) Mon Sep 1 Tue Sep 2 Wed Sep 3 Thu Sep 4 Fri Sep 5 Mon Sep 8 Tue Sep 9 Wed Sep 10 Thu Sep 11 Fri Sep 12 RRss..00 AAPPPPLLIICCAATTIIOONN CCHHAARRGGEESS 9601336677 301/302, Payal Tower-II, Sayajigunj Vadodara - 390020, Ph.: + 91 265-3071200 Web.: www.jhaveritrade.com I www.jetrade.in For Demo & More Detail Give Missed Call 08049336177 SMS JeTrade to DISCLAIMER : Trading and Investment decision taken on your consultation are solely at the discretion of the traders/investors.We are not liable for any loss, which occur as a result of our recommendations. This document has been prepared on the of publicly available information, internally developed data and other sources believed to be reliable. NSE:INB/F/E 230823233 BSE: INB/F 010823236 NSDL: IN-DP-NSDL-166-2000, MCX-SX: INE 26082333 AMFI ARN 3524 MCX: TM 29040 / FMC REG NO. MCS / TC / CORP / 0963 MCDEX: TM 00749 / FMC REG NO. NCDEX / TCM / CORP / 0736 / NSEL TM 10110* Note: Dealing in Commodity Segment through its group company Jhaveri Credits & capital Ltd. Distributors for IPOs & Mutual Funds. Past performance is not a measure for future returns.