
Recommended
Recommended
More Related Content
What's hot
What's hot (19)
Viewers also liked
Viewers also liked (18)
Similar to medicina
Similar to medicina (20)
medicina
- 1. National Vital Statistics Reports Volume 61, Number 6 October 10, 2012 Deaths: Preliminary Data for 2011 by Donna L. Hoyert, Ph.D., and Jiaquan Xu, M.D., Division of Vital Statistics Abstract Objectives—This report presents preliminary U.S. data on deaths, death rates, life expectancy, leading causes of death, and infant mortality for 2011 by selected characteristics such as age, sex, race, and Hispanic origin. Methods—Data in this report are based on death records com- prising more than 98 percent of the demographic and medical files for all deaths in the United States in 2011. The records are weighted to independent control counts for 2011. Comparisons are made with 2010 final data. Results—The age-adjusted death rate decreased from 747.0 deaths per 100,000 population in 2010 to 740.6 deaths per 100,000 population in 2011. From 2010 to 2011, age-adjusted death rates decreased significantly for 5 of the 15 leading causes of death: Dis- eases of heart, Malignant neoplasms, Cerebrovascular diseases, Alzheimer’s disease, and Nephritis, nephrotic syndrome and nephrosis. The age-adjusted death rate increased for six leading causes of death: Chronic lower respiratory diseases, Diabetes mellitus, Influenza and pneumonia, Chronic liver disease and cirrhosis, Parkinson’s disease, and Pneumonitis due to solids and liquids. Life expectancy remained the same in 2011 as it had been in 2010 at 78.7 years. Keywords: death rates c life expectancy c vital statistics c mortality Introduction This report presents preliminary mortality data for the United States based on vital records for a substantial proportion of deaths occurring in 2011. Statistics in preliminary reports are generally considered reliable; past analyses reveal that most statistics shown in preliminary reports were confirmed by the final statistics for each of those years (1–3). Data Sources and Methods Preliminary data in this report are based on records of deaths that occurred in calendar year 2011, which were received from state vital statistics offices and processed by the Centers for Disease Control and Prevention’s National Center for Health Statistics (NCHS) as of June 12, 2012. Estimates of the level of completeness of preliminary data for each state are shown in Table I (see Technical Notes). Detailed information on the nature, sources, and qualifica- tions of the preliminary data is given in the Technical Notes. Each state vital statistics office reported to NCHS the number of deaths registered and processed for calendar year 2011. Those state counts were used as independent control counts for NCHS’ 2011 preliminary national mortality file. A comparison of a) the number of 2011 death records received from the states for processing by NCHS with b) the state’s independent control counts of the number of deaths in 2011 indicates that demographic information from death certificates for the United States was available for an estimated 98.9 percent of infant deaths (under age 1 year) and 99.4 percent of deaths of persons aged 1 year and over occurring in calendar year 2011 (see Table I in the Technical Notes). Medical (or cause-of-death) information, pro- cessed separately, was available for an estimated 97.3 percent of infant deaths and 98.1 percent of deaths of persons aged 1 year and over in 2011. Cause-of-death information is not always available when prelimi- nary data are sent to NCHS, but is available later for final data processing. As a result, estimates of cause of death based on pre- liminary mortality data may differ from statistics developed from the final mortality data (see Tables II and III in the Technical Notes). Such differences may affect certain causes of death where the cause is pending investigation, such as for Assault (homicide), Intentional self- harm (suicide), Accidents (unintentional injuries), Drug-induced deaths, and Sudden infant death syndrome (SIDS); see ‘‘Nonsampling error’’ in the Technical Notes. Tabulations by race and ethnic group are based on the race and ethnic group reported for the decedent. Race and Hispanic origin are reported as separate items on the death certificate. Data are shown for the following race and ethnic groups: white, non-Hispanic white, black, non-Hispanic black, American Indian or Alaska Native (AIAN), Asian or Pacific Islander (API), and Hispanic populations. Death rates for AIAN, API, and, to a lesser extent, Hispanic populations are known to be too low because of reporting problems (see ‘‘Race and Hispanic origin’’ in the Technical Notes). U.S. DEPARTMENT OF HEALTH AND HUMAN SERVICES Centers for Disease Control and Prevention National Center for Health Statistics National Vital Statistics System
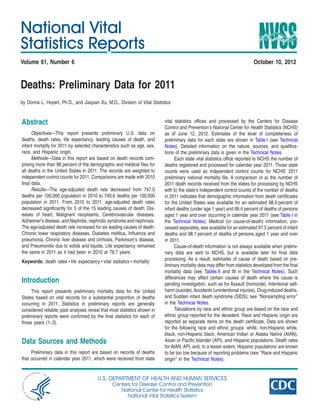
- 2. 2 National Vital Statistics Reports, Vol. 61, No. 6, October 10, 2012 All comparisons in this report are between the 2010 final data (3) and the 2011 preliminary data. Changes in death rates from 2010 to 2011 were tested for statistical significance. Differences in death rates across demographic groups (but occurring in 2011 only) were also tested for statistical significance. Unless otherwise specified, reported differences in death rates are statistically significant. Age-adjusted death rates are better indicators than crude death rates for showing changes in the risk of death over time when the age distribution of the population is changing, and for comparing the mortality of population subgroups that have different age compositions. All age-adjusted death rates are standardized to the year 2000 popu- lation (see ‘‘Computing rates and percentages’’ in the Technical Notes). Life expectancy data shown in this report for data years 2010–2011 are based on methodology similar to that of the 1999–2001 decennial life tables. Beginning with final data reported for 2008, the life table methodology was revised by changing the smoothing tech- nique used to estimate the life table functions at the oldest ages; see Technical Notes (1). The methodology used to produce life expectan- cies adjusts for misclassification for Hispanic and for race and ethnicity for the non-Hispanic populations (see ‘‘Life tables’’ in the Technical Notes). Adjustments do not account for other sources of error such as return migration (4). Note that adjustments for misclassification are applied to the production of the life tables, but not to the death rates shown in this report. Two measures of infant mortality are shown: the infant death rate and the infant mortality rate (see ‘‘Infant mortality’’ in the Technical Notes). These measures typically are similar, although they can differ because they have different denominators. Results Trends in numbers and rates The preliminary number of deaths in the United States for 2011 was 2,513,171 (Tables A and 1). The crude death rate of 806.6 per 100,000 population was 0.9 percent higher than the rate of 799.5 per 100,000 in 2010. The estimated age-adjusted death rate, which accounts for changes in the age distribution of the population, reached a record low of 740.6 per 100,000 U.S. standard population, 0.9 percent lower than the 2010 rate of 747.0 (Tables A and 1). Figure 1 illustrates the general pattern of decline in both crude and age-adjusted death rates since 1980. The age-adjusted death rate decreased from 2010 to 2011 by 1.4 percent for males and 0.5 percent for females. The relative magnitudes of significant changes in age-adjusted death rates by sex, race, and Hispanic origin (Table 1) are: + White males—1.0 percent decrease + Non-Hispanic white males—0.6 percent decrease + Black males—3.3 percent decrease + Black females—1.6 percent decrease + Non-Hispanic black males—2.7 percent decrease + Non-Hispanic black females—1.2 percent decrease + AIAN males—5.9 percent decrease + AIAN females—3.7 percent decrease + API males—4.2 percent decrease + API females—2.6 percent decrease + Hispanic males—4.8 percent decrease + Hispanic females—2.5 percent decrease Rates for the AIAN and API populations should be interpreted with caution because of inconsistencies between reporting race on death certificates and on censuses, surveys, and birth certificates. Note that mortality for races other than white and black may be seriously understated in some cases due to underreporting for some race groups and Hispanic origin on death certificates (4–6). Statistically significant decreases in mortality from 2010 to 2011 were registered for those under age 1 year and across age groups over 65 years. Decedents aged 25–34 experienced the only statistically significant increase. Mortality for age groups 1–4 years, 5–14 years, 15–24 years, 35–44 years, 45–54 years, and 55–64 years did not change significantly. The magnitude of the significant changes in mortality by age group is (Table 1): + Under 1 year—4.0 percent decrease + 25–34 years—1.5 percent increase + 65–74 years—1.6 percent decrease + 75–84 years—0.8 percent decrease + 85 years and over—1.2 percent decrease The death rate for ‘‘under 1 year’’ shown above is based on a population estimate and is different from the infant mortality rate, which is based on live births (see ‘‘Infant mortality’’). The preliminary estimate of life expectancy at birth for the total population in 2011 is 78.7 years. This is the same as in 2010 (Tables A and 6). Life expectancy for males increased 0.1 year, from 76.2 in 2010 to 76.3 in 2011. Female life expectancy also increased 0.1 year, from 81.0 years to 81.1 years. (Life expectancy from 2010 to 2011 differed for the male and female populations but was unchanged for both sexes combined due to rounding.) The difference between male and female life expectancy at birth has generally been decreasing since its peak of 7.8 years in 1979 (1,7). The gap between male and female life expectancy was 4.8 years in 2011, unchanged from the difference between the sexes in 2010. The difference in life expectancy between the white and black populations in 2011 was 3.7 years, a 0.1-year decrease from the 2010 gap between the two races (Table A). Life expectancy for the Hispanic population increased 0.2 year in 2011 to 81.4 years compared with 2010 (Table 6). In 2011, the life expectancy for the Hispanic female population was 83.7 years. The life expectancy for the Hispanic male population in 2011 was 78.9. The difference in life expectancy between the sexes for the Hispanic population was 4.8 years. Among the six Hispanic origin-race-sex groups (Table 6 and Figure 2), Hispanic females have the highest life expectancy at birth (83.7 years), followed by non-Hispanic white females (81.1 years), Hispanic males (78.9 years), non-Hispanic black females (77.8 years), non-Hispanic white males (76.4 years), and non-Hispanic black males (71.6 years). Figure 2 also shows that this pattern has not changed since 2006 although life expectancy for all groups has generally increased. By state of residence, Hawaii had the lowest mortality in 2011 with an age-adjusted death rate of 584.8 deaths per 100,000 standard population (Table 3). Mortality was highest in Mississippi, with an age-adjusted death rate of 956.2 per 100,000 standard population.
- 3. 3National Vital Statistics Reports, Vol. 61, No. 6, October 10, 2012 Causes of death The leading causes of death in 2011 remained the same as in 2010 for the 15 leading causes, although two causes exchanged ranks. Nephritis, nephrotic syndrome and nephrosis, the eighth leading cause in 2010, became the ninth leading cause in 2011, while Influenza and pneumonia, the ninth leading cause in 2010, became the eighth leading cause of death in 2011. The 15 leading causes of death in 2011 (Table B) were as follows: 1. Diseases of heart 2. Malignant neoplasms 3. Chronic lower respiratory diseases 4. Cerebrovascular diseases 5. Accidents (unintentional injuries) 6. Alzheimer’s disease 7. Diabetes mellitus Table A. Deaths, age-adjusted death rates, and life expectancy at birth, by race and sex; and infant deaths and mortality rates, by race: United States, final 2010 and preliminary 2011 [Data are based on a continuous file of records received from the states. Figures for 2011 are based on weighted data rounded to the nearest individual, so categories may not add to totals] All races1 White2 Black2 Measure and sex 2011 2010 2011 2010 2011 2010 All deaths . . . . . . . . . . . . . . . . . . Male . . . . . . . . . . . . . . . . . . . . Female . . . . . . . . . . . . . . . . . . Age-adjusted death rate3 . . . . . . . . . Male . . . . . . . . . . . . . . . . . . . . Female . . . . . . . . . . . . . . . . . . 2,513,171 1,253,716 1,259,456 740.6 874.5 631.9 2,468,435 1,232,432 1,236,003 747.0 887.1 634.9 2,153,864 1,070,817 1,083,046 738.1 869.3 629.7 2,114,749 1,051,514 1,063,235 741.8 878.5 630.8 290,135 146,843 143,292 877.4 1,067.3 740.1 286,959 145,802 141,157 898.2 1,104.0 752.5 Life expectancy at birth (in years) . . . . Male . . . . . . . . . . . . . . . . . . . . Female . . . . . . . . . . . . . . . . . . 78.7 76.3 81.1 78.7 76.2 81.0 79.0 76.6 81.3 78.9 76.5 81.3 75.3 72.1 78.2 75.1 71.8 78.0 All infant deaths . . . . . . . . . . . . . . Infant mortality rate4 . . . . . . . . . . . . 23,910 6.05 24,586 6.15 15,438 5.11 15,954 5.20 7,234 11.42 7,401 11.63 1 Includes races other than white and black. 2 Race categories are consistent with the 1977 Office of Management and Budget (OMB) standards. Multiple-race data were reported for deaths by 38 states and the District of Columbia in 2011 and by 37 states and the District of Columbia in 2010, and were reported for births (used as the denominator in computing infant mortality rates), by 40 states and the District of Columbia in 2011 and by 38 states and the District of Columbia in 2010; see Technical Notes. The multiple-race data for these reporting areas were bridged to the single-race categories of the 1977 OMB standards for comparability with other reporting areas; see Technical Notes. 3 Age-adjusted death rates are per 100,000 U.S. standard population, based on the year 2000 standard. 4 Infant mortality rates are deaths under age 1 year per 1,000 live births in specified group. Figure 2. Life expectancy at birth, by Hispanic origin, race for non-Hispanic population, and sex: United States, 2006–2010 final and 2011 preliminary 0 70 75 80 85 Non-Hispanic black female Non-Hispanic black male Non-Hispanic white female Non-Hispanic white male Hispanic female Hispanic male All races, both sexes 2011201020092008 Year 20072006 Ageinyears SOURCE: CDC/NCHS, National Vital Statistics System, Mortality. Figure 1. Crude and age-adjusted death rates: United States, 1980–2010 final and 2011 preliminary 0 700 800 900 1,000 1,100 Age adjusted Crude 2011 2010200520001995199019851980 Rateper100,000population NOTE: Crude death rates on an annual basis are per 100,000 population; age-adjusted rates are per 100,000 U.S. standard population; rates for 2001–2009 are revised and may differ from the rates previously published; see Technical Notes. SOURCE: CDC/NCHS, National Vital Statistics System, Mortality. Year
- 4. 4 National Vital Statistics Reports, Vol. 61, No. 6, October 10, 2012 8. Influenza and pneumonia 9. Nephritis, nephrotic syndrome and nephrosis 10. Intentional self-harm (suicide) 11. Septicemia 12. Chronic liver disease and cirrhosis 13. Essential hypertension and hypertensive renal disease 14. Parkinson’s disease 15. Pneumonitis due to solids and liquids From 2010 to 2011, the age-adjusted death rate declined significantly for 5 of the 15 leading causes of death. The age-adjusted death rate for the leading cause of death, Diseases of heart, decreased by 3.0 percent. The age-adjusted death rate for Malignant neoplasms decreased by 2.4 percent (Tables B and 2). Deaths from these two diseases combined accounted for 47 percent of deaths in the United States in 2011. Heart disease mortality has exhibited a fairly steady decline since 1980, and cancer mortality began to decline in the early 1990s (8). Of the 15 leading causes of death, the age-adjusted death rate also decreased significantly for Cerebrovas- cular diseases (3.1 percent), Alzheimer’s disease (2.0 percent), and Nephritis, nephrotic syndrome and nephrosis (12.4 percent). The decrease in deaths from Nephritis, nephrotic syndrome and nephrosis from 2010 to 2011 needs to be interpreted with caution, however. Changes in classification and coding were made in 2011 that contributed to the decrease. Renal failure, for example, mentioned on death certificates was more likely to be treated as a renal complication of other diseases on the death certificate in 2011. As a result, more of these records shift from the Nephritis, nephrotic syndrome and neph- rosis category to other diseases (e.g., Diabetes mellitus with renal complications, which is part of the broader Diabetes mellitus category). The age-adjusted death rate increased significantly from 2010 to 2011 for six leading causes: Chronic lower respiratory diseases (1.2 percent), Diabetes mellitus (3.4 percent), Influenza and pneu- monia (4.0 percent), Chronic liver disease and cirrhosis (3.2 percent), Parkinson’s disease (2.9 percent), and Pneumonitis due to solids and liquids (3.9 percent). The observed changes in the age-adjusted death rates from 2010 to 2011 were not significant for Accidents (unintentional injuries), Inten- tional self-harm (suicide), Septicemia, and Essential hypertension and hypertensive renal disease. Although Human immunodeficiency virus (HIV) disease was not among the 15 leading causes of death in 2011 for all ages combined, it remains a public health concern, especially for those between the ages of 15 and 64. The age-adjusted death rate for HIV disease declined by 7.7 percent from 2010 to 2011 (Table 2). Following a period of increase from 1987 through 1994, HIV disease mortality reached a plateau in 1995. Subsequently, the rate for this disease decreased an average of 33.0 percent per year from 1995 through 1998 (9), and 6.5 percent per year from 1999 through 2010 (data not shown). For all races combined in the age group 15–24, HIV disease was the 12th leading cause of death in 2010 and 2011. HIV disease dropped from Table B. Deaths and death rates for 2011 and age-adjusted death rates and percentage changes in age-adjusted rates from 2010 to 2011 for the 15 leading causes of death in 2011: United States, final 2010 and preliminary 2011 [Data are based on a continuous file of records received from the states. Rates are per 100,000 population; age-adjusted rates per 100,000 U.S. standard population based on the year 2000 standard; see Technical Notes. For explanation of asterisks (*) preceding cause-of-death codes, see Technical Notes. Figures for 2011 are based on weighted data rounded to the nearest individual, so categories may not add to totals] Age-adjusted death rate Cause of death (based on the International Classification of Diseases, Death Percent Rank1 Tenth Revision, 2008 Edition, 2009) Number rate 2011 2010 change . . . All causes . . . . . . . . . . . . . . . . . . . . . . . . . . . . . . . . . . . . . . . . . . . . . . . . . . . . . . . . . . . . 2,512,873 806.5 740.6 747.0 -0.9 1 Diseases of heart . . . . . . . . . . . . . . . . . . . . . . . . . . . . . . . . . . . . . . . . . . (I00–I09,I11,I13,I20–I51) 596,339 191.4 173.7 179.1 –3.0 2 Malignant neoplasms . . . . . . . . . . . . . . . . . . . . . . . . . . . . . . . . . . . . . . . . . . . . . . . . (C00–C97) 575,313 184.6 168.6 172.8 –2.4 3 Chronic lower respiratory diseases . . . . . . . . . . . . . . . . . . . . . . . . . . . . . . . . . . . . . . . . .(J40–J47) 143,382 46.0 42.7 42.2 1.2 4 Cerebrovascular diseases . . . . . . . . . . . . . . . . . . . . . . . . . . . . . . . . . . . . . . . . . . . . . . (I60–I69) 128,931 41.4 37.9 39.1 –3.1 5 Accidents (unintentional injuries) . . . . . . . . . . . . . . . . . . . . . . . . . . . . . . . . . . (V01–X59,Y85–Y86)2,3 122,777 39.4 38.0 38.0 0.0 6 Alzheimer’s disease. . . . . . . . . . . . . . . . . . . . . . . . . . . . . . . . . . . . . . . . . . . . . . . . . . . . (G30) 84,691 27.2 24.6 25.1 –2.0 7 Diabetes mellitus . . . . . . . . . . . . . . . . . . . . . . . . . . . . . . . . . . . . . . . . . . . . . . . . . . (E10–E14) 73,282 23.5 21.5 20.8 3.4 8 Influenza and pneumonia . . . . . . . . . . . . . . . . . . . . . . . . . . . . . . . . . . . . . . . . . . . . . (J09–J18)4 53,667 17.2 15.7 15.1 4.0 9 10 Nephritis, nephrotic syndrome and nephrosis . . . . . . . . . . . . . . . . . . . . . .(N00–N07,N17–N19,N25–N27)5 Intentional self-harm (suicide) . . . . . . . . . . . . . . . . . . . . . . . . . . . . . . . . . . . (*U03,X60–X84,Y87.0)2 45,731 38,285 14.7 12.3 13.4 12.0 15.3 12.1 –12.4 –0.8 11 Septicemia . . . . . . . . . . . . . . . . . . . . . . . . . . . . . . . . . . . . . . . . . . . . . . . . . . . . . . (A40–A41) 35,539 11.4 10.5 10.6 –0.9 12 Chronic liver disease and cirrhosis . . . . . . . . . . . . . . . . . . . . . . . . . . . . . . . . . . . . . (K70,K73–K74) 33,539 10.8 9.7 9.4 3.2 13 Essential hypertension and hypertensive renal disease . . . . . . . . . . . . . . . . . . . . . . . . . . . (I10,I12,I15) 27,477 8.8 8.0 8.0 0.0 14 Parkinson’s disease. . . . . . . . . . . . . . . . . . . . . . . . . . . . . . . . . . . . . . . . . . . . . . . . (G20–G21)6 23,107 7.4 7.0 6.8 2.9 15 Pneumonitis due to solids and liquids . . . . . . . . . . . . . . . . . . . . . . . . . . . . . . . . . . . . . . . . . (J69) 18,090 5.8 5.3 5.1 3.9 . . . All other causes . . . . . . . . . . . . . . . . . . . . . . . . . . . . . . . . . . . . . . . . . . . . . . . . . . . . (residual) 512,723 164.6 . . . . . . . . . . . .Category not applicable. 1 Rank based on number of deaths. 2 For unintentional injuries, suicides, preliminary and final data may differ significantly because of the truncated nature of the preliminary file. 3 New ICD–10 subcategories were introduced for the existing X34 (Victim of earthquake); see Technical Notes. 4 New ICD–10 code J12.3 (Human metapneumovirus pneumonia) was added to the category in 2011; see Technical Notes. 5 New subcategories replaced previous ones for N18 (Chronic kidney disease) in 2011. Changes affect comparability with previous year’s data; see Technical Notes. 6 New ICD–10 code G21.4 (Vascular parkinsonism) was added to the category in 2011; see Technical Notes. NOTES: Data are subject to sampling and random variation. For information regarding the calculation of standard errors and further discussion of the variability of the data, see Technical Notes.
- 5. 5National Vital Statistics Reports, Vol. 61, No. 6, October 10, 2012 the seventh leading cause of death in 2010 to the eighth leading cause in 2011 for the age group 25–44. Among decedents aged 45–64, HIV disease remained the 13th leading cause in 2011, unchanged from its rank in 2010. Enterocolitis due to Clostridium difficile (C. difficile), a predomi- nantly antibiotic-associated inflammation of the intestines caused by C. difficile, a gram-positive, anaerobic, spore-forming bacillus, has become a concern in recent years. The disease is often acquired by long-term patients or residents in hospitals or other health-care facilities and accounted for an increasing number of deaths between 1999 and 2008 (1,10,11). In 1999, 793 deaths were due to C. difficile, compared with 7,476 C. difficile deaths in 2008 (1). The number of deaths dropped slightly to 7,251 in 2009 and increased to 7,994 in 2011. The age- adjusted death rate for this cause in 2011 was 2.4 deaths per 100,000 standard population, an increase of 9.1 percent from the rate in 2010. In 2011, C. difficile ranked as the 17th leading cause of death for the population aged 65 and over. Approximately 91 percent of deaths from C. difficile occurred to people aged 65 and over (data not shown). The age-adjusted death rate for drug-induced deaths did not change significantly, according to preliminary data. However, the final number of drug-induced deaths in 2011 may be substantially higher because information on cause of death in these cases is often delayed pending investigation. Additional information based on toxicology or autopsy reports is often not available in the preliminary file. Mortality from firearm injuries and alcohol-induced deaths in 2011 was unchanged from 2010. The age-adjusted death rate for injury at work in 2011 decreased 5.9 percent from the final rate of 1.7 in 2010 to 1.6 in 2011 (Table 2). Infant mortality The preliminary infant mortality rate for 2011 was 6.05 infant deaths per 1,000 live births (Tables A and 4). This was not signifi- cantly different from the final 2010 rate of 6.15. Few observed changes in infant mortality from 2010 to 2011 were statistically significant. With the exception of 2002, the infant mortality rate has statistically remained the same or decreased significantly each successive year from 1958 through 2011 (1,12). The neonatal (i.e., infants under age 28 days) mortality rate was 4.04 per 1,000 live births in 2011, which also was not significantly different from 2010. The postneonatal (i.e., infants aged 28 days–11 months) mortality rate decreased by 4.3 percent from 2.10 deaths per 1,000 live births in 2010 to 2.01 deaths per 1,000 live births in 2011. Infant mortality did not change significantly from 2010 to 2011 for either black or white infants. The mortality rate of 11.42 deaths per 1,000 live births for black infants was 2.2 times the rate of 5.11 deaths per 1,000 live births for white infants (Tables A and 4). Because of inconsistencies in the reporting of race groups on birth and death certificates (especially for races other than white and black and for Hispanic origin), infant mortality rates for these groups are likely to be underestimated (4). The linked birth/infant death data set provides a better source of data for infant deaths and mortality rates by maternal race and ethnicity (13). Although the infant mortality rate is the preferred indicator of the risk of dying during the first year of life, the infant death rate is also shown in this report. While similar, these two rates vary based on differences in their denominators. The denominator of the 2011 infant death rate is the estimated population under age 1 year as of the reference date, July 1, 2011 (14). This population estimate includes a combination of infants born in 2010 who had not reached their first birthday before July 1, 2011, and infants born in 2011 before July 1, 2011. In contrast, the denominator of the 2011 infant mortality rate is all live births occurring during 2011 (15). For example, the preliminary number of live births for 2011 (n = 3,953,593) is 1.1 percent lower than the July 1 infant population in 2011 (n = 3,996,537). Therefore, the infant mortality rate for 2011 (604.7 deaths per 100,000 live births) is higher than the infant death rate for 2011 (598.3 deaths per 100,000 population). For 2011, only the infant death rate decreased significantly from 2010. The 10 leading causes of infant mortality for 2011 were: 1. Congenital malformations, deformations and chromosomal abnormalities 2. Disorders related to short gestation and low birth weight, not elsewhere classified 3. Sudden infant death syndrome (SIDS) 4. Newborn affected by maternal complications of pregnancy 5. Accidents (unintentional injuries) 6. Newborn affected by complications of placenta, cord and membranes 7. Bacterial sepsis of newborn 8. Respiratory distress of newborn 9. Diseases of the circulatory system 10. Neonatal hemorrhage The leading causes of infant death in 2011 were the same as in 2009. They were the same as in 2010 for 9 of the 10 leading causes (Table 8). Dropping from among the 10 leading causes of infant death in 2011 was Necrotizing enterocolitis of newborn, replaced by Neonatal hemorrhage as the 10th leading cause of infant death in 2011. The infant mortality rate decreased for only 1 of the 10 leading causes of death from 2010 to 2011 (Tables 5 and 8). The infant mortality rate decreased by 16.1 percent for SIDS (Tables 5 and 8). Deaths due to SIDS, currently the third leading cause of infant death, have been declining since 1988 (1,16). Because SIDS deaths often involve lengthy investigations, the mortality rate due to SIDS is typically lower based on preliminary data than that based on the final data. Recent declines in mortality due to SIDS also may reflect a change in the way SIDS is diagnosed and reported by medical exam- iners and coroners (17). References 1. Miniño AM, Murphy SL, Xu JQ, Kochanek KD. Deaths: Final data for 2008. National vital statistics reports; vol 59 no 10. Hyattsville, MD: National Center for Health Statistics. 2011. Available from: http://www.cdc.gov/nchs/data/nvsr/nvsr59/nvsr59_10.pdf. 2. Kochanek KD, Xu JQ, Murphy SL, et al. Deaths: Final data for 2009. National vital statistics reports; vol 60 no 3. Hyattsville, MD: National Center for Health Statistics. 2011. Available from: http://www.cdc.gov/nchs/data/nvsr/nvsr60/nvsr60_03.pdf.
- 6. 6 National Vital Statistics Reports, Vol. 61, No. 6, October 10, 2012 3. Murphy SL, Kochanek KD. Deaths: Final data for 2010. National vital statistics reports; vol 61 no 4. Hyattsville, MD: National Center for Health Statistics. Forthcoming. 4. Arias E, Schauman WS, Eschbach K, et al. The validity of race and Hispanic origin reporting on death certificates in the United States. National Center for Health Statistics. Vital Health Stat 2(148). 2008. Available from: http://www.cdc.gov/nchs/data/series/sr_02/ sr02_148.pdf. 5. Sorlie PD, Rogot E, Johnson NJ. Validity of demographic characteris- tics on the death certificate. Epidemiology 3(2):181–4. 1992. 6. Rosenberg HM, Maurer JD, Sorlie PD, et al. Quality of death rates by race and Hispanic origin: A summary of current research, 1999. National Center for Health Statistics. Vital Health Stat 2(128). 1999. Available from: http://www.cdc.gov/nchs/data/series/sr_02/ sr02_128.pdf. 7. Arias E. United States life tables, 2008. National vital statistics reports; vol 61 no 3. Hyattsville, MD: National Center for Health Statistics. 2012. Available from: http//www.cdc.gov/nchs/data/nvsr/nvsr61/ nvsr61_03.pdf. 8. Xu JQ, Kochanek KD, Murphy SL, Tejada-Vera B. Deaths: Final data for 2007. National vital statistics reports; vol 58 no 19. Hyattsville, MD: National Center for Health Statistics. 2010. Available from: http://www.cdc.gov/nchs/data/nvsr/nvsr58/nvsr58_19.pdf. 9. National Center for Health Statistics. Hist293. Age-adjusted death rates for 72 selected causes by race and sex using year 2000 standard population: United States, 1979–98. 2001. Available from: http://www.cdc.gov/nchs/data/mortab/aadr7998s.pdf. 10. Sunenshine RH, McDonald LC. Clostridium difficile-associated disease: New challenges from an established pathogen. Cleve Clin J Med 73(2):187–97. 2006. Available from: http://www.ccjm.org/content/ 73/2/187.full.pdf+html. 11. Redelings MD, Sorvillo F, Mascola L. Increase in Clostridium difficile- related mortality rates, United States, 1999–2004. Emerg Infect Dis 13(9):1417–19. 2007. Available from: http://www.cdc.gov/EID/content/ 13/9/1417.htm. 12. Kochanek KD, Martin JA. Supplemental analyses of recent trends in infant mortality. Health E-Stat. Hyattsville, MD: National Center for Health Statistics. Available from: http://www.cdc.gov/nchs/data/hestat/ infantmort/infantmort.htm. 13. Mathews TJ, MacDorman MF. Infant mortality statistics from the 2008 period linked birth/infant death data set. National vital statistics reports; vol 60 no 5. Hyattsville, MD: National Center for Health Statistics. 2012. Available from: http://www.cdc.gov/nchs/data/nvsr/nvsr60/ nvsr60_05.pdf. 14. National Center for Health Statistics. Vintage 2011 bridged-race post- censal population estimates. Available from: http://www.cdc.gov/nchs/ nvss/bridged_race/data_documentation.htm#vintage2011. 15. Hamilton BE, Martin JA, Ventura SJ. Births: Preliminary data for 2011. National vital statistics reports; vol 61 no 5. Hyattsville, MD: National Center for Health Statistics. 2012. Available from: http://www.cdc.gov/nchs/data/nvsr/nvsr61/nvsr61_05.pdf. 16. Murphy SL. Deaths: Final data for 1998. National vital statistics reports; vol 48 no 11. Hyattsville, MD: National Center for Health Statistics. 2000. Available from: http://www.cdc.gov/nchs/data/nvsr/nvsr48/ nvs48_11.pdf. 17. Shapiro-Mendoza CK, Tomashek KM, Anderson RN, Wingo J. Recent national trends in sudden, unexpected infant deaths: More evidence supporting a change in classification or reporting. Am J Epidemiol 163(8):762–9. 2006. 18. National Center for Health Statistics. Vital statistics of the United States: Mortality, 1999. Technical appendix. Available from: http://www.cdc.gov/nchs/data/statab/techap99.pdf. 19. National Center for Health Statistics. 2003 revision of the U.S. Standard Certificate of Death. 2003. Available from: http://www.cdc.gov/nchs/data/dvs/DEATH11-03final-acc.pdf. 20. National Center for Health Statistics. Report of the panel to evaluate the U.S. standard certificates. 2000. Available from: http://www.cdc.gov/nchs/data/dvs/panelreport_acc.pdf. 21. Office of Management and Budget. Revisions to the standards for the classification of federal data on race and ethnicity. Fed Regist (62 FR58782–58790). October 30, 1997. 22. Office of Management and Budget. Race and ethnic standards for federal statistics and administrative reporting. Statistical Policy Direc- tive 15. 1977. 23. Ingram DD, Parker JD, Schenker N, et al. United States census 2000 population with bridged race categories. National Center for Health Statistics. Vital Health Stat 2(135). 2003. Available from: http://www.cdc.gov/nchs/data/series/sr_02/sr02_135.pdf. 24. Schenker N, Parker JD. From single-race reporting to multiple-race reporting: Using imputation methods to bridge the transition. Stat Med 22(9):1571–87. 2003. 25. Vital statistics, instructions for classifying the underlying cause of death. NCHS instruction manual, part 2a. Hyattsville, MD: Public Health Service. Published annually. 26. World Health Organization. International statistical classification of diseases and related health problems, tenth revision. Geneva: World Health Organization. 1992. 27. World Health Organization. International statistical classification of diseases and related health problems, tenth revision, 2008 edition. Geneva: World Health Organization. 2009. 28. National Center for Health Statistics. ICD–10 Cause-of-death lists for tabulating mortality statistics, updated March 2011. NCHS instruction manual, part 9. Hyattsville, MD: Public Health Service. 2011. Available from: http://www.cdc.gov/nchs/nvss/instruction_manuals.htm. 29. Heron, M. Deaths: Leading causes for 2008. National vital statistics reports; vol 60 no 6. Hyattsville, MD: National Center for Health Statistics. 2012. Available from: http://www.cdc.gov/nchs/data/nvsr/ nvsr60/nvsr60_06.pdf. 30. National Center for Health Statistics. U.S. decennial life tables for 1989–91, vol 1 no 2, methodology of the national and state life tables. Hyattsville, MD. 1998. Available from: http://www.cdc.gov/nchs/data/ lifetables/life89_1_2.pdf. 31. Sirken MG. Comparison of two methods of constructing abridged life tables by reference to a ‘‘standard’’ table. National Center for Health Statistics. Vital Health Stat 2(4): 1966. Available from: http://www.cdc.gov/nchs/data/series/sr_02/sr02_004.pdf. 32. Anderson RN. Method for constructing complete annual U.S. life tables. National Center for Health Statistics. Vital Health Stat 2(129). 1999. Available from: http://www.cdc.gov//nchs/data/series/sr_02/ sr02_129.pdf. 33. Kestenbaum B. A description of the extreme aged population based on improved Medicare enrollment data. Demography 29(4):565–80. 1992. 34. Wei R, Curtin LR, Arias E, Anderson RN. United States decennial life tables for 1999–2001, methodology of the United States life tables. National vital statistics reports; vol 57 no 4. Hyattsville, MD: National Center for Health Statistics. 2008. Available from: http://www.cdc.gov/nchs/data/nvsr/nvsr57/nvsr57_04.pdf. 35. Arias E, Rostron BL, Tejada-Vera B. United States life tables, 2005. National vital statistics reports; vol 58 no 10. Hyattsville, MD: National Center for Health Statistics. 2010. Available from: http://www.cdc.gov/nchs/data/nvsr/nvsr58/nvsr58_10.pdf. 36. Arias E. United States life tables by Hispanic origin. National Center for Health Statistics. Vital Health Stat 2(152). 2010. Available from: http://www.cdc.gov/nchs/data/series/sr_02/sr02_152.pdf.
- 7. 7National Vital Statistics Reports, Vol. 61, No. 6, October 10, 2012 37. Arias E, Eschbach K, Schauman WS, Backlund EL, Sorlie PD. The Hispanic mortality advantage and ethnic misclassification on US death certificates. Am J Public Health 100(Suppl1):S171–7. 2010. Available from: http://ajph.aphapublications.org/doi/pdfplus/10.2105/AJPH.2008. 135863. 38. Anderson RN, Rosenberg HM. Age standardization of death rates: Implementation of the year 2000 standard. National vital statistics reports; vol 47 no 3. Hyattsville, MD: National Center for Health Statistics. 1998. Available from: http://www.cdc.gov/nchs/data/nvsr/ nvsr47/nvs47_03.pdf. List of Detailed Tables 1. Deaths and death rates, by age, sex, race, and Hispanic origin, and age-adjusted death rates, by sex, race, and Hispanic origin: United States, final 2010 and preliminary 2011 . . . . . . . . . . . . 8 2. Deaths, death rates, and age-adjusted death rates for 113 selected causes, Injury by firearms, Drug-induced deaths, Alcohol-induced deaths, Injury at work, and Enterocolitis due to Clostridium difficile: United States, final 2010 and preliminary 2011 . . . . . . . . . . . . . . . . . . . . . . . . . . . . . . . . . . . . . . . . 16 3. Deaths, death rates, and age-adjusted death rates: United States, and each state and territory, final 2010 and preliminary 2011. . . 20 4. Infant deaths and infant mortality rates, by age, race, and Hispanic origin: United States, final 2010 and preliminary 2011 . . . . . . . . . . . . . . . . . . . . . . . . . . . . . . . . . . . . . . . . 21 5. Infant deaths and infant mortality rates for 130 selected causes: United States, final 2010 and preliminary 2011 . . . . . . . . . . . . 22 6. Expectation of life at selected ages, by race, Hispanic origin, race for non-Hispanic population, and sex: United States, final 2010 and preliminary 2011 . . . . . . . . . . . . . . . . . . . . . . . . . . . . . 26 7. Deaths and death rates for the 10 leading causes of death in specified age groups: United States, preliminary 2011 . . . . . . . 29 8. Infant deaths and infant mortality rates for the 10 leading causes of infant death, by race and Hispanic origin: United States, preliminary 2011 . . . . . . . . . . . . . . . . . . . . . . . . . . . . . . . . 32
- 8. 8 National Vital Statistics Reports, Vol. 61, No. 6, October 10, 2012 Table 1. Deaths and death rates, by age, sex, race, and Hispanic origin, and age-adjusted death rates, by sex, race, and Hispanic origin: United States, final 2010 and preliminary 2011 [Data are based on a continuous file of records received from the states. Age-specific rates are per 100,000 population in specified group. Age-adjusted rates are per 100,000 U.S. standard population; see Technical Notes. Figures for 2011 are based on weighted data rounded to the nearest individual, so categories may not add to totals. Race and Hispanic origin are reported separately on the death certificate. Data for Hispanic origin and specified races other than white and black should be interpreted with caution because of inconsistencies between reporting Hispanic origin and race on death certificates and on censuses and surveys; see Technical Notes. Race categories are consistent with the 1977 Office of Management and Budget (OMB) standards. Multiple-race data were reported by 38 states and the District of Columbia in 2011 and by 37 states and the District of Columbia in 2010; see Technical Notes. The multiple-race data for these states were bridged to the single-race categories of the 1977 OMB standards for comparability with other states; see Technical Notes. Data for persons of Hispanic origin are included in the data for each race group, according to the decedent’s reported race; see Technical Notes] 2011 2010 Age, sex, race, and Hispanic origin Number Rate Number Rate All races, both sexes All ages . . . . . . . . . . . . . . . . . . . 2,513,171 806.6 2,468,435 799.5 Under 1 year1 . . . . . . . . . . . . . . . . 23,910 598.3 24,586 623.4 1–4 years . . . . . . . . . . . . . . . . . . 4,236 26.2 4,316 26.5 5–14 years . . . . . . . . . . . . . . . . . 5,377 13.1 5,279 12.9 15–24 years . . . . . . . . . . . . . . . . 29,624 67.6 29,551 67.7 25–34 years . . . . . . . . . . . . . . . . 43,631 104.4 42,259 102.9 35–44 years . . . . . . . . . . . . . . . . 69,746 171.7 70,033 170.5 45–54 years . . . . . . . . . . . . . . . . 182,994 409.2 183,207 407.1 55–64 years . . . . . . . . . . . . . . . . 323,015 848.7 310,802 851.9 65–74 years . . . . . . . . . . . . . . . . 414,792 1,845.0 407,151 1,875.1 75–84 years . . . . . . . . . . . . . . . . 625,860 4,750.3 625,651 4,790.2 85 years and over . . . . . . . . . . . . . 789,854 13,767.3 765,474 13,934.3 Not stated . . . . . . . . . . . . . . . . . 132 . . . 126 . . . Age-adjusted rate2 . . . . . . . . . . . . . . . . 740.6 . . . 747.0 All races, male All ages . . . . . . . . . . . . . . . . . . . 1,253,716 817.9 1,232,432 812.0 Under 1 year1 . . . . . . . . . . . . . . . . 13,259 648.8 13,702 680.2 1–4 years . . . . . . . . . . . . . . . . . . 2,393 29.0 2,460 29.6 5–14 years . . . . . . . . . . . . . . . . . 3,163 15.1 3,054 14.6 15–24 years . . . . . . . . . . . . . . . . 21,894 97.6 21,790 97.6 25–34 years . . . . . . . . . . . . . . . . 30,003 142.6 29,192 141.5 35–44 years . . . . . . . . . . . . . . . . 43,152 213.4 43,434 212.5 45–54 years . . . . . . . . . . . . . . . . 111,552 506.6 112,018 505.9 55–64 years . . . . . . . . . . . . . . . . 196,424 1,070.0 189,295 1,075.5 65–74 years . . . . . . . . . . . . . . . . 234,102 2,234.6 229,704 2,275.1 75–84 years . . . . . . . . . . . . . . . . 312,543 5,608.1 311,830 5,693.7 85 years and over . . . . . . . . . . . . . 285,134 15,054.4 275,866 15,414.3 Not stated . . . . . . . . . . . . . . . . . 96 . . . 87 . . . Age-adjusted rate2 . . . . . . . . . . . . . . . . 874.5 . . . 887.1 All races, female All ages . . . . . . . . . . . . . . . . . . . 1,259,456 795.6 1,236,003 787.4 Under 1 year1 . . . . . . . . . . . . . . . . 10,651 545.4 10,884 564.0 1–4 years . . . . . . . . . . . . . . . . . . 1,843 23.3 1,856 23.3 5–14 years . . . . . . . . . . . . . . . . . 2,214 11.0 2,225 11.1 15–24 years . . . . . . . . . . . . . . . . 7,730 36.2 7,761 36.4 25–34 years . . . . . . . . . . . . . . . . 13,628 65.7 13,067 64.0 35–44 years . . . . . . . . . . . . . . . . 26,594 130.3 26,599 128.9 45–54 years . . . . . . . . . . . . . . . . 71,442 314.7 71,189 311.4 55–64 years . . . . . . . . . . . . . . . . 126,591 642.5 121,507 643.5 65–74 years . . . . . . . . . . . . . . . . 180,690 1,505.1 177,447 1,527.5 75–84 years . . . . . . . . . . . . . . . . 313,317 4,121.4 313,821 4,137.7 85 years and over . . . . . . . . . . . . . 504,720 13,133.0 489,608 13,219.2 Not stated . . . . . . . . . . . . . . . . . 36 . . . 39 . . . Age-adjusted rate2 . . . . . . . . . . . . . . . . 631.9 . . . 634.9 See footnotes at end of table.
- 9. 9National Vital Statistics Reports, Vol. 61, No. 6, October 10, 2012 Table 1. Deaths and death rates, by age, sex, race, and Hispanic origin, and age-adjusted death rates, by sex, race, and Hispanic origin: United States, final 2010 and preliminary 2011—Con. [Data are based on a continuous file of records received from the states. Age-specific rates are per 100,000 population in specified group. Age-adjusted rates are per 100,000 U.S. standard population; see Technical Notes. Figures for 2011 are based on weighted data rounded to the nearest individual, so categories may not add to totals. Race and Hispanic origin are reported separately on the death certificate. Data for Hispanic origin and specified races other than white and black should be interpreted with caution because of inconsistencies between reporting Hispanic origin and race on death certificates and on censuses and surveys; see Technical Notes. Race categories are consistent with the 1977 Office of Management and Budget (OMB) standards. Multiple-race data were reported by 38 states and the District of Columbia in 2011 and by 37 states and the District of Columbia in 2010; see Technical Notes. The multiple-race data for these states were bridged to the single-race categories of the 1977 OMB standards for comparability with other states; see Technical Notes. Data for persons of Hispanic origin are included in the data for each race group, according to the decedent’s reported race; see Technical Notes] 2011 2010 Age, sex, race, and Hispanic origin Number Rate Number Rate Total white, both sexes All ages . . . . . . . . . . . . . . . . . . . 2,153,864 871.7 2,114,749 861.7 Under 1 year1 . . . . . . . . . . . . . . . . 15,438 515.5 15,954 537.2 1–4 years . . . . . . . . . . . . . . . . . . 2,973 24.5 3,015 24.6 5–14 years . . . . . . . . . . . . . . . . . 3,907 12.5 3,841 12.3 15–24 years . . . . . . . . . . . . . . . . 21,610 64.9 21,509 64.7 25–34 years . . . . . . . . . . . . . . . . 32,605 101.2 31,425 99.2 35–44 years . . . . . . . . . . . . . . . . 52,857 166.8 53,060 165.0 45–54 years . . . . . . . . . . . . . . . . 143,215 397.4 143,049 392.9 55–64 years . . . . . . . . . . . . . . . . 259,396 820.3 249,583 820.3 65–74 years . . . . . . . . . . . . . . . . 349,774 1,823.5 342,977 1,846.7 75–84 years . . . . . . . . . . . . . . . . 551,575 4,794.0 552,508 4,818.2 85 years and over . . . . . . . . . . . . . 720,413 14,016.6 697,733 14,147.6 Not stated . . . . . . . . . . . . . . . . . 100 . . . 95 . . . Age-adjusted rate2 . . . . . . . . . . . . . . . . 738.1 . . . 741.8 White male All ages . . . . . . . . . . . . . . . . . . . 1,070,817 875.4 1,051,514 866.1 Under 1 year1 . . . . . . . . . . . . . . . . 8,555 558.8 8,871 584.3 1–4 years . . . . . . . . . . . . . . . . . . 1,680 27.0 1,718 27.4 5–14 years . . . . . . . . . . . . . . . . . 2,306 14.4 2,222 13.8 15–24 years . . . . . . . . . . . . . . . . 15,810 92.4 15,661 91.8 25–34 years . . . . . . . . . . . . . . . . 22,603 137.5 21,883 135.6 35–44 years . . . . . . . . . . . . . . . . 33,326 208.5 33,486 206.6 45–54 years . . . . . . . . . . . . . . . . 88,664 494.5 89,017 491.9 55–64 years . . . . . . . . . . . . . . . . 159,175 1,032.1 153,296 1,033.0 65–74 years . . . . . . . . . . . . . . . . 198,530 2,197.8 194,793 2,232.4 75–84 years . . . . . . . . . . . . . . . . 278,190 5,647.4 277,543 5,703.6 85 years and over . . . . . . . . . . . . . 261,903 15,318.1 252,958 15,640.3 Not stated . . . . . . . . . . . . . . . . . 74 . . . 66 . . . Age-adjusted rate2 . . . . . . . . . . . . . . . . 869.3 . . . 878.5 White female All ages . . . . . . . . . . . . . . . . . . . 1,083,046 868.0 1,063,235 857.3 Under 1 year1 . . . . . . . . . . . . . . . . 6,883 470.3 7,083 488.0 1–4 years . . . . . . . . . . . . . . . . . . 1,293 21.8 1,297 21.6 5–14 years . . . . . . . . . . . . . . . . . 1,601 10.5 1,619 10.6 15–24 years . . . . . . . . . . . . . . . . 5,800 35.9 5,848 36.2 25–34 years . . . . . . . . . . . . . . . . 10,002 63.4 9,542 61.4 35–44 years . . . . . . . . . . . . . . . . 19,532 124.4 19,574 122.8 45–54 years . . . . . . . . . . . . . . . . 54,550 301.2 54,032 295.1 55–64 years . . . . . . . . . . . . . . . . 100,221 618.6 96,287 617.8 65–74 years . . . . . . . . . . . . . . . . 151,244 1,490.3 148,184 1,504.9 75–84 years . . . . . . . . . . . . . . . . 273,385 4,155.1 274,965 4,165.4 85 years and over . . . . . . . . . . . . . 458,510 13,367.8 444,775 13,419.3 Not stated . . . . . . . . . . . . . . . . . 26 . . . 29 . . . Age-adjusted rate2 . . . . . . . . . . . . . . . . 629.7 . . . 630.8 See footnotes at end of table.
- 10. 10 National Vital Statistics Reports, Vol. 61, No. 6, October 10, 2012 Table 1. Deaths and death rates, by age, sex, race, and Hispanic origin, and age-adjusted death rates, by sex, race, and Hispanic origin: United States, final 2010 and preliminary 2011—Con. [Data are based on a continuous file of records received from the states. Age-specific rates are per 100,000 population in specified group. Age-adjusted rates are per 100,000 U.S. standard population; see Technical Notes. Figures for 2011 are based on weighted data rounded to the nearest individual, so categories may not add to totals. Race and Hispanic origin are reported separately on the death certificate. Data for Hispanic origin and specified races other than white and black should be interpreted with caution because of inconsistencies between reporting Hispanic origin and race on death certificates and on censuses and surveys; see Technical Notes. Race categories are consistent with the 1977 Office of Management and Budget (OMB) standards. Multiple-race data were reported by 38 states and the District of Columbia in 2011 and by 37 states and the District of Columbia in 2010; see Technical Notes. The multiple-race data for these states were bridged to the single-race categories of the 1977 OMB standards for comparability with other states; see Technical Notes. Data for persons of Hispanic origin are included in the data for each race group, according to the decedent’s reported race; see Technical Notes] 2011 2010 Age, sex, race, and Hispanic origin Number Rate Number Rate Non-Hispanic white, both sexes All ages . . . . . . . . . . . . . . . . . . . 2,005,481 1,000.6 1,969,916 984.3 Under 1 year1 . . . . . . . . . . . . . . . . 10,872 523.2 11,025 529.3 1–4 years . . . . . . . . . . . . . . . . . . 2,051 24.1 2,139 24.7 5–14 years . . . . . . . . . . . . . . . . . 2,890 12.7 2,910 12.6 15–24 years . . . . . . . . . . . . . . . . 16,934 67.1 16,847 66.4 25–34 years . . . . . . . . . . . . . . . . 26,672 108.8 25,486 105.6 35–44 years . . . . . . . . . . . . . . . . 44,817 180.1 44,999 176.2 45–54 years . . . . . . . . . . . . . . . . 127,733 414.0 128,034 407.2 55–64 years . . . . . . . . . . . . . . . . 238,404 837.6 229,265 834.2 65–74 years . . . . . . . . . . . . . . . . 325,851 1,855.6 319,805 1,876.2 75–84 years . . . . . . . . . . . . . . . . 519,151 4,871.2 520,983 4,886.8 85 years and over . . . . . . . . . . . . . 690,048 14,207.2 668,361 14,286.1 Not stated . . . . . . . . . . . . . . . . . 60 . . . 62 . . . Age-adjusted rate2 . . . . . . . . . . . . . . . . 753.9 . . . 755.0 Non-Hispanic white male All ages . . . . . . . . . . . . . . . . . . . 989,421 1,003.7 971,604 987.5 Under 1 year1 . . . . . . . . . . . . . . . . 6,078 572.2 6,144 575.9 1–4 years . . . . . . . . . . . . . . . . . . 1,172 26.9 1,219 27.5 5–14 years . . . . . . . . . . . . . . . . . 1,714 14.7 1,691 14.3 15–24 years . . . . . . . . . . . . . . . . 12,207 94.7 12,079 93.4 25–34 years . . . . . . . . . . . . . . . . 18,237 147.5 17,483 143.6 35–44 years . . . . . . . . . . . . . . . . 27,944 223.7 28,070 219.1 45–54 years . . . . . . . . . . . . . . . . 78,416 512.0 79,295 508.1 55–64 years . . . . . . . . . . . . . . . . 145,958 1,049.5 140,552 1,046.2 65–74 years . . . . . . . . . . . . . . . . 184,956 2,226.6 181,567 2,256.9 75–84 years . . . . . . . . . . . . . . . . 262,163 5,728.0 261,723 5,770.3 85 years and over . . . . . . . . . . . . . 250,530 15,558.4 241,741 15,816.6 Not stated . . . . . . . . . . . . . . . . . 45 . . . 40 . . . Age-adjusted rate2 . . . . . . . . . . . . . . . . 886.8 . . . 892.5 Non-Hispanic white female All ages . . . . . . . . . . . . . . . . . . . 1,016,060 997.7 998,312 981.2 Under 1 year1 . . . . . . . . . . . . . . . . 4,793 471.9 4,881 480.4 1–4 years . . . . . . . . . . . . . . . . . . 879 21.1 920 21.8 5–14 years . . . . . . . . . . . . . . . . . 1,176 10.6 1,219 10.9 15–24 years . . . . . . . . . . . . . . . . 4,726 38.3 4,768 38.4 25–34 years . . . . . . . . . . . . . . . . 8,435 69.4 8,003 66.8 35–44 years . . . . . . . . . . . . . . . . 16,872 136.2 16,929 133.1 45–54 years . . . . . . . . . . . . . . . . 49,317 317.5 48,739 307.7 55–64 years . . . . . . . . . . . . . . . . 92,446 635.1 88,713 631.5 65–74 years . . . . . . . . . . . . . . . . 140,894 1,522.6 138,238 1,535.9 75–84 years . . . . . . . . . . . . . . . . 256,988 4,226.4 259,260 4,232.6 85 years and over . . . . . . . . . . . . . 439,517 13,537.1 426,620 13,543.5 Not stated . . . . . . . . . . . . . . . . . 15 . . . 22 . . . Age-adjusted rate2 . . . . . . . . . . . . . . . . 644.3 . . . 643.3 See footnotes at end of table.
- 11. 11National Vital Statistics Reports, Vol. 61, No. 6, October 10, 2012 Table 1. Deaths and death rates, by age, sex, race, and Hispanic origin, and age-adjusted death rates, by sex, race, and Hispanic origin: United States, final 2010 and preliminary 2011—Con. [Data are based on a continuous file of records received from the states. Age-specific rates are per 100,000 population in specified group. Age-adjusted rates are per 100,000 U.S. standard population; see Technical Notes. Figures for 2011 are based on weighted data rounded to the nearest individual, so categories may not add to totals. Race and Hispanic origin are reported separately on the death certificate. Data for Hispanic origin and specified races other than white and black should be interpreted with caution because of inconsistencies between reporting Hispanic origin and race on death certificates and on censuses and surveys; see Technical Notes. Race categories are consistent with the 1977 Office of Management and Budget (OMB) standards. Multiple-race data were reported by 38 states and the District of Columbia in 2011 and by 37 states and the District of Columbia in 2010; see Technical Notes. The multiple-race data for these states were bridged to the single-race categories of the 1977 OMB standards for comparability with other states; see Technical Notes. Data for persons of Hispanic origin are included in the data for each race group, according to the decedent’s reported race; see Technical Notes] 2011 2010 Age, sex, race, and Hispanic origin Number Rate Number Rate Total black, both sexes All ages . . . . . . . . . . . . . . . . . . . 290,135 679.8 286,959 682.2 Under 1 year1 . . . . . . . . . . . . . . . . 7,234 1,051.3 7,401 1,102.1 1–4 years . . . . . . . . . . . . . . . . . . 1,049 38.2 1,041 38.1 5–14 years . . . . . . . . . . . . . . . . . 1,179 17.6 1,145 17.1 15–24 years . . . . . . . . . . . . . . . . 6,695 92.4 6,675 93.2 25–34 years . . . . . . . . . . . . . . . . 9,064 151.1 8,920 152.0 35–44 years . . . . . . . . . . . . . . . . 13,792 248.6 14,016 250.3 45–54 years . . . . . . . . . . . . . . . . 33,504 579.3 34,093 591.5 55–64 years . . . . . . . . . . . . . . . . 53,804 1,257.8 51,816 1,286.0 65–74 years . . . . . . . . . . . . . . . . 53,303 2,465.2 52,491 2,526.1 75–84 years . . . . . . . . . . . . . . . . 57,973 5,217.6 57,543 5,371.8 85 years and over . . . . . . . . . . . . . 52,510 12,886.4 51,795 13,187.2 Not stated . . . . . . . . . . . . . . . . . 28 . . . 23 . . . Age-adjusted rate2 . . . . . . . . . . . . . . . . 877.4 . . . 898.2 Black male All ages . . . . . . . . . . . . . . . . . . . 146,843 719.2 145,802 725.4 Under 1 year1 . . . . . . . . . . . . . . . . 4,018 1,138.9 4,116 1,206.5 1–4 years . . . . . . . . . . . . . . . . . . 594 42.6 595 42.9 5–14 years . . . . . . . . . . . . . . . . . 701 20.5 667 19.6 15–24 years . . . . . . . . . . . . . . . . 5,126 140.4 5,129 142.8 25–34 years . . . . . . . . . . . . . . . . 6,097 212.0 6,071 216.7 35–44 years . . . . . . . . . . . . . . . . 7,972 305.2 8,115 307.5 45–54 years . . . . . . . . . . . . . . . . 19,162 705.2 19,393 716.3 55–64 years . . . . . . . . . . . . . . . . 31,583 1,622.6 30,458 1,662.1 65–74 years . . . . . . . . . . . . . . . . 28,919 3,128.4 28,395 3,205.6 75–84 years . . . . . . . . . . . . . . . . 26,376 6,361.1 26,602 6,721.5 85 years and over . . . . . . . . . . . . . 16,274 14,176.8 16,243 14,715.3 Not stated . . . . . . . . . . . . . . . . . 20 . . . 18 . . . Age-adjusted rate2 . . . . . . . . . . . . . . . . 1,067.3 . . . 1,104.0 Black female All ages . . . . . . . . . . . . . . . . . . . 143,292 643.7 141,157 642.7 Under 1 year1 . . . . . . . . . . . . . . . . 3,216 959.1 3,285 994.4 1–4 years . . . . . . . . . . . . . . . . . . 455 33.7 446 33.2 5–14 years . . . . . . . . . . . . . . . . . 477 14.5 478 14.5 15–24 years . . . . . . . . . . . . . . . . 1,569 43.6 1,546 43.3 25–34 years . . . . . . . . . . . . . . . . 2,967 95.0 2,849 92.9 35–44 years . . . . . . . . . . . . . . . . 5,819 198.3 5,901 199.3 45–54 years . . . . . . . . . . . . . . . . 14,342 467.7 14,700 481.0 55–64 years . . . . . . . . . . . . . . . . 22,222 953.2 21,358 972.2 65–74 years . . . . . . . . . . . . . . . . 24,384 1,970.0 24,096 2,021.2 75–84 years . . . . . . . . . . . . . . . . 31,596 4,536.6 30,941 4,580.9 85 years and over . . . . . . . . . . . . . 36,236 12,380.3 35,552 12,589.9 Not stated . . . . . . . . . . . . . . . . . 8 . . . 5 . . . Age-adjusted rate2 . . . . . . . . . . . . . . . . 740.1 . . . 752.5 See footnotes at end of table.
- 12. 12 National Vital Statistics Reports, Vol. 61, No. 6, October 10, 2012 Table 1. Deaths and death rates, by age, sex, race, and Hispanic origin, and age-adjusted death rates, by sex, race, and Hispanic origin: United States, final 2010 and preliminary 2011—Con. [Data are based on a continuous file of records received from the states. Age-specific rates are per 100,000 population in specified group. Age-adjusted rates are per 100,000 U.S. standard population; see Technical Notes. Figures for 2011 are based on weighted data rounded to the nearest individual, so categories may not add to totals. Race and Hispanic origin are reported separately on the death certificate. Data for Hispanic origin and specified races other than white and black should be interpreted with caution because of inconsistencies between reporting Hispanic origin and race on death certificates and on censuses and surveys; see Technical Notes. Race categories are consistent with the 1977 Office of Management and Budget (OMB) standards. Multiple-race data were reported by 38 states and the District of Columbia in 2011 and by 37 states and the District of Columbia in 2010; see Technical Notes. The multiple-race data for these states were bridged to the single-race categories of the 1977 OMB standards for comparability with other states; see Technical Notes. Data for persons of Hispanic origin are included in the data for each race group, according to the decedent’s reported race; see Technical Notes] 2011 2010 Age, sex, race, and Hispanic origin Number Rate Number Rate Non-Hispanic black, both sexes All ages . . . . . . . . . . . . . . . . . . . 287,482 719.7 283,438 718.7 Under 1 year1 . . . . . . . . . . . . . . . . 6,973 1,130.4 7,071 1,170.4 1–4 years . . . . . . . . . . . . . . . . . . 1,007 40.7 993 40.2 5–14 years . . . . . . . . . . . . . . . . . 1,149 18.7 1,118 18.1 15–24 years . . . . . . . . . . . . . . . . 6,590 97.8 6,546 98.3 25–34 years . . . . . . . . . . . . . . . . 8,959 161.6 8,786 161.9 35–44 years . . . . . . . . . . . . . . . . 13,650 262.2 13,807 261.9 45–54 years . . . . . . . . . . . . . . . . 33,204 601.2 33,698 610.9 55–64 years . . . . . . . . . . . . . . . . 53,415 1,295.1 51,288 1,318.8 65–74 years . . . . . . . . . . . . . . . . 52,890 2,531.5 51,930 2,582.2 75–84 years . . . . . . . . . . . . . . . . 57,512 5,344.5 56,942 5,477.8 85 years and over . . . . . . . . . . . . . 52,108 13,175.5 51,242 13,385.7 Not stated . . . . . . . . . . . . . . . . . 23 . . . 17 . . . Age-adjusted rate2 . . . . . . . . . . . . . . . . 903.9 . . . 920.4 Non-Hispanic black male All ages . . . . . . . . . . . . . . . . . . . 145,391 762.2 143,824 764.5 Under 1 year1 . . . . . . . . . . . . . . . . 3,872 1,224.8 3,931 1,281.5 1–4 years . . . . . . . . . . . . . . . . . . 571 45.4 570 45.4 5–14 years . . . . . . . . . . . . . . . . . 685 21.9 649 20.7 15–24 years . . . . . . . . . . . . . . . . 5,048 148.8 5,033 150.8 25–34 years . . . . . . . . . . . . . . . . 6,018 226.7 5,971 230.8 35–44 years . . . . . . . . . . . . . . . . 7,895 322.2 7,975 321.1 45–54 years . . . . . . . . . . . . . . . . 18,962 731.0 19,146 739.1 55–64 years . . . . . . . . . . . . . . . . 31,335 1,671.1 30,138 1,705.0 65–74 years . . . . . . . . . . . . . . . . 28,691 3,213.9 28,060 3,274.7 75–84 years . . . . . . . . . . . . . . . . 26,146 6,519.6 26,281 6,849.1 85 years and over . . . . . . . . . . . . . 16,153 14,566.3 16,055 14,974.2 Not stated . . . . . . . . . . . . . . . . . 16 . . . 15 . . . Age-adjusted rate2 . . . . . . . . . . . . . . . . 1,101.2 . . . 1,131.7 Non-Hispanic black female All ages . . . . . . . . . . . . . . . . . . . 142,091 680.8 139,614 676.9 Under 1 year1 . . . . . . . . . . . . . . . . 3,102 1,031.5 3,140 1,055.7 1–4 years . . . . . . . . . . . . . . . . . . 436 35.8 423 34.8 5–14 years . . . . . . . . . . . . . . . . . 463 15.3 469 15.5 15–24 years . . . . . . . . . . . . . . . . 1,542 46.1 1,513 45.6 25–34 years . . . . . . . . . . . . . . . . 2,942 101.8 2,815 99.1 35–44 years . . . . . . . . . . . . . . . . 5,755 208.9 5,832 209.1 45–54 years . . . . . . . . . . . . . . . . 14,242 486.2 14,552 497.4 55–64 years . . . . . . . . . . . . . . . . 22,080 981.7 21,150 996.9 65–74 years . . . . . . . . . . . . . . . . 24,200 2,022.5 23,870 2,068.1 75–84 years . . . . . . . . . . . . . . . . 31,367 4,646.6 30,661 4,675.5 85 years and over . . . . . . . . . . . . . 35,955 12,633.6 35,187 12,767.7 Not stated . . . . . . . . . . . . . . . . . 7 . . . 2 . . . Age-adjusted rate2 . . . . . . . . . . . . . . . . 761.7 . . . 770.8 See footnotes at end of table.
- 13. 13National Vital Statistics Reports, Vol. 61, No. 6, October 10, 2012 Table 1. Deaths and death rates, by age, sex, race, and Hispanic origin, and age-adjusted death rates, by sex, race, and Hispanic origin: United States, final 2010 and preliminary 2011—Con. [Data are based on a continuous file of records received from the states. Age-specific rates are per 100,000 population in specified group. Age-adjusted rates are per 100,000 U.S. standard population; see Technical Notes. Figures for 2011 are based on weighted data rounded to the nearest individual, so categories may not add to totals. Race and Hispanic origin are reported separately on the death certificate. Data for Hispanic origin and specified races other than white and black should be interpreted with caution because of inconsistencies between reporting Hispanic origin and race on death certificates and on censuses and surveys; see Technical Notes. Race categories are consistent with the 1977 Office of Management and Budget (OMB) standards. Multiple-race data were reported by 38 states and the District of Columbia in 2011 and by 37 states and the District of Columbia in 2010; see Technical Notes. The multiple-race data for these states were bridged to the single-race categories of the 1977 OMB standards for comparability with other states; see Technical Notes. Data for persons of Hispanic origin are included in the data for each race group, according to the decedent’s reported race; see Technical Notes] 2011 2010 Age, sex, race, and Hispanic origin Number Rate Number Rate Total AIAN,3,4 both sexes All ages . . . . . . . . . . . . . . . . . . . 15,875 365.2 15,565 365.1 Under 1 year1 . . . . . . . . . . . . . . . . 357 444.8 354 455.3 1–4 years . . . . . . . . . . . . . . . . . . 86 27.3 93 29.4 5–14 years . . . . . . . . . . . . . . . . . 94 12.4 108 14.4 15–24 years . . . . . . . . . . . . . . . . 587 77.0 615 81.3 25–34 years . . . . . . . . . . . . . . . . 837 125.7 795 122.0 35–44 years . . . . . . . . . . . . . . . . 1,194 207.4 1,163 203.2 45–54 years . . . . . . . . . . . . . . . . 2,266 415.5 2,203 409.7 55–64 years . . . . . . . . . . . . . . . . 2,779 747.5 2,704 782.1 65–74 years . . . . . . . . . . . . . . . . 2,845 1,618.9 2,803 1,709.9 75–84 years . . . . . . . . . . . . . . . . 2,777 3,675.3 2,685 3,833.0 85 years and over . . . . . . . . . . . . . 2,052 8,669.2 2,042 9,615.3 Not stated . . . . . . . . . . . . . . . . . 1 . . . – . . . Age-adjusted rate2 . . . . . . . . . . . . . . . . 598.3 . . . 628.3 AIAN3,4 male All ages . . . . . . . . . . . . . . . . . . . 8,582 392.6 8,516 397.5 Under 1 year1 . . . . . . . . . . . . . . . . 196 479.2 213 542.5 1–4 years . . . . . . . . . . . . . . . . . . 46 28.8 55 34.3 5–14 years . . . . . . . . . . . . . . . . . 48 12.5 69 18.1 15–24 years . . . . . . . . . . . . . . . . 421 106.7 456 116.4 25–34 years . . . . . . . . . . . . . . . . 553 160.5 525 156.2 35–44 years . . . . . . . . . . . . . . . . 731 249.9 749 258.2 45–54 years . . . . . . . . . . . . . . . . 1,340 498.0 1,311 496.1 55–64 years . . . . . . . . . . . . . . . . 1,600 891.4 1,590 951.2 65–74 years . . . . . . . . . . . . . . . . 1,560 1,896.0 1,507 1,971.0 75–84 years . . . . . . . . . . . . . . . . 1,339 4,209.1 1,298 4,451.8 85 years and over . . . . . . . . . . . . . 747 9,084.3 743 10,268.1 Not stated . . . . . . . . . . . . . . . . . 1 . . . – . . . Age-adjusted rate2 . . . . . . . . . . . . . . . . 687.0 . . . 730.2 AIAN3,4 female All ages . . . . . . . . . . . . . . . . . . . 7,292 337.4 7,049 332.4 Under 1 year1 . . . . . . . . . . . . . . . . 160 406.5 141 366.4 1–4 years . . . . . . . . . . . . . . . . . . 40 25.8 38 24.4 5–14 years . . . . . . . . . . . . . . . . . 46 12.3 39 10.5 15–24 years . . . . . . . . . . . . . . . . 166 45.1 159 43.6 25–34 years . . . . . . . . . . . . . . . . 284 88.4 270 85.6 35–44 years . . . . . . . . . . . . . . . . 463 163.5 414 146.6 45–54 years . . . . . . . . . . . . . . . . 926 335.1 892 326.2 55–64 years . . . . . . . . . . . . . . . . 1,179 613.1 1,114 623.8 65–74 years . . . . . . . . . . . . . . . . 1,285 1,375.0 1,296 1,481.7 75–84 years . . . . . . . . . . . . . . . . 1,437 3,284.8 1,387 3,391.9 85 years and over . . . . . . . . . . . . . 1,305 8,448.2 1,299 9,277.9 Not stated . . . . . . . . . . . . . . . . . – . . . – . . . Age-adjusted rate2 . . . . . . . . . . . . . . . . 521.4 . . . 541.7 See footnotes at end of table.
- 14. 14 National Vital Statistics Reports, Vol. 61, No. 6, October 10, 2012 Table 1. Deaths and death rates, by age, sex, race, and Hispanic origin, and age-adjusted death rates, by sex, race, and Hispanic origin: United States, final 2010 and preliminary 2011—Con. [Data are based on a continuous file of records received from the states. Age-specific rates are per 100,000 population in specified group. Age-adjusted rates are per 100,000 U.S. standard population; see Technical Notes. Figures for 2011 are based on weighted data rounded to the nearest individual, so categories may not add to totals. Race and Hispanic origin are reported separately on the death certificate. Data for Hispanic origin and specified races other than white and black should be interpreted with caution because of inconsistencies between reporting Hispanic origin and race on death certificates and on censuses and surveys; see Technical Notes. Race categories are consistent with the 1977 Office of Management and Budget (OMB) standards. Multiple-race data were reported by 38 states and the District of Columbia in 2011 and by 37 states and the District of Columbia in 2010; see Technical Notes. The multiple-race data for these states were bridged to the single-race categories of the 1977 OMB standards for comparability with other states; see Technical Notes. Data for persons of Hispanic origin are included in the data for each race group, according to the decedent’s reported race; see Technical Notes] 2011 2010 Age, sex, race, and Hispanic origin Number Rate Number Rate Total API,5 both sexes All ages . . . . . . . . . . . . . . . . . . . 53,298 305.1 51,162 301.1 Under 1 year1 . . . . . . . . . . . . . . . . 882 377.7 877 389.3 1–4 years . . . . . . . . . . . . . . . . . . 128 13.5 167 17.9 5–14 years . . . . . . . . . . . . . . . . . 197 8.5 185 8.2 15–24 years . . . . . . . . . . . . . . . . 731 29.3 752 30.2 25–34 years . . . . . . . . . . . . . . . . 1,124 38.6 1,119 39.2 35–44 years . . . . . . . . . . . . . . . . 1,904 67.4 1,794 65.3 45–54 years . . . . . . . . . . . . . . . . 4,009 170.7 3,862 168.0 55–64 years . . . . . . . . . . . . . . . . 7,036 393.4 6,699 398.5 65–74 years . . . . . . . . . . . . . . . . 8,869 921.9 8,880 987.4 75–84 years . . . . . . . . . . . . . . . . 13,535 2,802.0 12,915 2,853.1 85 years and over . . . . . . . . . . . . . 14,880 8,947.8 13,904 9,418.1 Not stated . . . . . . . . . . . . . . . . . 3 . . . 8 . . . Age-adjusted rate2 . . . . . . . . . . . . . . . . 410.1 . . . 424.3 API5 male All ages . . . . . . . . . . . . . . . . . . . 27,473 328.4 26,600 327.0 Under 1 year1 . . . . . . . . . . . . . . . . 490 411.6 502 434.4 1–4 years . . . . . . . . . . . . . . . . . . 73 15.1 92 19.3 5–14 years . . . . . . . . . . . . . . . . . 107 9.2 96 8.4 15–24 years . . . . . . . . . . . . . . . . 537 42.3 544 43.0 25–34 years . . . . . . . . . . . . . . . . 749 53.9 713 52.6 35–44 years . . . . . . . . . . . . . . . . 1,123 84.2 1,084 83.5 45–54 years . . . . . . . . . . . . . . . . 2,385 216.5 2,297 213.7 55–64 years . . . . . . . . . . . . . . . . 4,066 502.3 3,951 519.0 65–74 years . . . . . . . . . . . . . . . . 5,094 1,166.9 5,009 1,226.0 75–84 years . . . . . . . . . . . . . . . . 6,637 3,308.2 6,387 3,438.7 85 years and over . . . . . . . . . . . . . 6,210 10,140.1 5,922 10,824.5 Not stated . . . . . . . . . . . . . . . . . 1 . . . 3 . . . Age-adjusted rate2 . . . . . . . . . . . . . . . . 490.4 . . . 512.1 API5 female All ages . . . . . . . . . . . . . . . . . . . 25,825 283.6 24,562 277.3 Under 1 year1 . . . . . . . . . . . . . . . . 392 342.5 375 341.8 1–4 years . . . . . . . . . . . . . . . . . . 55 11.8 75 16.3 5–14 years . . . . . . . . . . . . . . . . . 89 7.8 89 7.9 15–24 years . . . . . . . . . . . . . . . . 194 15.8 208 17.0 25–34 years . . . . . . . . . . . . . . . . 375 24.6 406 27.1 35–44 years . . . . . . . . . . . . . . . . 781 52.4 710 49.0 45–54 years . . . . . . . . . . . . . . . . 1,624 130.2 1,565 127.9 55–64 years . . . . . . . . . . . . . . . . 2,970 303.3 2,748 298.8 65–74 years . . . . . . . . . . . . . . . . 3,776 718.6 3,871 788.7 75–84 years . . . . . . . . . . . . . . . . 6,898 2,442.5 6,528 2,445.5 85 years and over . . . . . . . . . . . . . 8,670 8,252.8 7,982 8,590.1 Not stated . . . . . . . . . . . . . . . . . 2 . . . 5 . . . Age-adjusted rate2 . . . . . . . . . . . . . . . . 349.6 . . . 359.0 See footnotes at end of table.
- 15. 15National Vital Statistics Reports, Vol. 61, No. 6, October 10, 2012 Table 1. Deaths and death rates, by age, sex, race, and Hispanic origin, and age-adjusted death rates, by sex, race, and Hispanic origin: United States, final 2010 and preliminary 2011—Con. [Data are based on a continuous file of records received from the states. Age-specific rates are per 100,000 population in specified group. Age-adjusted rates are per 100,000 U.S. standard population; see Technical Notes. Figures for 2011 are based on weighted data rounded to the nearest individual, so categories may not add to totals. Race and Hispanic origin are reported separately on the death certificate. Data for Hispanic origin and specified races other than white and black should be interpreted with caution because of inconsistencies between reporting Hispanic origin and race on death certificates and on censuses and surveys; see Technical Notes. Race categories are consistent with the 1977 Office of Management and Budget (OMB) standards. Multiple-race data were reported by 38 states and the District of Columbia in 2011 and by 37 states and the District of Columbia in 2010; see Technical Notes. The multiple-race data for these states were bridged to the single-race categories of the 1977 OMB standards for comparability with other states; see Technical Notes. Data for persons of Hispanic origin are included in the data for each race group, according to the decedent’s reported race; see Technical Notes] 2011 2010 Age, sex, race, and Hispanic origin Number Rate Number Rate Hispanic,6 both sexes All ages . . . . . . . . . . . . . . . . . . . 149,234 286.7 144,490 286.2 Under 1 year1 . . . . . . . . . . . . . . . . 4,806 457.9 5,170 510.7 1–4 years . . . . . . . . . . . . . . . . . . 972 23.5 930 22.7 5–14 years . . . . . . . . . . . . . . . . . 1,053 11.0 951 10.2 15–24 years . . . . . . . . . . . . . . . . 4,822 53.2 4,795 54.2 25–34 years . . . . . . . . . . . . . . . . 6,041 70.2 6,022 71.4 35–44 years . . . . . . . . . . . . . . . . 8,166 108.8 8,142 111.6 45–54 years . . . . . . . . . . . . . . . . 15,506 271.3 14,915 273.0 55–64 years . . . . . . . . . . . . . . . . 20,895 604.3 20,066 624.4 65–74 years . . . . . . . . . . . . . . . . 23,914 1,362.2 22,962 1,392.7 75–84 years . . . . . . . . . . . . . . . . 32,524 3,574.8 31,364 3,637.3 85 years and over . . . . . . . . . . . . . 30,529 10,052.8 29,166 10,777.9 Not stated . . . . . . . . . . . . . . . . . 7 . . . 7 . . . Age-adjusted rate2 . . . . . . . . . . . . . . . . 539.3 . . . 558.6 Hispanic6 male All ages . . . . . . . . . . . . . . . . . . . 81,632 308.7 79,622 310.8 Under 1 year1 . . . . . . . . . . . . . . . . 2,611 486.3 2,870 556.8 1–4 years . . . . . . . . . . . . . . . . . . 538 25.4 524 25.0 5–14 years . . . . . . . . . . . . . . . . . 607 12.5 543 11.4 15–24 years . . . . . . . . . . . . . . . . 3,720 78.4 3,689 79.4 25–34 years . . . . . . . . . . . . . . . . 4,450 98.1 4,461 100.9 35–44 years . . . . . . . . . . . . . . . . 5,452 141.8 5,460 146.2 45–54 years . . . . . . . . . . . . . . . . 10,244 356.4 9,627 351.9 55–64 years . . . . . . . . . . . . . . . . 13,072 788.6 12,509 815.1 65–74 years . . . . . . . . . . . . . . . . 13,493 1,716.4 13,040 1,775.0 75–84 years . . . . . . . . . . . . . . . . 16,032 4,290.4 15,723 4,461.9 85 years and over . . . . . . . . . . . . . 11,408 10,676.0 11,171 11,779.8 Not stated . . . . . . . . . . . . . . . . . 6 . . . 5 . . . Age-adjusted rate2 . . . . . . . . . . . . . . . . 645.3 . . . 677.7 Hispanic6 female All ages . . . . . . . . . . . . . . . . . . . 67,602 264.0 64,868 260.9 Under 1 year1 . . . . . . . . . . . . . . . . 2,195 428.2 2,300 462.9 1–4 years . . . . . . . . . . . . . . . . . . 434 21.4 406 20.2 5–14 years . . . . . . . . . . . . . . . . . 445 9.5 408 8.9 15–24 years . . . . . . . . . . . . . . . . 1,103 25.6 1,106 26.3 25–34 years . . . . . . . . . . . . . . . . 1,591 39.1 1,561 38.9 35–44 years . . . . . . . . . . . . . . . . 2,714 74.1 2,682 75.2 45–54 years . . . . . . . . . . . . . . . . 5,262 185.2 5,288 193.9 55–64 years . . . . . . . . . . . . . . . . 7,823 434.6 7,557 450.1 65–74 years . . . . . . . . . . . . . . . . 10,421 1,075.0 9,922 1,085.5 75–84 years . . . . . . . . . . . . . . . . 16,492 3,076.1 15,641 3,067.4 85 years and over . . . . . . . . . . . . . 19,120 9,714.0 17,995 10,237.3 Not stated . . . . . . . . . . . . . . . . . 1 . . . 2 . . . Age-adjusted rate2 . . . . . . . . . . . . . . . . 451.8 . . . 463.4 . . . Category not applicable. – Quantity zero. 1 Death rates for ‘‘Under 1 year’’ (based on population estimates) differ from infant mortality rates (based on live births). See text for additional information on the infant mortality rate. 2 For method of computation, see Technical Notes. 3 AIAN is American Indian or Alaska Native. 4 Includes deaths among Aleut and Eskimo persons. 5 API is Asian or Pacific Islander. 6 Includes all persons of Hispanic origin of any race; see Technical Notes. NOTE: Data are subject to sampling or random variation. For information regarding the calculation of standard errors and further discussion of the variability of the data, see Technical Notes.
- 16. Table 2. Deaths, death rates, and age-adjusted death rates for 113 selected causes, Injury by firearms, Drug-induced Injury at work, and Enterocolitis due to Clostridium difficile: United States, final 2010 and preliminary 2011 [Data are based on a continuous file of records received from the states. Rates per 100,000 population. Age-adjusted rates are per 100,000 U.S. standard population; see preceding cause-of-death codes; see Technical Notes. Figures for 2011 are based on weighted data rounded to the nearest individual, so categories may not add to totals deaths, Alcohol-induced deaths, Technical Notes. For explanation of asterisks (*) or subtotals] 2011 2010 Cause Classification of of death (based Diseases, Tenth on the International Revision, 2008 Edition, 2009) Number Rate Age-adjusted rate Number Rate Age-adjusted rate All causes . . . . . . . . . . . . . . . . . . . . . . . . . . . . . . . . . . . . . . . . . . . . . . . . . . . . . . . . . . . . Salmonella infections . . . . . . . . . . . . . . . . . . . . . . . . . . . . . . . . . . . . . . . . . . . . . . . . (A01–A02) Shigellosis and amebiasis . . . . . . . . . . . . . . . . . . . . . . . . . . . . . . . . . . . . . . . . . . . . . (A03,A06) Certain other intestinal infections . . . . . . . . . . . . . . . . . . . . . . . . . . . . . . . . . . . . . . (A04,A07–A09) Tuberculosis . . . . . . . . . . . . . . . . . . . . . . . . . . . . . . . . . . . . . . . . . . . . . . . . . . . . . (A16–A19) Respiratory tuberculosis . . . . . . . . . . . . . . . . . . . . . . . . . . . . . . . . . . . . . . . . . . . . . . . . (A16) Other tuberculosis . . . . . . . . . . . . . . . . . . . . . . . . . . . . . . . . . . . . . . . . . . . . . . . . (A17–A19) Whooping cough . . . . . . . . . . . . . . . . . . . . . . . . . . . . . . . . . . . . . . . . . . . . . . . . . . . . . (A37) Scarlet fever and erysipelas . . . . . . . . . . . . . . . . . . . . . . . . . . . . . . . . . . . . . . . . . . . . (A38,A46) Meningococcal infection . . . . . . . . . . . . . . . . . . . . . . . . . . . . . . . . . . . . . . . . . . . . . . . . . (A39) Septicemia . . . . . . . . . . . . . . . . . . . . . . . . . . . . . . . . . . . . . . . . . . . . . . . . . . . . . . (A40–A41) Syphilis . . . . . . . . . . . . . . . . . . . . . . . . . . . . . . . . . . . . . . . . . . . . . . . . . . . . . . . . (A50–A53) Acute poliomyelitis . . . . . . . . . . . . . . . . . . . . . . . . . . . . . . . . . . . . . . . . . . . . . . . . . . . . (A80) Arthropod-borne viral encephalitis. . . . . . . . . . . . . . . . . . . . . . . . . . . . . . . . . . . . . (A83–A84,A85.2) Measles. . . . . . . . . . . . . . . . . . . . . . . . . . . . . . . . . . . . . . . . . . . . . . . . . . . . . . . . . . . (B05) Viral hepatitis . . . . . . . . . . . . . . . . . . . . . . . . . . . . . . . . . . . . . . . . . . . . . . . . . . . .(B15–B19)1 Human immunodeficiency virus (HIV) disease . . . . . . . . . . . . . . . . . . . . . . . . . . . . . . . . . (B20–B24) Malaria . . . . . . . . . . . . . . . . . . . . . . . . . . . . . . . . . . . . . . . . . . . . . . . . . . . . . . . . (B50–B54) Other and unspecified infectious and parasitic diseases and their sequelae . . . . . . . . . . .(A00,A05,A20–A36, A42–A44,A48–A49,A54–A79,A81–A82,A85.0–A85.1,A85.8,A86–B04,B06–B09,B25–B49,B55–B99) Malignant neoplasms . . . . . . . . . . . . . . . . . . . . . . . . . . . . . . . . . . . . . . . . . . . . . . . . (C00–C97) Malignant neoplasms of lip, oral cavity and pharynx . . . . . . . . . . . . . . . . . . . . . . . . . . . . (C00–C14) Malignant neoplasm of esophagus. . . . . . . . . . . . . . . . . . . . . . . . . . . . . . . . . . . . . . . . . . (C15) Malignant neoplasm of stomach . . . . . . . . . . . . . . . . . . . . . . . . . . . . . . . . . . . . . . . . . . . (C16) Malignant neoplasms of colon, rectum and anus . . . . . . . . . . . . . . . . . . . . . . . . . . . . . . (C18–C21) Malignant neoplasms of liver and intrahepatic bile ducts. . . . . . . . . . . . . . . . . . . . . . . . . . . . . (C22) Malignant neoplasm of pancreas. . . . . . . . . . . . . . . . . . . . . . . . . . . . . . . . . . . . . . . . . . . (C25) Malignant neoplasm of larynx. . . . . . . . . . . . . . . . . . . . . . . . . . . . . . . . . . . . . . . . . . . . . (C32) Malignant neoplasms of trachea, bronchus and lung . . . . . . . . . . . . . . . . . . . . . . . . . . . . (C33–C34) Malignant melanoma of skin . . . . . . . . . . . . . . . . . . . . . . . . . . . . . . . . . . . . . . . . . . . . . (C43) Malignant neoplasm of breast . . . . . . . . . . . . . . . . . . . . . . . . . . . . . . . . . . . . . . . . . . . . (C50) Malignant neoplasm of cervix uteri. . . . . . . . . . . . . . . . . . . . . . . . . . . . . . . . . . . . . . . . . . (C53) Malignant neoplasms of corpus uteri and uterus, part unspecified . . . . . . . . . . . . . . . . . . . . (C54–C55) Malignant neoplasm of ovary . . . . . . . . . . . . . . . . . . . . . . . . . . . . . . . . . . . . . . . . . . . . . (C56) Malignant neoplasm of prostate . . . . . . . . . . . . . . . . . . . . . . . . . . . . . . . . . . . . . . . . . . . (C61) Malignant neoplasms of kidney and renal pelvis. . . . . . . . . . . . . . . . . . . . . . . . . . . . . . . (C64–C65) Malignant neoplasm of bladder. . . . . . . . . . . . . . . . . . . . . . . . . . . . . . . . . . . . . . . . . . . . (C67) Malignant neoplasms of meninges, brain and other parts of central nervous system . . . . . . . . . (C70–C72) Malignant neoplasms of lymphoid, hematopoietic and related tissue . . . . . . . . . . . . . . . . . . . (C81–C96) Hodgkin’s disease . . . . . . . . . . . . . . . . . . . . . . . . . . . . . . . . . . . . . . . . . . . . . . . . . . (C81) Non-Hodgkin’s lymphoma. . . . . . . . . . . . . . . . . . . . . . . . . . . . . . . . . . . . . . . . . . . (C82–C85) Leukemia . . . . . . . . . . . . . . . . . . . . . . . . . . . . . . . . . . . . . . . . . . . . . . . . . . . . (C91–C95) Multiple myeloma and immunoproliferative neoplasms . . . . . . . . . . . . . . . . . . . . . . . . . . (C88,C90) See footnotes at end of table. 2,512,873 42 8 10,972 536 392 144 8 4 85 35,539 45 – 5 1 7,794 7,638 1 5,713 575,313 8,625 14,413 10,995 52,243 21,519 37,371 3,710 156,614 9,126 41,271 4,080 8,615 14,312 27,929 13,520 14,969 14,492 56,263 1,172 20,221 22,982 11,808 806.5 0.0 * 3.5 0.2 0.1 0.0 * * 0.0 11.4 0.0 * * * 2.5 2.5 * 1.8 184.6 2.8 4.6 3.5 16.8 6.9 12.0 1.2 50.3 2.9 13.2 1.3 2.8 4.6 9.0 4.3 4.8 4.7 18.1 0.4 6.5 7.4 3.8 740.6 0.0 * 3.3 0.2 0.1 0.0 * * 0.0 10.5 0.0 * * * 2.1 2.4 * 1.7 168.6 2.5 4.1 3.2 15.3 6.1 10.9 1.1 45.9 2.7 12.0 1.2 2.5 4.2 8.3 4.0 4.4 4.3 16.8 0.4 6.0 6.9 3.5 2,468,435 28 3 10,276 569 423 146 26 3 79 34,812 28 – 9 2 7,564 8,369 10 5,805 574,743 8,474 14,490 11,390 52,622 20,305 36,888 3,691 158,318 9,154 41,435 3,939 8,402 14,572 28,561 13,219 14,731 14,164 55,590 1,231 20,294 22,569 11,428 799.5 0.0 * 3.3 0.2 0.1 0.0 0.0 * 0.0 11.3 0.0 * * * 2.4 2.7 * 1.9 186.2 2.7 4.7 3.7 17.0 6.6 11.9 1.2 51.3 3.0 13.4 1.3 2.7 4.7 9.3 4.3 4.8 4.6 18.0 0.4 6.6 7.3 3.7 747.0 0.0 * 3.1 0.2 0.1 0.0 0.0 * 0.0 10.6 0.0 * * * 2.1 2.6 * 1.8 172.8 2.5 4.3 3.4 15.8 6.0 11.0 1.1 47.6 2.8 12.4 1.2 2.5 4.4 8.7 3.9 4.5 4.3 17.0 0.4 6.2 6.9 3.4 16NationalVitalStatisticsReports,Vol.61,No.6,October10,2012
- 17. 17NationalVitalStatisticsReports,Vol.61,No.6,October10,2012 Table 2. Deaths, death rates, and age-adjusted death rates for 113 selected causes, Injury by firearms, Drug-induced Injury at work, and Enterocolitis due to Clostridium difficile: United States, final 2010 and preliminary 2011—Con. [Data are based on a continuous file of records received from the states. Rates per 100,000 population. Age-adjusted rates are per 100,000 U.S. standard population; see preceding cause-of-death codes; see Technical Notes. Figures for 2011 are based on weighted data rounded to the nearest individual, so categories may not add to totals deaths, Alcohol-induced deaths, Technical Notes. For explanation of asterisks (*) or subtotals] 2011 2010 Cause Classification of of death (based Diseases, Tenth on the International Revision, 2008 Edition, 2009) Number Rate Age-adjusted rate Number Rate Age-adjusted rate Other and unspecified malignant neoplasms of lymphoid, hematopoietic and related tissue. . . . . . . . . . . . . . . . . . . . . . . . . . . . . . . . . . . . . . . . . . . . . . . . . . . . . . . . . (C96) All other and unspecified malignant neoplasms . . . . . . . . . . .(C17,C23–C24,C26–C31,C37–C41,C44–C49, C51–C52,C57–C60,C62–C63,C66,C68–C69,C73–C80,C97) In situ neoplasms, benign neoplasms and neoplasms of uncertain or unknown behavior . . . . . . . . (D00–D48) Anemias . . . . . . . . . . . . . . . . . . . . . . . . . . . . . . . . . . . . . . . . . . . . . . . . . . . . . . . (D50–D64) Diabetes mellitus . . . . . . . . . . . . . . . . . . . . . . . . . . . . . . . . . . . . . . . . . . . . . . . . . . (E10–E14) Nutritional deficiencies . . . . . . . . . . . . . . . . . . . . . . . . . . . . . . . . . . . . . . . . . . . . . . . (E40–E64) Malnutrition . . . . . . . . . . . . . . . . . . . . . . . . . . . . . . . . . . . . . . . . . . . . . . . . . . . . (E40–E46) Other nutritional deficiencies . . . . . . . . . . . . . . . . . . . . . . . . . . . . . . . . . . . . . . . . . . (E50–E64) Meningitis. . . . . . . . . . . . . . . . . . . . . . . . . . . . . . . . . . . . . . . . . . . . . . . . . . . . . . . (G00,G03) Parkinson’s disease. . . . . . . . . . . . . . . . . . . . . . . . . . . . . . . . . . . . . . . . . . . . . . . . (G20–G21)2 Alzheimer’s disease. . . . . . . . . . . . . . . . . . . . . . . . . . . . . . . . . . . . . . . . . . . . . . . . . . . . (G30) Major cardiovascular diseases. . . . . . . . . . . . . . . . . . . . . . . . . . . . . . . . . . . . . . . . . . . . (I00–I78) Diseases of heart. . . . . . . . . . . . . . . . . . . . . . . . . . . . . . . . . . . . . . . . . (I00–I09,I11,I13,I20–I51) Acute rheumatic fever and chronic rheumatic heart diseases. . . . . . . . . . . . . . . . . . . . . . . (I00–I09) Hypertensive heart disease . . . . . . . . . . . . . . . . . . . . . . . . . . . . . . . . . . . . . . . . . . . . .(I11) Hypertensive heart and renal disease . . . . . . . . . . . . . . . . . . . . . . . . . . . . . . . . . . . . . . .(I13) Ischemic heart diseases . . . . . . . . . . . . . . . . . . . . . . . . . . . . . . . . . . . . . . . . . . . . (I20–I25) Acute myocardial infarction . . . . . . . . . . . . . . . . . . . . . . . . . . . . . . . . . . . . . . . . . (I21–I22) Other acute ischemic heart diseases . . . . . . . . . . . . . . . . . . . . . . . . . . . . . . . . . . . . . .(I24) Other forms of chronic ischemic heart disease. . . . . . . . . . . . . . . . . . . . . . . . . . . . . . (I20,I25) Atherosclerotic cardiovascular disease, so described. . . . . . . . . . . . . . . . . . . . . . . . . . .(I25.0) All other forms of chronic ischemic heart disease. . . . . . . . . . . . . . . . . . . . . . .(I20,I25.1–I25.9) Other heart diseases . . . . . . . . . . . . . . . . . . . . . . . . . . . . . . . . . . . . . . . . . . . . . . (I26–I51) Acute and subacute endocarditis . . . . . . . . . . . . . . . . . . . . . . . . . . . . . . . . . . . . . . . . .(I33) Diseases of pericardium and acute myocarditis . . . . . . . . . . . . . . . . . . . . . . . . . . . (I30–I31,I40) Heart failure . . . . . . . . . . . . . . . . . . . . . . . . . . . . . . . . . . . . . . . . . . . . . . . . . . . . .(I50) All other forms of heart disease . . . . . . . . . . . . . . . . . . . . . . . . . . (I26–I28,I34–I38,I42–I49,I51) Essential hypertension and hypertensive renal disease. . . . . . . . . . . . . . . . . . . . . . . . . . (I10,I12,I15) Cerebrovascular diseases . . . . . . . . . . . . . . . . . . . . . . . . . . . . . . . . . . . . . . . . . . . . . (I60–I69) Atherosclerosis . . . . . . . . . . . . . . . . . . . . . . . . . . . . . . . . . . . . . . . . . . . . . . . . . . . . . .(I70) Other diseases of circulatory system . . . . . . . . . . . . . . . . . . . . . . . . . . . . . . . . . . . . . .(I71–I78)3 Aortic aneurysm and dissection . . . . . . . . . . . . . . . . . . . . . . . . . . . . . . . . . . . . . . . . . . .(I71) Other diseases of arteries, arterioles and capillaries . . . . . . . . . . . . . . . . . . . . . . . . . . . .(I72–I78)3 Other disorders of circulatory system . . . . . . . . . . . . . . . . . . . . . . . . . . . . . . . . . . . . . . . (I80–I99) Influenza and pneumonia . . . . . . . . . . . . . . . . . . . . . . . . . . . . . . . . . . . . . . . . . . . . . (J09–J18)4 Influenza . . . . . . . . . . . . . . . . . . . . . . . . . . . . . . . . . . . . . . . . . . . . . . . . . . . . . . .(J09–J11) Pneumonia . . . . . . . . . . . . . . . . . . . . . . . . . . . . . . . . . . . . . . . . . . . . . . . . . . . . (J12–J18)4 Other acute lower respiratory infections . . . . . . . . . . . . . . . . . . . . . . . . . . . . . . . . . . (J20–J22,U04)5 Acute bronchitis and bronchiolitis . . . . . . . . . . . . . . . . . . . . . . . . . . . . . . . . . . . . . . . (J20–J21)5 Other and unspecified acute lower respiratory infections. . . . . . . . . . . . . . . . . . . . . . . . . . .(J22,U04) Chronic lower respiratory diseases . . . . . . . . . . . . . . . . . . . . . . . . . . . . . . . . . . . . . . . . .(J40–J47) See footnotes at end of table. 79 65,248 14,992 4,956 73,282 3,177 2,993 184 606 23,107 84,691 778,503 596,339 3,070 33,383 3,598 374,601 119,732 3,952 250,916 58,261 192,656 181,686 1,165 790 59,544 120,188 27,477 128,931 7,011 18,746 10,030 8,716 4,317 53,667 1,532 52,136 241 210 31 143,382 0.0 20.9 4.8 1.6 23.5 1.0 1.0 0.1 0.2 7.4 27.2 249.8 191.4 1.0 10.7 1.2 120.2 38.4 1.3 80.5 18.7 61.8 58.3 0.4 0.3 19.1 38.6 8.8 41.4 2.3 6.0 3.2 2.8 1.4 17.2 0.5 16.7 0.1 0.1 0.0 46.0 0.0 19.2 4.5 1.5 21.5 0.9 0.9 0.0 0.2 7.0 24.6 227.1 173.7 0.9 9.6 1.0 109.0 34.9 1.1 72.9 16.7 56.2 53.1 0.3 0.2 17.3 35.2 8.0 37.9 2.0 5.5 3.0 2.5 1.3 15.7 0.4 15.2 0.1 0.0 0.0 42.7 68 64,798 14,917 4,852 69,071 2,948 2,790 158 608 22,032 83,494 780,213 597,689 2,987 33,678 2,807 379,559 122,071 4,170 253,318 57,438 195,880 178,658 1,103 776 57,757 119,022 26,634 129,476 7,230 19,184 10,431 8,753 4,241 50,097 500 49,597 213 177 36 138,080 0.0 21.0 4.8 1.6 22.4 1.0 0.9 0.1 0.2 7.1 27.0 252.7 193.6 1.0 10.9 0.9 122.9 39.5 1.4 82.0 18.6 63.4 57.9 0.4 0.3 18.7 38.6 8.6 41.9 2.3 6.2 3.4 2.8 1.4 16.2 0.2 16.1 0.1 0.1 0.0 44.7 0.0 19.5 4.6 1.5 20.8 0.9 0.8 0.0 0.2 6.8 25.1 234.2 179.1 0.9 10.0 0.8 113.6 36.5 1.3 75.9 17.0 58.9 53.7 0.3 0.2 17.3 35.9 8.0 39.1 2.2 5.8 3.2 2.6 1.3 15.1 0.1 14.9 0.1 0.0 0.0 42.2
- 18. Table 2. Deaths, death rates, and age-adjusted death rates for 113 selected causes, Injury by firearms, Drug-induced Injury at work, and Enterocolitis due to Clostridium difficile: United States, final 2010 and preliminary 2011—Con. [Data are based on a continuous file of records received from the states. Rates per 100,000 population. Age-adjusted rates are per 100,000 U.S. standard population; see preceding cause-of-death codes; see Technical Notes. Figures for 2011 are based on weighted data rounded to the nearest individual, so categories may not add to totals deaths, Alcohol-induced deaths, Technical Notes. For explanation of asterisks (*) or subtotals] 2011 2010 Cause Classification of of death (based Diseases, Tenth on the International Revision, 2008 Edition, 2009) Number Rate Age-adjusted rate Number Rate Age-adjusted rate Bronchitis, chronic and unspecified . . . . . . . . . . . . . . . . . . . . . . . . . . . . . . . . . . . . . . .(J40–J42) Emphysema . . . . . . . . . . . . . . . . . . . . . . . . . . . . . . . . . . . . . . . . . . . . . . . . . . . . . . . (J43) Asthma. . . . . . . . . . . . . . . . . . . . . . . . . . . . . . . . . . . . . . . . . . . . . . . . . . . . . . . .(J45–J46) Other chronic lower respiratory diseases . . . . . . . . . . . . . . . . . . . . . . . . . . . . . . . . . . . . (J44,J47) Pneumoconioses and chemical effects. . . . . . . . . . . . . . . . . . . . . . . . . . . . . . . . . . . . (J60–J66,J68) Pneumonitis due to solids and liquids . . . . . . . . . . . . . . . . . . . . . . . . . . . . . . . . . . . . . . . . . (J69) Other diseases of respiratory system . . . . . . . . . . . . . . . . . . . . . . . . . (J00–J06,J30–J39,J67,J70–J98) Peptic ulcer . . . . . . . . . . . . . . . . . . . . . . . . . . . . . . . . . . . . . . . . . . . . . . . . . . . . . (K25–K28) Diseases of appendix. . . . . . . . . . . . . . . . . . . . . . . . . . . . . . . . . . . . . . . . . . . . . . . .(K35–K38)6 Hernia. . . . . . . . . . . . . . . . . . . . . . . . . . . . . . . . . . . . . . . . . . . . . . . . . . . . . . . . . (K40–K46) Chronic liver disease and cirrhosis . . . . . . . . . . . . . . . . . . . . . . . . . . . . . . . . . . . . . (K70,K73–K74) Alcoholic liver disease . . . . . . . . . . . . . . . . . . . . . . . . . . . . . . . . . . . . . . . . . . . . . . . . . (K70) Other chronic liver disease and cirrhosis . . . . . . . . . . . . . . . . . . . . . . . . . . . . . . . . . . . (K73–K74) Cholelithiasis and other disorders of gallbladder . . . . . . . . . . . . . . . . . . . . . . . . . . . . . . . . (K80–K82) Nephritis, nephrotic syndrome and nephrosis . . . . . . . . . . . . . . . . . . . . . .(N00–N07,N17–N19,N25–N27)7 Acute and rapidly progressive nephritic and nephrotic syndrome . . . . . . . . . . . . . . . . . . (N00–N01,N04) Chronic glomerulonephritis, nephrosis and nephropathy not specified as acute or chronic, and renal sclerosis unspecified. . . . . . . . . . . . . . . . . . . . . . . . . . . . . . . . . . (N02–N03,N05–N07,N26) Renal failure. . . . . . . . . . . . . . . . . . . . . . . . . . . . . . . . . . . . . . . . . . . . . . . . . . . (N17–N19)7 Other disorders of kidney . . . . . . . . . . . . . . . . . . . . . . . . . . . . . . . . . . . . . . . . . . . . (N25,N27) Infections of kidney . . . . . . . . . . . . . . . . . . . . . . . . . . . . . . . . . . . . . . . . . (N10–N12,N13.6,N15.1) Hyperplasia of prostate. . . . . . . . . . . . . . . . . . . . . . . . . . . . . . . . . . . . . . . . . . . . . . . . . . (N40) Inflammatory diseases of female pelvic organs. . . . . . . . . . . . . . . . . . . . . . . . . . . . . . . . . (N70–N76) Pregnancy, childbirth and the puerperium . . . . . . . . . . . . . . . . . . . . . . . . . . . . . . . . . . . (O00–O99)8 Pregnancy with abortive outcome . . . . . . . . . . . . . . . . . . . . . . . . . . . . . . . . . . . . . . . (O00–O07) Other complications of pregnancy, childbirth and the puerperium . . . . . . . . . . . . . . . . . . . . (O10–O99)8 Certain conditions originating in the perinatal period. . . . . . . . . . . . . . . . . . . . . . . . . . . . . . (P00–P96) Congenital malformations, deformations and chromosomal abnormalities. . . . . . . . . . . . . . . . . . (Q00–Q99) Symptoms, signs and abnormal clinical and laboratory findings, not elsewhere classified . . . . . . . . (R00–R99) All other diseases . . . . . . . . . . . . . . . . . . . . . . . . . . . . . . . . . . . . . . . . . . . . . . . . . . . (residual) Accidents (unintentional injuries) . . . . . . . . . . . . . . . . . . . . . . . . . . . . . . . . . . . (V01–X59,Y85–Y86)9 Transport accidents . . . . . . . . . . . . . . . . . . . . . . . . . . . . . . . . . . . . . . . . . . . . (V01–V99,Y85) Motor vehicle accidents. . . . . . . . . . . . (V02–V04,V09.0,V09.2,V12–V14,V19.0–V19.2,V19.4–V19.6,V20– V79,V80.3–V80.5,V81.0–V81.1,V82.0–V82.1,V83–V86,V87.0–V87.8,V88.0–V88.8,V89.0,V89.2) Other land transport accidents. . . . . . . . . . (V01,V05–V06,V09.1,V09.3–V09.9,V10–V11,V15–V18,V19.3, V19.8–V19.9,V80.0–V80.2,V80.6–V80.9,V81.2–V81.9,V82.2–V82.9,V87.9,V88.9, V89.1,V89.3,V89.9) Water, air and space, and other and unspecified transport accidents and their sequelae. . . . . . . . . . . . . . . . . . . . . . . . . . . . . . . . . . . . . . . . . . . . . . (V90–V99,Y85) Nontransport accidents . . . . . . . . . . . . . . . . . . . . . . . . . . . . . . . . . . . . . . . . . (W00–X59,Y86)9 Falls . . . . . . . . . . . . . . . . . . . . . . . . . . . . . . . . . . . . . . . . . . . . . . . . . . . . . . (W00–W19) Accidental discharge of firearms. . . . . . . . . . . . . . . . . . . . . . . . . . . . . . . . . . . . . . (W32–W34) Accidental drowning and submersion . . . . . . . . . . . . . . . . . . . . . . . . . . . . . . . . . . . (W65–W74) Accidental exposure to smoke, fire and flames . . . . . . . . . . . . . . . . . . . . . . . . . . . . . . (X00–X09) See footnotes at end of table. 594 9,418 3,311 130,059 774 18,090 32,693 2,981 387 1,884 33,539 16,634 16,905 3,324 45,731 315 1,710 43,682 24 648 517 133 940 28 912 11,969 9,646 47,747 288,936 122,777 37,275 34,677 952 1,647 85,502 26,631 851 3,555 2,621 0.2 3.0 1.1 41.7 0.2 5.8 10.5 1.0 0.1 0.6 10.8 5.3 5.4 1.1 14.7 0.1 0.5 14.0 0.0 0.2 0.2 0.0 0.3 0.0 0.3 3.8 3.1 15.3 92.7 39.4 12.0 11.1 0.3 0.5 27.4 8.5 0.3 1.1 0.8 0.2 2.8 1.0 38.7 0.2 5.3 9.7 0.8 0.1 0.6 9.7 4.8 4.9 1.0 13.4 0.1 0.5 12.8 0.0 0.2 0.2 0.0 0.3 0.0 0.3 4.1 3.2 14.2 84.4 38.0 11.7 10.9 0.3 0.5 26.2 7.8 0.3 1.1 0.8 620 10,034 3,404 124,022 845 17,011 31,187 2,977 415 1,832 31,903 15,990 15,913 3,332 50,476 203 5,894 44,362 17 608 489 137 825 37 788 12,128 9,673 38,360 269,844 120,859 37,961 35,332 1,029 1,600 82,898 26,009 606 3,782 2,782 0.2 3.2 1.1 40.2 0.3 5.5 10.1 1.0 0.1 0.6 10.3 5.2 5.2 1.1 16.3 0.1 1.9 14.4 * 0.2 0.2 0.0 0.3 0.0 0.3 3.9 3.1 12.4 87.4 39.1 12.3 11.4 0.3 0.5 26.8 8.4 0.2 1.2 0.9 0.2 3.1 1.0 37.9 0.3 5.1 9.5 0.9 0.1 0.5 9.4 4.7 4.7 1.0 15.3 0.0 1.8 13.4 * 0.2 0.1 0.0 0.3 0.0 0.3 4.2 3.2 11.7 81.1 38.0 12.1 11.3 0.3 0.5 25.9 7.9 0.2 1.2 0.9 18NationalVitalStatisticsReports,Vol.61,No.6,October10,2012