More Related Content
Similar to 06 epidemiology of_hypertension
Similar to 06 epidemiology of_hypertension (20)
06 epidemiology of_hypertension
- 1. 12 © SUPPLEMENT TO JAPI • FEBRUARY 2013 • VOL. 61
Epidemiology of Hypertension
Global11,12
As per the World Health Statistics 2012, of the estimated 57
million global deaths in 2008, 36 million (63%) were due to
noncommunicable diseases (NCDs). The largest proportion of
NCD deaths is caused by cardiovascular diseases (48%). In terms
of attributable deaths, raised blood pressure is one of the leading
behavioral and physiological risk factor to which 13% of global
deaths are attributed. Hypertension is reported to be the fourth
contributor to premature death in developed countries and the
seventh in developing countries.
Recent reports indicate that nearly 1 billion adults (more
than a quarter of the world’s population) had hypertension in
2000, and this is predicted to increase to 1.56 billion by 2025.
Earlier reports also suggest that the prevalence of hypertension
is rapidly increasing in developing countries and is one of
the leading causes of death and disability. While mean blood
pressure has decreased in nearly all high-income countries, it has
been stable or increasing in mostAfrican countries. Today, mean
blood pressure remains very high in many African and some
European countries. The prevalence of raised blood pressure in
2008 was highest in the WHOAfrican Region at 36.8% (34.0–39.7).
The Global Burden of Diseases; Chronic Disease Risk Factors
Collaborating Group has reported 35-year (1980-2005) trends in
mean levels of body mass index (BMI), systolic BP and cholesterol
in 199 high-income, middle-income and low-income countries.
Mean systolic BP declined in high and middle-income countries
but increased in low-income countries and is now more than in
high-income countries. The India specific data are similar to the
overall trends in low-income countries.
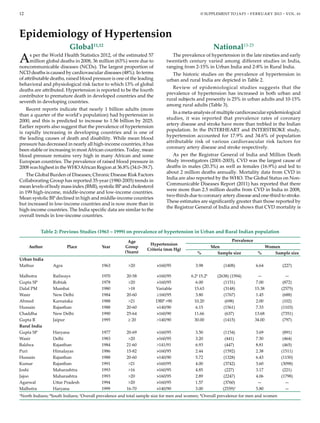
National13-25
The prevalence of hypertension in the late nineties and early
twentieth century varied among different studies in India,
ranging from 2-15% in Urban India and 2-8% in Rural India.
The historic studies on the prevalence of hypertension in
urban and rural India are depicted in Table 2.
Review of epidemiological studies suggests that the
prevalence of hypertension has increased in both urban and
rural subjects and presently is 25% in urban adults and 10-15%
among rural adults (Table 3).
In a meta-analysis of multiple cardiovascular epidemiological
studies, it was reported that prevalence rates of coronary
artery disease and stroke have more than trebled in the Indian
population. In the INTERHEART and INTERSTROKE study,
hypertension accounted for 17.9% and 34.6% of population
attributable risk of various cardiovascular risk factors for
coronary artery disease and stroke respectively.
As per the Registrar General of India and Million Death
Study investigators (2001-2003), CVD was the largest cause of
deaths in males (20.3%) as well as females (16.9%) and led to
about 2 million deaths annually. Mortality data from CVD in
India are also reported by the WHO. The Global Status on Non-
Communicable Diseases Report (2011) has reported that there
were more than 2.5 million deaths from CVD in India in 2008,
two-thirds due to coronary artery disease and one-third to stroke.
These estimates are significantly greater than those reported by
the Registrar General of India and shows that CVD mortality is
Table 2: Previous Studies (1963 – 1999) on prevalence of hypertension in Urban and Rural Indian population
Author Place Year
Age
Group
(Years)
Hypertension
Criteria (mm Hg)
Prevalence
Men Women
% Sample size % Sample size
Urban India
Mathur Agra 1963 >20 >160/95 3.98 (1408) 6.64 (227)
Malhotra Railways 1970 20-58 >160/95 6.2a
15.2b
(2638) (1594) — —
Gupta SP Rohtak 1978 >20 >160/95 6.00 (1151) 7.00 (872)
Dalal PM Mumbai 1980 >18 Variable 15.63 (3148) 15.38 (2575)
Wasir New Delhi 1984 20-60 ≥160/95 3.80 (1767) 1.45 (688)
Ahmed Karnataka 1988 >21 DBP >90 10.20 (698) 2.00 (102)
Hussain Rajasthan 1988 20-60 >140/90 6.15 (1561) 7.33 (1103)
Chaddha New Delhi 1990 25-64 >160/90 11.66 (637) 13.68 (7351)
Gupta R Jaipur 1995 ≥ 20 >140/90 30.00 (1415) 34.00 (797)
Rural India
Gupta SP Haryana 1977 20-69 >160/95 3.50 (1154) 3.69 (891)
Wasir Delhi 1983 >20 >160/95 3.20 (441) 7.50 (464)
Baldwa Rajasthan 1984 21-60 >141/91 6.93 (447) 8.81 (465)
Puri Himalayas 1986 15-82 >160/95 2.44 (1592) 2.38 (1511)
Hussain Rajasthan 1988 20-60 >140/90 5.72 (1328) 6.43 (1150)
Kumar Rajasthan 1991 >21 >160/95 4.00 (3742) 3.60 (3098)
Joshi Maharashtra 1993 >16 >160/95 4.85 (227) 3.17 (221)
Jajoo Maharashtra 1993 >20 >160/95 2.89 (2247) 4.06 (1798)
Agarwal Uttar Pradesh 1994 >20 >160/95 1.57 (3760) — —
Malhotra Haryana 1999 16-70 >140/90 3.00 (2559)#
5.80 —
a
North Indians; b
South Indians; #
Overall prevalence and total sample size for men and women; *Overall prevalence for men and women
- 2. © SUPPLEMENT TO JAPI • FEBRUARY 2013 • VOL. 61 13
increasing rapidly in the country. CVD is the largest cause of
mortality in all regions of the country. Table 4 shows the top 5
causes of deaths in the rural and urban populations.
There are large regional differences in cardiovascular
mortality in India among both men and women. The mortality
is highest in south Indian states, eastern and north eastern states
and Punjab in both men and women, while mortality is the lowest
in the central Indian states of Rajasthan, Uttar Pradesh and Bihar.
The prospective phase of the ongoing Million Deaths Study from
2004-2013 shall provide robust data on regional variations and
trends in CVD mortality in India.
The prevalence of hypertension in the last six decades has
increased from 2% to 25% among urban residents and from
2% to 15% among the rural residents in India. According to
Directorate General of Health Services, Ministry of Health and
Family Welfare, Government of India, the overall prevalence of
hypertension in India by 2020 will be 159.46/1000 population.25
Various factors might have contributed to this rising trend,
attributable to several indicators of economic progress such
as increased life expectancy, urbanization and its attendant
lifestyle changes including increasing salt intake and the
Table 3 : Recent studies (2000 – 2012) on prevalence of hypertension in urban and rural Indian population
First author Year Place Age (yr) Sample Size Prevalence (%)
Urban Population
Anand MP 2000 Mumbai 30-60 1662 34.0
Gupta PC 2004 Mumbai ≥ 35 88653 47.9
Prabhakaran D 2005 Delhi 20-59 2935 30.0
Reddy KS 2006 National 20-69 19973 27.2
Mohan V 2007 Chennai ≥ 20 2350 20.0
Kaur P 2007 Chennai 18-69 2262 27.2
Yadav S 2008 Lucknow ≥ 30 1746 32.2
Rural Populations
Hazarika 2004 Assam >30 3180 33.3
Thankappan 2006 Kerala >30 2159 36
Krishnan A 2008 Harayana 15-64 2828 9.3
Todkar SS 2009 Maharashtra ≥ 20 1297 7.2
Vijaykumar G 2009 Kerala ≥18 1990 36.1
Bhardwaj R 2010 Himachal ≥ 18 1092 35.9
Kinra S 2010 National 20-69 1983 20.0
Table 4 : Top five causes of deaths in India classified
according to areas of residence and gender
Rank India (all age
groups)
Rural populations Urban populations
1 Cardiovascular Cardiovascular Cardiovascular
2 COPD, asthma COPD, asthma Cancers
3 Diarrhea Diarrhea COPD, asthma
4 Perinatal Perinatal Tuberculosis
5 Respiratory
infections
Respiratory
infections
Senility
Adapted from Registrar General of India Report. COPD: Chronic
obstructive pulmonary disease.
overall epidemiologic transition India is experiencing currently.
Another factor that may contribute is the increased awareness
and detection.
The prevalence of high normal blood pressure (also called pre
hypertension in JNC-VII) has been seen in many recent studies
and was found to be around 32% in a recent urban study from
Central India. In some studies from South India (Chennai) and
from Delhi prevalence of high normal blood pressure has been
even higher upto 36% and 44% respectively in these regions. The
prevalence of hypertension increases with age in all populations.
In a recent urban study it increased from 13.7% in the 3rd
decade
to 64% in the 6th
decade.
In last 2 decades the prevalence of hypertension has been
seen to be static in some urban areas. The prevalence of smoking
has declined while that of diabetes, metabolic syndrome,
hypercholesterolemia and obesity has been increasing.26,27
Hypertension awareness, treatment and control status is low,
with only half of the urban and a quarter of the rural hypertensive
individuals being aware of its presence. It has been seen that
only one in five persons is on treatment and less than 5% are
controlled. Rural location is an important determinant of poor
hypertension awareness, treatment and control. It has been said
that in India the rule- of-halves is not valid and only a quarter
to a third of subjects are aware of hypertension.
Preventive measures are required so as to reduce obesity,
increasing physical activity, decreasing the salt intake of the
population and a concerted effort to promote awareness about
hypertension and related risk behaviors. Two upcoming studies
for identification of regional differences of CVD risk factors in
India are the India Heart Watch and PURE studies. PURE26
is a
prospective study localized to five urban and five rural locations
while India Heart Watch27
has centres all over the country. These
studies shall further highlight the prevalence and regional
variations of hypertension as a CVD risk factor.