Wavelet analysis of electrical activity from respiratory muscles during coughing and sneezing in anesthetized rabbits
•
0 likes•143 views

Wavelet analysis of electrical activity from respiratory muscles during coughing and sneezing in anesthetized rabbits, in 84th PHYSIOLOGICAL DAYS, Slovakia, 2008
Recommended

Recommended
More Related Content
Similar to Wavelet analysis of electrical activity from respiratory muscles during coughing and sneezing in anesthetized rabbits
Similar to Wavelet analysis of electrical activity from respiratory muscles during coughing and sneezing in anesthetized rabbits (20)
Recently uploaded
Recently uploaded (20)
Wavelet analysis of electrical activity from respiratory muscles during coughing and sneezing in anesthetized rabbits
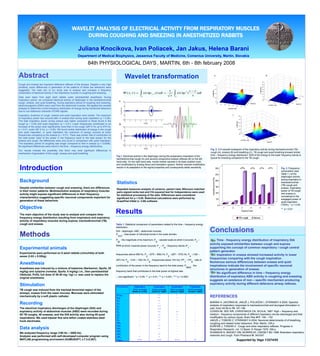
- 1. WAVELET ANALYSIS OF ELECTRICAL ACTIVITY FROM RESPIRATORY MUSCLES DURING COUGHING AND SNEEZING IN ANESTHETIZED RABBITS Juliana Knocikova, Ivan Poliacek, Jan Jakus, Helena Barani Department of Medical Biophysics, Jessenius Faculty of Medicine, Comenius University, Martin, Slovakia dt s t tx s dtttxsW s )()( 1 )()(),( * , 84th PHYSIOLOGICAL DAYS, MARTIN, 6th - 8th february 2008 Results Abstract Cough and sneeze are important defensive reflexes of the airways. Despite a very high similarity, some differences in generation of the patterns of these two behaviors were suggested. The main aim of our study was to analyze and compare a frequency composition of electrical activity in the respiratory muscles in coughing and sneezing. Data were taken from eight adult rabbits under pentobarbital anesthesia. During inspiratory period, we compared electrical activity of diaphragm in the tracheobronchial cough, sneeze, and quiet breathing. During expiratory period of coughing and sneezing, electromyograms (EMG) were used from the abdominal muscles. We applied the wavelet analysis to determine a time-frequency distribution of energy during mentioned behaviors due to non-stationary character of EMG signals. Inspiratory durations of cough, sneeze and quiet inspiration were similar. The maximum of inspiratory power has occured later in sneeze than during quiet inspiration (p < 0.05). The total inspiratory power during sneeze was higher compared to those found in the cough (p < 0.05) and quiet inspiration (p < 0.01). Lower frequencies contributed to an increase of the power even significantly more than in the cough (287.5 Hz up to 575 Hz, p < 0.01; under 287.5 Hz, p < 0.05). We found similar distribution of energy in the cough and quiet inspiration. In quiet inspiration the maximum of energy occured at lower frequencies comparing to the sneeze (p < 0.01). There was similar rate of contribution to the total power (ratio of the power in the frequency band to the total power) for the sneeze and cough, the differences were only found in comparison with quiet inspiration. The expiratory period of coughing was longer compared to that in sneeze (p = 0.0006). No significant differences were found in the time – frequency energy distributions. Our results indicate the possibility that there may exist significant differences in mechanism of generation of the cough, sneeze and quiet breathing. REFERENCES BARÁNI H, JAVORKA M, JAKUŠ J, POLIAČEK I, STRÁNSKY A 2005: Spectral analysis of respiratory responses to tracheobronchial and laryngeal stimulation in cats. Acta Vet Brno 74: 191-198 COHEN MI, SEE WR, CHRISTAKOS CN, SICA AL 1987: High – frequency and medium - frequency components of different inspiratory nerves discharges and their modification by various inputs. Brain Res 417: 148 – 152 JAKUŠ J, TOMORI Z, STRÁNSKY A 2004: Neuronal determinants of of breathing, coughing and related motor behaviors. Wist, Martin, 335 p. KORPÁŠ J, TOMORI Z : Cough and other respiratory reflexes. Progress in Respiration Research, vol. 12 Basel: S. Karger 1979, 356 p. SHANNON R, BAEKEY DM, MORRIS KF, LINDSEY BG 1996: Brainstem respiratory networks and cough. Pulm Phamacol 9: 343/347 Supported by Vega 1/2274/05 Conclusions Time - frequency energy distribution of inspiratory DIA activity exposed similarities between cough and eupnea supporting the concept of common respiratory / cough central pattern generator. Inspiration in sneeze showed increased activity in lower frequencies comparing with the cough inspiration. Numerous serious differences between sneeze and quiet inspirations indicate the involvement of specific neuronal structures in generation of sneeze. No significant difference in time – frequency energy distribution of expiratory ABD activity in coughing and sneezing suggests an existance of non – specific mechanism producing expiratory activity during different defensive airway reflexes. Fig. 2. 3-D wavelet scalogram of the inspiratory activity during tracheobronchial (TB) cough (A), sneeze (B) and breathing (C). TB cough and quiet breathing showed similar time – frequency energy distribution. Shift of the energy to the lower frequency bands is typical for sneezing compared to the TB cough. Introduction Background Despite similarities between cough and sneezing, there are differences in their motor patterns. Multiresolution analysis of respiratory muscles activity might expose significant differences in their frequency characteristics suggesting specific neuronal components important for generation of these behaviors. Objective The main objective of the study was to analyse and compare time- frequency energy distribution resulting from inspiratory and expiratory activity of respiratory muscles during eupnoe, tracheobronchial (TB) cough and sneeze. Methods Experimental animals Experiments were performed on 8 adult rabbits (chinchilla) of both sexes (3.83 0.52kg). Anesthesia Anesthesia was induced by a mixture of ketamine (Narkamon, Spofa; 25 mg/kg) and xylazine (rometar, Spofa; 5 mg/kg) i.m., then pentobarbital (Vetbutal, Polfa, full dose of 30-40 mg / kg) i.v. was used to replace the original anesthesia. Stimulation TB cough was induced from the tracheal-bronchial region of the airways, sneeze from the nasal mucosa. Mucosae were stimulated mechanically by a soft plastic catheter. Recording The electrical inspiratory discharges of the diaphragm (DIA) and expiratory activity of abdominal muscles (ABD) were recorded during 55 TB coughs, 48 sneezes, and the DIA activity also during 45 quiet inspirations. We used bipolar fine wire teflon coated stainless steel hook electrodes. Data analysis We analyzed frequency range (100 Hz – 3000 Hz). Analysis was performed with self-developed computer program using MATLAB programming enviroment (HUMUSOFT, v.7.3.0.267). Fig. 3. Frequency composition (see Table 1.) of the diaphragm activity during inspiration in tracheobronchial (TB) cough and sneeze. Inspiratory power of TB cough and sneeze is normalized to the avegaged power of quiet inspiration (100%). * p < 0.05, ** p < 0.01 Statistics Repeated measures analysis of variance, paired t-test, Wilcoxon matched- pairs signed-ranks test and Chi-squared test for Independence were used for statistical processing of the data. Differences were considered significant for p < 0.05. Statictical calculations were performed by GraphPad InStat (v. 3.06) software. Fig.1. Electrical activity in the diaphragm during the preparatory inspiration of the tracheobronchial cough (A) and several consecutive sneeze reflexes (B) on the left hand side. On the right hand side, morlet mother wavelet in its basic position (red) and modificated by scaling (blue) and translation (green). Mother wavelet modification results in its adaptation to the signal properties and consequently better sensitivity. Wavelet transformation Table 1. Statistical comparison of parameters related to the time – frequency energy distribution. DIA - diaphragm, ABD - abdominal muscles; P TOT - total power of individual bursts in the scale domain, P M - the magnitude of its maximum, P S - wavelet scale at which it occured, P T – time at which maximal power occured, P 1 – P 6 - frequency bands (P 1 – frequencies above 958 Hz, P 2 - (575 – 958) Hz, P 3 - (287 – 575) Hz, P 4 - (192 – 287) Hz, P 5 - (144 – 192) Hz, P 6 - frequencies below 144 Hz), PP 1 – PP 6 - rate of contribution of the power in the frequency band to the total power, P MAX - the frequency band that contributes to the total power at highest rate; -, non-significant; * p < 0.05, ** p < 0.01, *** p < 0.001, **** p < 0.0001