Lundin Gold April 2024 Corporate Presentation v4.pdf
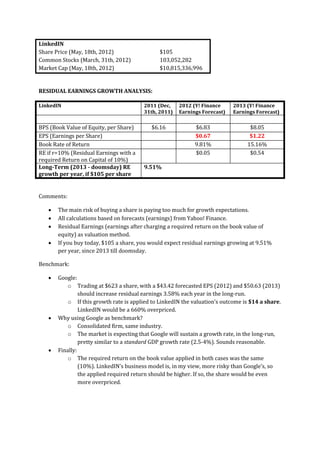
LinkedIN
1. LinkedIN
Share Price (May, 18th, 2012) $105
Common Stocks (March, 31th, 2012) 103,052,282
Market Cap (May, 18th, 2012) $10,815,336,996
RESIDUAL EARNINGS GROWTH ANALYSIS:
LinkedIN 2011 (Dec, 2012 (Y! Finance 2013 (Y! Finance
31th, 2011) Earnings Forecast) Earnings Forecast)
BPS (Book Value of Equity, per Share) $6.16 $6.83 $8.05
EPS (Earnings per Share) $0.67 $1.22
Book Rate of Return 9.81% 15.16%
RE if r=10% (Residual Earnings with a $0.05 $0.54
required Return on Capital of 10%)
Long-Term (2013 - doomsday) RE 9.51%
growth per year, if $105 per share
Comments:
The main risk of buying a share is paying too much for growth expectations.
All calculations based on forecasts (earnings) from Yahoo! Finance.
Residual Earnings (earnings after charging a required return on the book value of
equity) as valuation method.
If you buy today, $105 a share, you would expect residual earnings growing at 9.51%
per year, since 2013 till doomsday.
Benchmark:
Google:
o Trading at $623 a share, with a $43.42 forecasted EPS (2012) and $50.63 (2013)
should increase residual earnings 3.58% each year in the long-run.
o If this growth rate is applied to LinkedIN the valuation’s outcome is $14 a share.
LinkedIN would be a 660% overpriced.
Why using Google as benchmark?
o Consolidated firm, same industry.
o The market is expecting that Google will sustain a growth rate, in the long-run,
pretty similar to a standard GDP growth rate (2.5-4%). Sounds reasonable.
Finally:
o The required return on the book value applied in both cases was the same
(10%). LinkedIN’s business model is, in my view, more risky than Google’s, so
the applied required return should be higher. If so, the share would be even
more overpriced.