Infographic Debunking SharePoint Myths on Data Visualization and BI
•
0 likes•983 views

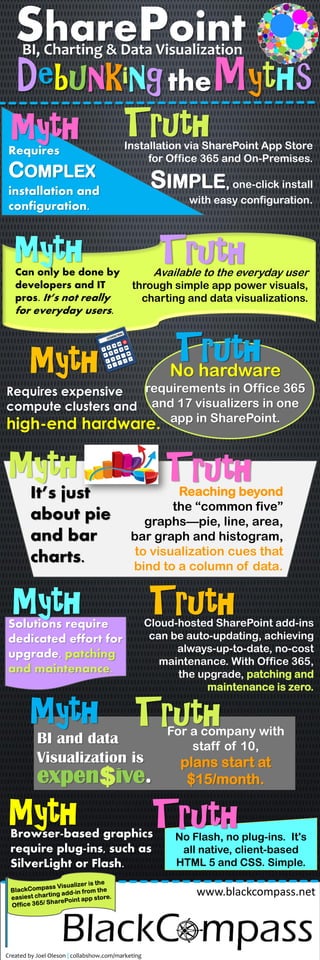
This document debunks common myths about business intelligence (BI), charting, and data visualization. It discusses that these tools can be used by everyday users through simple apps and visualizations in SharePoint without requiring expensive hardware, complex installation, or dedicated maintenance efforts. A variety of chart types are supported beyond basic charts through browser-based HTML5 and CSS without plugins.
Recommended

Recommended
More Related Content
Similar to Infographic Debunking SharePoint Myths on Data Visualization and BI
Similar to Infographic Debunking SharePoint Myths on Data Visualization and BI (20)
More from Joel Oleson
More from Joel Oleson (20)
Recently uploaded
Recently uploaded (20)
Infographic Debunking SharePoint Myths on Data Visualization and BI
- 1. expen ive. DebunkingtheMyths BI, Charting & Data Visualization SharePoint Truth Can only be done by developers and IT pros. It’s not really for everyday users. Myth Available to the everyday user through simple app power visuals, charting and data visualizations. Truth Requires expensive compute clusters and high-end hardware. No hardware requirements in Office 365 and 17 visualizers in one app in SharePoint. TruthMyth It’s just about pie and bar charts. Reaching beyond the “common five” graphs—pie, line, area, bar graph and histogram, to visualization cues that bind to a column of data. Myth Truth Solutions require dedicated effort for upgrade, patching and maintenance. Cloud-hosted SharePoint add-ins can be auto-updating, achieving always-up-to-date, no-cost maintenance. With Office 365, the upgrade, patching and maintenance is zero. Myth Truth Browser-based graphics require plug-ins, such as SilverLight or Flash. No Flash, no plug-ins. It's all native, client-based HTML 5 and CSS. Simple. Myth Truth www.blackcompass.net Installation via SharePoint App Store for Office 365 and On-Premises. SIMPLE, one-click install with easy configuration. BI and data Visualization is $ For a company with staff of 10, plans start at $15/month. Myth Truth Created by Joel Oleson | collabshow.com/marketing Requires COMPLEX installation and configuration. Myth