1.
Key
Data
Current
Price
$97.77
Market
Cap
(bn)
$32.92
Earnings
Per
Share
$10.92
Price
Earnings
Ratio
8.95
Long-‐Term
Debt
to
Equity
14.28
Return
on
Equity
13.34%
Book
Value
per
Share
$84.83
Dividend
Yield
2.60%
Current
Position:
Recommendation:
Overweight
Position
Outlook:
Three
Year
Value
Financials
(fiscal
year
ending
12/13)
in
mn
$
Revenue
44,445
Investments
60,928
Operating
Income
3,217
Operating
Cash
Flow
4,022
Net
Premiums
Written
17,025
Long-‐term
Debt
3,807
Cash
Reserves
579
Analyst
consensus
(ft.com)
Recommendation
Hold/Outperform
12
month
Price
Target
108.50
(+11.1%)
Dividend
Growth
+26.5%
Credit
Rating
Short
Term
Long
Term
Moody’s
Aa3,
A1/Stable
A3
Fitch
AA/Stable
A-‐
S&P
AA-‐/Positive
A
ACE
Ltd.
(NYSE:ACE)
is
a
fast
growing
property
and
casualty
insurer
with
an
exceptional
talent
at
pricing
risk.
It
is
also
expanding
globally
which
means
that
it
will
be
able
to
spread
risk
more
widely
going
into
the
future.
The
company
has
a
strong
record
of
beating
earnings
estimates
and
likely
to
further
increase
dividends.
The
stock
has
a
relatively
low
P/E
ratio
in
the
US
insurance
market,
high
earnings
per
share,
and
strong
fundamentals,
making
it
a
great
value
pick.
Strengths
• Pricing
risk-‐
more
resilient
than
competitors
• Rapid
expansion
to
EM
• Increasing
book
value
• Leadership
Weaknesses
• Underperforming
against
S&P
500
• Poor
performance
in
crop
business
last
year
Opportunities
• Dividend
increase
• Capturing
capital
as
investors
move
from
fixed
income
into
equities
as
interest
rates
increase
Threats
• Natural
disasters
• Climate
change
• Weakness
in
EM
March
2014
US
Virtual
Investment
Fund
ACE
Limited
(NYSE:ACE)
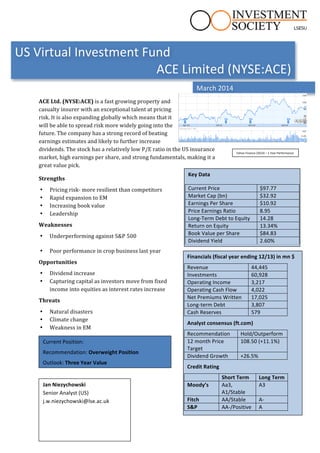
Yahoo
Finance
(2014)
–
1
Year
Performance
Jan
Niezychowski
Senior
Analyst
(US)
j.w.niezychowski@lse.ac.uk
2.
1.
Insurance
Sector
Overview
• Companies
in
the
industry
must
brace
for
increased
regulation
in
the
US-‐
focus
may
shift
to
securitised
insurance
risks,
synthetic
investment
portfolios,
etc.
• Net
income
premium
growth
is
increasing
year
on
year
(2012-‐
3.7%,
2013-‐4.5%)-‐
Deloitte
property
and
casualty
insurance
outlook
• Most
successful
businesses
in
2014
will
invest
in
“transformative
technology
with
high
ROI”-‐
EY
2014
US
property
and
casualty
insurance
outlook
• M&A
trends
firmly
downward
from
2008-‐2013
(in
terms
of
price/book
value
as
well
as
deal
value).
• Strong
underwriting
opportunities
in
“pockets
of
opportunity”-‐
need
to
look
at
regional
difference
and
exploit
them
• There
exists
a
greater
focus
on
risk
and
capital
management
in
investments-‐
but
those
who
outperform
will
tap
into
opportunities
in
emerging
economies
Industrial
Sector:
Telecoms
(EU)
Risk
Potential
Sector
Uncertainty
in
emerging
markets
investment
Other
opportunities
remain
in
EM,
such
as
accessing
local
markets
in
M&A
deals
Growth
Regulatory
uncertainty
leaves
US
insurance
market
in
a
holding
pattern,
could
continue
through
2014
Continued
growth
in
net
underwriting
income
may
ease
the
potential
future
cost
of
presenting
more
data
on
risk
exposure
Value
Low
P/E
multiples
in
industry
as
a
whole,
underperforming
S&P
500
Protection
against
asset
bubble
that
may
be
forming?
Underperformance
may
leave
industry
as
great
value
buy
Yield
Dividend
has
been
rising
rapidly
in
the
last
year.
Room
for
much
more?
Underwriting
profits
increasing
as
is
global
expansion,
leaving
more
room
for
increased
dividends
Market
Risk
in
EM
Still
lots
of
potential
in
M&A
deals
a.
Macroeconomic
Drivers
The
main
economic
intuition
for
investing
in
the
insurance
market
is
based
on
a
prediction
that
interest
rates
are
going
to
increase
in
the
near
future.
This
will
shift
fixed
asset
investors
into
equities.
Insurance
companies
may
not
have
the
largest
dividend
yields,
but
stability
is
what
these
investors
will
prefer.
Insurance
companies
also
have
large
capital
investments
in
fixed
income,
which
reduced
the
equity
risk
on
their
performance.
While
investment
gains
are
important,
underwriting
income
growth
typically
drives
the
stocks
in
this
sector,
and
as
the
global
economy
grows,
this
income
will
too
for
international
P&C
insurers.
2.
ACE
Limited
Management
sees
its
Property
&
Casualty
business
divided
in
2
separate
strands:
Global
P&C,
and
Agriculture,
due
to
the
different
nature
of
the
two
business
lines.
3.
a.
Global
Property
and
Casualty
This
includes
the
company’s
Insurance
–
North
American
P&C,
Insurance
–
Overseas
General
and
Global
Reinsurance
segments.
It
is
the
better
performing
part
of
the
business,
and
what
makes
the
company
especially
attractive
for
investors.
The
business’s
spectacular
growth
in
underwriting
income
of
111.2%
this
year
mostly
generated
by
Global
P&C.
It
was
also
due
to
relatively
tame
catastrophe
losses
in
the
year.
Another
factor
was
the
new
M&A
deals,
such
as
the
acquisition
of
a
Mexican
personal
lines
business
which
contributed
to
a
40%
increase
in
the
business.
However,
if
the
effect
of
the
acquisition
is
taken
out,
the
PL
business
still
grew
11%
on
the
year.
b.
Agriculture
The
agriculture
business
line
saw
a
12.5%
reduction
in
net
premiums
written
on
2012.
This
has
been
the
main
struggle
for
the
business
line
for
the
past
two
years.
However
it
was
largely
an
increase
in
the
amount
of
reinsurance
that
the
company
bought.
Lower
commodity
prices
led
to
lower
premiums
(Q4
Earnings
Conference
Call).
3.
Investments
Source:
ACE
2013
Form
10K
Here
we
can
see
how
the
company’s
capital
is
managed.
It
is
a
well-‐diversified
investment
portfolio
consisting
of
fixed
assets,
asset
and
mortgage
backed
securities
as
well
as
short
term
investments.
Additionally,
the
investments
have
considerable
4.
exposure
to
foreign
fixed
income
assets
totalling
$7,255
million.
There
is
however
no
exposure
to
distressed
European
economies
including
Portugal,
Ireland,
Italy,
Greece
and
Spain
as
ACE
looks
for
limited
risk
and
longevity
in
their
investments.
Net
investment
income
totalled
$2.1
billion
which
is
2%
lower
than
2012,
however
is
a
quite
impressive
when
the
environment
of
ultralow
interest
rates
are
factored
in
to
the
performance.
(Q4
2013
Earnings
Conference
Call).
4.
Growth
Prospects
The
company
is
poised
for
future
growth.
M&A
activity
combined
with
solid
fundamentals
are
the
foundation
for
this.
However,
ACE
has
also
been
sowing
the
seeds
for
future
success
by
growing
their
P&C
net
premiums
written
by
almost
20%
just
in
the
last
quarter
of
2013.
This
growth
came
from
across
the
board
of
all
of
all
their
product
lines
(except
agriculture).
a.
Recent
M&A
(i.)
Acquisition
of
ABA
Seguros,
Mexico
In
early
May
2013,
ACE
bought
the
fourth
largest
personal
lines
insurer
in
Mexico
for
approximately
$690
million
in
cash.
This
well
established
company
has
50
year
of
expertise
in
the
Mexican
market.
It
also
shows
ACE’s
commitment
to
conducting
more
business
abroad,
as
this
has
been
a
trend
for
several
years.
This
exposes
the
company
to
wider
global
opportunities
for
growth
and
increases
its
diversification
in
policies.
4.
Competitor
Comparison
Source:
Morningstar.com
5.
a.
Key
indicators
Here
we
can
see
that
ACE
has
a
huge
5
year
revenue
CARG
(compound
annual
growth
rate)
of
7.2%
which
is
more
than
twofold
the
next
highest
among
their
competitors.
This
is
in
spite
of
being
the
biggest
P&C
insurer
(by
market
cap)
already.
The
figure
is
partly
explained
by
ACE’s
M&A
activity,
but
a
large
chuck
of
it
is
also
from
organic
growth
in
underwriting
income.
Even
though
having
posted
large
growth,
ACE
has
a
P/E
ratio
of
just
8.9
which
is
the
second
lower
of
its
competitors.
Another
Impressive
statistic
is
the
company’s
Med
Operating
Margin
which
is
on
the
top
end.
This
is
interesting
as
Evan
Greenberg,
the
CEO
of
ACE
has
said
(Q4
Earning
Conference
Call)
that
the
focus
right
now
is
growth,
and
then
a
widening
of
margins.
This
is
good
news
for
the
firm
and
means
that
there
is
plenty
more
room
for
improvement
in
the
margins
as
the
company
shifts
its
focus
to
this.
The
dividend
has
grown
by
80%
since
the
beginning
of
2012.
The
debt
to
earnings
ratio
is
also
one
of
the
lowest
among
the
group.
b.
Pricing
Risk
ACE
is
exceptional
at
pricing
risk.
This
is
important
in
the
long-‐term
success
of
the
company
as
the
future
is
unpredictable
and
undercutting
the
competition
and
taking
too
much
risk
was,
as
learned
in
the
case
of
AIG,
disastrous.
Source:
ACE
Annual
Report
2012
5.
Portfolio
With
anticipated
increase
in
interest
rates,
investors
in
the
fixed
income
market
will
look
to
shift
into
relatively
high
dividend
equities,
but
ones
that
are
stable
and
perform
more
like
a
fixed
income
asset.
ACE
looks
to
be
a
strong
here
with
a
long
history
of
solid
growth
and
performance.
This
stock
also
looks
attractive
to
investors
looking
to
take
profits
from
overheating
stocks
as
the
DJIA
is
near
historical
highs.
Considering
these
macro
drivers,
the
strong
outlook
for
the
future
growth
of
ACE,
and
the
fact
that
this
is
the
only
asset
with
exposure
to
the
financial
sector,
I
suggest
a
weighting
of
10%
of
the
US
Fund.