November 2010 monthly fire rescue report final
•
0 likes•269 views

The monthly report for November 2010 from the Dania Beach Fire-Rescue Department showed a 10% increase in call volume over November 2009. Training hours increased substantially to over 1800 hours due to ISO compliance mandates and additional staff from a SAFER grant. The fire prevention division reviewed over 500,000 square feet of property and submitted $22,160 in fees. Transport numbers and collections continued an upward trend compared to previous years.

Recommended
More Related Content
Viewers also liked
Viewers also liked (19)
Similar to November 2010 monthly fire rescue report final
Similar to November 2010 monthly fire rescue report final (14)
More from city of dania beach
More from city of dania beach (20)
November 2010 monthly fire rescue report final
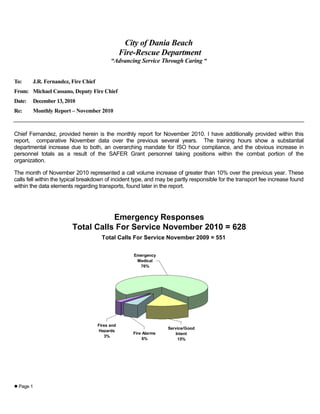
- 1. City of Dania Beach Fire-Rescue Department “Advancing Service Through Caring “ To: J.R. Fernandez, Fire Chief From: Michael Cassano, Deputy Fire Chief Date: December 13, 2010 Re: Monthly Report – November 2010 Chief Fernandez, provided herein is the monthly report for November 2010. I have additionally provided within this report, comparative November data over the previous several years. The training hours show a substantial departmental increase due to both, an overarching mandate for ISO hour compliance, and the obvious increase in personnel totals as a result of the SAFER Grant personnel taking positions within the combat portion of the organization. The month of November 2010 represented a call volume increase of greater than 10% over the previous year. These calls fell within the typical breakdown of incident type, and may be partly responsible for the transport fee increase found within the data elements regarding transports, found later in the report. Emergency Responses Total Calls For Service November 2010 = 628 Total Calls For Service November 2009 = 551 Emergency Medical 76% Fires and Service/Good Hazards Fire Alarms Intent 3% 6% 15% Page 1
- 2. ORGNAIZATIONAL PILLARS: *Professional Development, *Operational Improvement, *Fiscal Responsibility, and *Customer Service Training for the month of November totaled over 1800 hours for combat personnel, that total represents a single month training hour record for Dania Beach Fire Rescue! The bulk of the training fulfilled necessary ISO compliance issues, regarding; night training, facility training, and overall 20 hour per month firefighter training. Additionally, as seen below, the EMS Division, through Chief Caruso’s leadership, initiated employee professional development training emphasis, on medical competencies regarding; protocols, and ACLS reviews TRAINING Operational Improvement Pillar: Professional Development Customer Service / Community Outreach November 2009 Total Hours: 1389 November 2010 Total Hours: 1822 Fire/ISO Fire/ISO 66% 56% EM 26 EMS 17% Other Other 18% 17% Fire EMS Other AD Hoc Fire EMS Other SOG Review Driver Training Training RIT Night Drill Protocols Extrication Probationary Company RIT Training Training Inspections Rescue Physical Ropes and Knots Maintenance Fitness Apparatus Specialized Shift Maintenance Hose Training Meetings ACLS Engine Premise Survey Review Equipment Fire Officer Apparatus Officer Class Maintenance Training Hose Lays Power Saws 2 Page
- 3. ORGANIZATIONAL PILLARS: *Fiscal Responsibility, *Customer Service, *Health, Safety, and Wellness, and *Operational Improvement The ongoing assessment of automatic aid run volume parity is presented here. Dania Beach continues to provide the greater amount of call volume support, running between 10 – 20% greater number of incidents of auto-aid assistance than that of Hollywood Fire Rescue, month to month. The overall assessment however strongly supports the “Closest Unit Response” model and the overall theme which Dania Beach signed on to as part of the Mobile Data Terminal Program through Broward County. Automatic Aid November 2010 Given 125 Received 114 November 2009 Given 101 Received 109 160 140 120 100 Given 80 Received 60 40 20 0 Jan Feb Mar Apr May Jun Jul Aug Sep Oct Nov 3 Page
- 4. ORGANIZATIONAL PILLARS: *Operational Improvement, *Fiscal Responsibility, and *Health, Safety, and Wellness Through an ongoing effort to reach firefighters with a monthly safety tip, Captain, Bruce Liem developed and instituted “THE SAFETY ZONE” The whimsical approach to firefighter safety tips is presented each month to all personnel through the on-shift Battalion Chief. The idea is to capture a critical safety principle through the to use of a poster and “take home” message, as part of the IAFF nationally sponsored, “Everyone Goes Home” campaign. This month’s theme was centered around driver safety. Along with it’s safety principals, the “Driver Safety” Tips, provided within the “Safety Zone”, helps to reinforce the necessity to always drive defensive! The module also fulfills principals within our Fiscal Responsibility PILLAR; keeping citizens, personnel, and our apparatus out of harms way. 4 Page
- 5. ORGANIZATIONAL PILLARS: *CUSTOMER SERVICE & COMMUNITY OUTREACH, *FISCAL RESPONSIBILITY, *OPERATIONAL IMPROVEMENT FIRE PREVENTION & LIFE SAFETY DIVISION: Presented below are the Fire Prevention Division productivity figures for November 2010, with previous year comparatives for trending assessment purposes. The report which tracks a current “turn-around-time” for plan reviews, has reached a “customer friendly” processing rate of a plan review done in just one day! Inspected Properties: 2010: 315 2009: 276 2008: 223 Square Footage Reviewed # Plans Time Spent Turn-around Time Back to Customer 2010: 582,000 51 55hrs 1.3 Day turn around to customer 2009: 444,000 45 27hrs 3.8 Day turn around to customer 2008: 379,000 32 37hrs 2.8 Day turn around to customer Fees: Submitted November to Finance (without impact fees / matches Finance Total through H.T.E.): 2010: $22,160.00 2009: $20,265.00 2008: $18,465.00 5 Page
- 6. PILLAR: FISCAL RESPONSIBILITY EMERGENCY MEDICAL SERVICES TRANSPORT FIGURES REPORT Transport Totals 4,000 3,283 3,377 3,316 3,462 3,286 3,382 3,000 2,000 1,000 262 272 - FY FY FY FY FY FY FYTD FYTD 2005 2006 2007 2008 2009 2010 2010 2011 Collections/Deposits Analysis $900,000 $808,781$789,756$798,741$820,252 $793,908 $800,000 $734,236 $700,000 $608,137 $600,000 $500,000 $400,000 $300,000 $200,000 $58,046 $94,799 $100,000 $- FY FY FY FY FY FY FY FYTD FYTD 2004 2005 2006 2007 2008 2009 2010 2010 2011 Transport Comparison by Month 350 300 250 200 150 100 50 0 v n n l c g r ar pt b ct ay Ju Ap No Ja Ju De Au Fe Se O M M FY 2007 FY 2008 FY 2009 FY 2010 FY 2011 6 Page
- 7. Fiscal Year Comparison $900,000 $800,000 $700,000 $600,000 $500,000 $400,000 $300,000 $200,000 $94,799 $58,046 $100,000 $- FYTD 2010 FYTD 2011 Monthly Collection Comparison for FY05 - Present $120,000 $100,000 $80,000 $60,000 $40,000 $20,000 $0 n ay n l ov ec g ct pt ar r b Ju Ap Ja Ju Fe Au O Se M M N D FY 2005 FY 2006 BLS & ALS Ratios 100% 77% 80% 80% 73% 64% 66% 65% 66% 60% 35% 33% 34% 32% 40% 26% 21% 19% 20% 1% 1% 1% 2% 1% 2% 1% 0% FY 2005 FY 2006 FY 2007 FY 2008 FY 2009 FY 2010 FY 2011 BLS ALS1 ALS2 7 Page
- 8. Charge Mix Medicare Self Pay 22% 32% Medicaid 21% Insurance 25% Payor Mix Self Pay 6% Medicare 30% Insurance 53% Medicaid 11% The November 2010 Report is submitted herein for your review and comment. Respectfully submitted, Michael Cassano, Deputy Fire Chief 8 Page