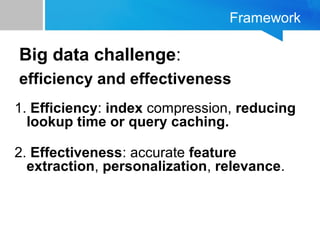
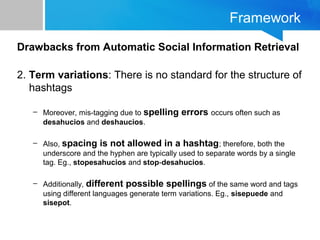
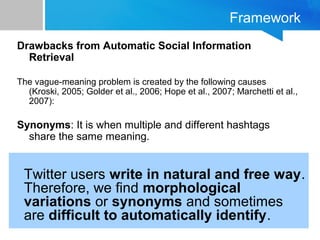
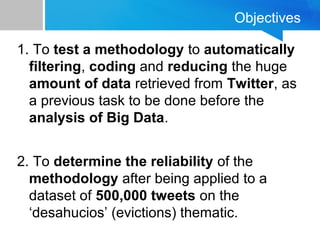
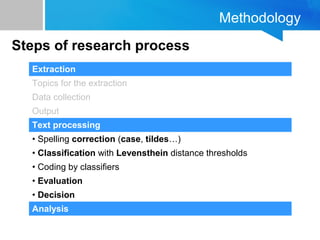
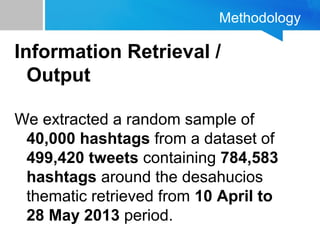
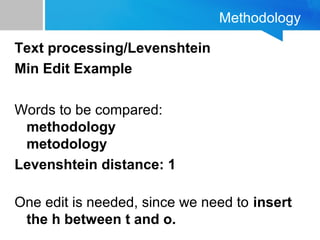
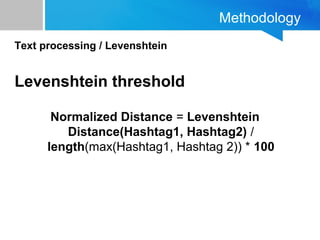
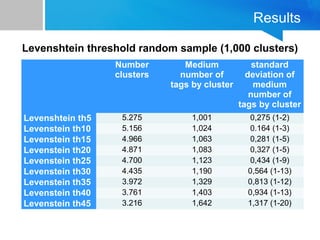
What happen after crawling Big Data?
Defining a process of filtering and
automatically coding extracted Big Data from
Twitter for social uses
José Carpio, jose.carpio@dti.uhu.es
Juan D. Borrero, jdiego@uhu.es
Estrella Gualda, estrella@uhu.es
1st IMASS conference, Methods and Analyses in Social Sciences, 23-24 April 2014, Olhão, Portugal,
Table of content
1. Introduction
2. Focus and Topic
3. Framework
4. Objectives
5. Methodology
6. Results
7. Conclusions
8. Future research
Table of Contents
Introduction1 IntroductionIntroductionIntroduction
1.Introduction
1. Big Data as a huge amount of digital
information, so big and so complex
that usual database technology
cannot process efficiently.
2. The advent social web has made a
significant contribution to the
explosion of information from social
computing systems such as Twitter,
Facebook, Pinterest, Youtube…
1.Introduction
Big data
offers the
social sciences and humanistic
disciplines
new opportunities
of approaching the
knowledge
of particular
social realities
when considering messages
from social media sites.
1.Introduction
Some studies are already deploying
automatic data extraction techniques
(Ackland and O’Neil, 2011; Carmel et al.,
2009; Jones et al., 2008; Shumate and
Dewitt, 2008; Wang and Jin, 2010; Xu et
al., 2008) on big data.
Before analysis, a previous task would be
filtering and coding the automatically
crawled data, in order to reduce and
“prepare” the information.
Table of Contents
Introduction1Focus and Topic
Focus
What is twitter?
Twitter is a free social networking and micro-
blogging service that enables its users to send
and read messages known as tweets.
Tweets are text-based posts of up to 140
characters displayed on the author's profile
page and delivered to the author's subscribers
who are known as followers.
What are hashtags?
People use the hashtag symbol # before a
relevant keyword or phrase (no spaces) in their
Tweet to categorize them.
(https://support.twitter.com/entries/49309)
Topic
Desahucios (Evictions)
It has to do with the rise of housing or
eviction by enforcement due to non-
payment of rent or mortgage.
This theme refers to a social crisis
caused by the economic crisis in
Spain.
Topic
¿What is the problem?
The same concept are tagged with different tags.
SpanishRevolution == RevolutionInSpain
Table of Contents
Introduction1 Framework
Framework
Big data challenge:
efficiency and effectiveness
1. Efficiency: index compression, reducing
lookup time or query caching.
2. Effectiveness: accurate feature
extraction, personalization, relevance.
Framework
Drawbacks from Automatic Social Information Retrieval
2. Term variations: There is no standard for the structure of
hashtags
– Moreover, mis-tagging due to spelling errors occurs often such as
desahucios and deshaucios.
– Also, spacing is not allowed in a hashtag; therefore, both the
underscore and the hyphen are typically used to separate words by a single
tag. Eg., stopesahucios and stop-desahucios.
– Additionally, different possible spellings of the same word and tags
using different languages generate term variations. Eg., sisepuede and
sisepot.
Framework
Drawbacks from Automatic Social Information
Retrieval
The vague-meaning problem is created by the following causes
(Kroski, 2005; Golder et al., 2006; Hope et al., 2007; Marchetti et al.,
2007):
Synonyms: It is when multiple and different hashtags
share the same meaning.
Twitter users write in natural and free way.
Therefore, we find morphological
variations or synonyms and sometimes
are difficult to automatically identify.
Table of Contents
Introduction1 Objectives
Objectives
1. To test a methodology to automatically
filtering, coding and reducing the huge
amount of data retrieved from Twitter, as
a previous task to be done before the
analysis of Big Data.
2. To determine the reliability of the
methodology after being applied to a
dataset of 500,000 tweets on the
‘desahucios’ (evictions) thematic.
Table of Contents
Introduction1 Methodology
Methodology
Extraction
Topics for the extraction
Data collection
Output
Text processing
• Spelling correction (case, tildes…)
• Classification with Levensthein distance thresholds
• Coding by classifiers
• Evaluation
• Decision
Analysis
Steps of research process
Methodology
Information Retrieval /
Topics for the extraction
”desahucios”
“desahucios”
“stopdesahucios”
#stopdesahucios
@stopdesahucios
@stop_desahucios
Methodology
Information Retrieval /
Output
We extracted a random sample of
40,000 hashtags from a dataset of
499,420 tweets containing 784,583
hashtags around the desahucios
thematic retrieved from 10 April to
28 May 2013 period.
Methodology
Text processing
Hashtags on this sample were
automatically filtered, codified and
reduced according different
algorithms.
We aim to reduce noisy.
Methodology
Text processing / Labeling correction
How do I come up other corrections?
We need a distance metric. We used the Levenshtein
distance (edit distance). Created by Vladimir
Levenshtein, this algorithm measures the
differences/distance between two strings.
It is done by calculating the minimum number of
insertions, deletions, and substitutions for
transforming one string into another.
Methodology
Text processing/Levenshtein
Min Edit Example
Words to be compared:
methodology
metodology
Levenshtein distance: 1
One edit is needed, since we need to insert
the h between t and o.
Methodology
Text processing / Levenshtein
Levenshtein threshold
Normalized Distance = Levenshtein
Distance(Hashtag1, Hashtag2) /
length(max(Hashtag1, Hashtag 2)) * 100
Table of Contents
Introduction1 Results
Results
Number
clusters
Medium
number of
tags by cluster
standard
deviation of
medium
number of
tags by cluster
Levenshtein th5 5.275 1,001 0,275 (1-2)
Levenstein th10 5.156 1,024 0.164 (1-3)
Levenstein th15 4.966 1,063 0,281 (1-5)
Levenstein th20 4.871 1,083 0,327 (1-5)
Levenstein th25 4.700 1,123 0,434 (1-9)
Levenstein th30 4.435 1,190 0,564 (1-13)
Levenstein th35 3.972 1,329 0,813 (1-12)
Levenstein th40 3.761 1,403 0,934 (1-13)
Levenstein th45 3.216 1,642 1,317 (1-20)
Levenshtein threshold random sample (1,000 clusters)
Results
Number of
clusters
Levenshtein th5 5.275
Levenstein th10 5.156
Levenstein th15 4.966
Levenstein th20 4.871
Levenstein th25 4.700
Levenstein th30 4.435
Levenstein th35 3.972
Levenstein th40 3.761
Levenstein th45 3.216
Levenstein th50 3.028
Levenstein th55 2.005
0
1.000
2.000
3.000
4.000
5.000
6.000
5 10 15 20 25 30 35 40 45 50 55
Levenhstein threshold
# of clusters
What Levenshtein threshold choose?
Results
Classifiers
results
ONLY 1 #
GROUPED IN
THE CLUSTER
2 OR MORE #
GROUPED IN
THE CLUSTER
1=CORRECT 2 = FALSE % of correct
groupings (1
canceling the
label are
always correct)
Tags_th5 100%
 
No information 100% 0 not applicable
Tags_th10 97,4% 2,6% 100% 0 not applicable
Tags_th15 94,9% 5,1% 95,8% 4,2% 96,1%
Tags_th20 91,9% 8,1% 99,7% 0,7% 91,4%
Tags_th25 91,1% 8,9% 97,8% 2,2% 75,3%
Tags_th30 87,0% 13% 94,7% 5,3% 59,2%
Tags_th35 79,0% 21,0% 89,4% 10,6% 50,0%
Tags_th40 75,3% 24,7% 85,1% 14,9% 39,7%
Tags_th45 67,9% 32,1% 76,9% 23,1% 28%
Tags_th50 63,2% 36,8% 70,2% 29,9% 19%
Tags_th55 47,0% 53,0% 50,5% 45,5% 6,6%
Classifiers assessing Levenstein Results
Table of Contents
Introduction1 Conclusions
Conclusions
Decision
5th 10th 15th 20th 25th 30th 35th 40th 45th 50th 55th
___ # Correctly classify clusters
Conclusions
Decision
5th 10th 15th 20th 25th 30th 35th 40th 45th 50th 55th
___ # Correctly classify clusters
91,4
75,3
Conclusions
Decision
Find out balance between data reduction 
(clusters) and precision
Final decision related to research criteria
(accuracy / cost)
Table of Contents
Introduction1Future research
Future research
Processing
• Remove repeated characters
• Use thesaurus (e.g. GNU Aspell)
• Solve the synonym problems
Coding
• Code other entities (e.g. authors)
• José Carpio (jose.carpio@dti.uhu.es)
• Juan D. Borrero (jdiego@uhu.es)
• Estrella Gualda (estrella@uhu.es)
University of Huelva
Acknowledges
Thanks a lot for your attention!
Muito obrigado pela sua atenção!

What happen after crawling big data?

  • 1.
    What happen aftercrawling Big Data? Defining a process of filtering and automatically coding extracted Big Data from Twitter for social uses José Carpio, jose.carpio@dti.uhu.es Juan D. Borrero, jdiego@uhu.es Estrella Gualda, estrella@uhu.es 1st IMASS conference, Methods and Analyses in Social Sciences, 23-24 April 2014, Olhão, Portugal,
  • 2.
    Table of content 1.Introduction 2. Focus and Topic 3. Framework 4. Objectives 5. Methodology 6. Results 7. Conclusions 8. Future research
  • 3.
    Table of Contents Introduction1IntroductionIntroductionIntroduction
  • 4.
    1.Introduction 1. Big Dataas a huge amount of digital information, so big and so complex that usual database technology cannot process efficiently. 2. The advent social web has made a significant contribution to the explosion of information from social computing systems such as Twitter, Facebook, Pinterest, Youtube…
  • 5.
    1.Introduction Big data offers the socialsciences and humanistic disciplines new opportunities of approaching the knowledge of particular social realities when considering messages from social media sites.
  • 6.
    1.Introduction Some studies arealready deploying automatic data extraction techniques (Ackland and O’Neil, 2011; Carmel et al., 2009; Jones et al., 2008; Shumate and Dewitt, 2008; Wang and Jin, 2010; Xu et al., 2008) on big data. Before analysis, a previous task would be filtering and coding the automatically crawled data, in order to reduce and “prepare” the information.
  • 7.
  • 8.
    Focus What is twitter? Twitteris a free social networking and micro- blogging service that enables its users to send and read messages known as tweets. Tweets are text-based posts of up to 140 characters displayed on the author's profile page and delivered to the author's subscribers who are known as followers. What are hashtags? People use the hashtag symbol # before a relevant keyword or phrase (no spaces) in their Tweet to categorize them. (https://support.twitter.com/entries/49309)
  • 9.
    Topic Desahucios (Evictions) It hasto do with the rise of housing or eviction by enforcement due to non- payment of rent or mortgage. This theme refers to a social crisis caused by the economic crisis in Spain.
  • 10.
    Topic ¿What is theproblem? The same concept are tagged with different tags. SpanishRevolution == RevolutionInSpain
  • 11.
  • 12.
    Framework Big data challenge: efficiencyand effectiveness 1. Efficiency: index compression, reducing lookup time or query caching. 2. Effectiveness: accurate feature extraction, personalization, relevance.
  • 13.
    Framework Drawbacks from AutomaticSocial Information Retrieval 2. Term variations: There is no standard for the structure of hashtags – Moreover, mis-tagging due to spelling errors occurs often such as desahucios and deshaucios. – Also, spacing is not allowed in a hashtag; therefore, both the underscore and the hyphen are typically used to separate words by a single tag. Eg., stopesahucios and stop-desahucios. – Additionally, different possible spellings of the same word and tags using different languages generate term variations. Eg., sisepuede and sisepot.
  • 14.
    Framework Drawbacks from AutomaticSocial Information Retrieval The vague-meaning problem is created by the following causes (Kroski, 2005; Golder et al., 2006; Hope et al., 2007; Marchetti et al., 2007): Synonyms: It is when multiple and different hashtags share the same meaning. Twitter users write in natural and free way. Therefore, we find morphological variations or synonyms and sometimes are difficult to automatically identify.
  • 15.
  • 16.
    Objectives 1. To testa methodology to automatically filtering, coding and reducing the huge amount of data retrieved from Twitter, as a previous task to be done before the analysis of Big Data. 2. To determine the reliability of the methodology after being applied to a dataset of 500,000 tweets on the ‘desahucios’ (evictions) thematic.
  • 17.
  • 18.
    Methodology Extraction Topics for theextraction Data collection Output Text processing • Spelling correction (case, tildes…) • Classification with Levensthein distance thresholds • Coding by classifiers • Evaluation • Decision Analysis Steps of research process
  • 19.
    Methodology Information Retrieval / Topicsfor the extraction ”desahucios” “desahucios” “stopdesahucios” #stopdesahucios @stopdesahucios @stop_desahucios
  • 20.
    Methodology Information Retrieval / Output Weextracted a random sample of 40,000 hashtags from a dataset of 499,420 tweets containing 784,583 hashtags around the desahucios thematic retrieved from 10 April to 28 May 2013 period.
  • 21.
    Methodology Text processing Hashtags onthis sample were automatically filtered, codified and reduced according different algorithms. We aim to reduce noisy.
  • 22.
    Methodology Text processing /Labeling correction How do I come up other corrections? We need a distance metric. We used the Levenshtein distance (edit distance). Created by Vladimir Levenshtein, this algorithm measures the differences/distance between two strings. It is done by calculating the minimum number of insertions, deletions, and substitutions for transforming one string into another.
  • 23.
    Methodology Text processing/Levenshtein Min EditExample Words to be compared: methodology metodology Levenshtein distance: 1 One edit is needed, since we need to insert the h between t and o.
  • 24.
    Methodology Text processing /Levenshtein Levenshtein threshold Normalized Distance = Levenshtein Distance(Hashtag1, Hashtag2) / length(max(Hashtag1, Hashtag 2)) * 100
  • 25.
  • 26.
    Results Number clusters Medium number of tags bycluster standard deviation of medium number of tags by cluster Levenshtein th5 5.275 1,001 0,275 (1-2) Levenstein th10 5.156 1,024 0.164 (1-3) Levenstein th15 4.966 1,063 0,281 (1-5) Levenstein th20 4.871 1,083 0,327 (1-5) Levenstein th25 4.700 1,123 0,434 (1-9) Levenstein th30 4.435 1,190 0,564 (1-13) Levenstein th35 3.972 1,329 0,813 (1-12) Levenstein th40 3.761 1,403 0,934 (1-13) Levenstein th45 3.216 1,642 1,317 (1-20) Levenshtein threshold random sample (1,000 clusters)
  • 27.
    Results Number of clusters Levenshtein th55.275 Levenstein th10 5.156 Levenstein th15 4.966 Levenstein th20 4.871 Levenstein th25 4.700 Levenstein th30 4.435 Levenstein th35 3.972 Levenstein th40 3.761 Levenstein th45 3.216 Levenstein th50 3.028 Levenstein th55 2.005 0 1.000 2.000 3.000 4.000 5.000 6.000 5 10 15 20 25 30 35 40 45 50 55 Levenhstein threshold # of clusters What Levenshtein threshold choose?
  • 28.
    Results Classifiers results ONLY 1 # GROUPEDIN THE CLUSTER 2 OR MORE # GROUPED IN THE CLUSTER 1=CORRECT 2 = FALSE % of correct groupings (1 canceling the label are always correct) Tags_th5 100%   No information 100% 0 not applicable Tags_th10 97,4% 2,6% 100% 0 not applicable Tags_th15 94,9% 5,1% 95,8% 4,2% 96,1% Tags_th20 91,9% 8,1% 99,7% 0,7% 91,4% Tags_th25 91,1% 8,9% 97,8% 2,2% 75,3% Tags_th30 87,0% 13% 94,7% 5,3% 59,2% Tags_th35 79,0% 21,0% 89,4% 10,6% 50,0% Tags_th40 75,3% 24,7% 85,1% 14,9% 39,7% Tags_th45 67,9% 32,1% 76,9% 23,1% 28% Tags_th50 63,2% 36,8% 70,2% 29,9% 19% Tags_th55 47,0% 53,0% 50,5% 45,5% 6,6% Classifiers assessing Levenstein Results
  • 29.
  • 30.
    Conclusions Decision 5th 10th 15th20th 25th 30th 35th 40th 45th 50th 55th ___ # Correctly classify clusters
  • 31.
    Conclusions Decision 5th 10th 15th20th 25th 30th 35th 40th 45th 50th 55th ___ # Correctly classify clusters 91,4 75,3
  • 32.
    Conclusions Decision Find out balance between datareduction  (clusters) and precision Final decision related to research criteria (accuracy / cost)
  • 33.
  • 34.
    Future research Processing • Remove repeated characters • Use thesaurus (e.g. GNU Aspell) •Solve the synonym problems Coding • Code other entities (e.g. authors)
  • 35.
    • José Carpio(jose.carpio@dti.uhu.es) • Juan D. Borrero (jdiego@uhu.es) • Estrella Gualda (estrella@uhu.es) University of Huelva Acknowledges Thanks a lot for your attention! Muito obrigado pela sua atenção!