Solutions completo elementos de maquinas de shigley 8th edition
Stats
1. Question
You are required to calculate the coefficient of correlation for the above data set and
comment what conclusion Kushal should draw from the sample
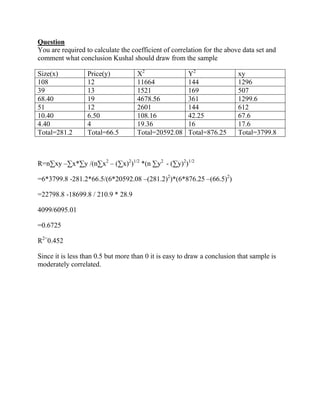
Size(x) Price(y) X2 Y2 xy
108 12 11664 144 1296
39 13 1521 169 507
68.40 19 4678.56 361 1299.6
51 12 2601 144 612
10.40 6.50 108.16 42.25 67.6
4.40 4 19.36 16 17.6
Total=281.2 Total=66.5 Total=20592.08 Total=876.25 Total=3799.8
R=n∑xy –∑x*∑y /(n∑x2 – (∑x)2)1/2 *(n ∑y2 - (∑y)2)1/2
=6*3799.8 -281.2*66.5/(6*20592.08 –(281.2)2)*(6*876.25 –(66.5)2)
=22798.8 -18699.8 / 210.9 * 28.9
4099/6095.01
=0.6725
R2=0.452
Since it is less than 0.5 but more than 0 it is easy to draw a conclusion that sample is
moderately correlated.