SlideShare a Scribd company logo
1 of 2
Construction First Glance 2008
                          Quarter 4
Pre-Release Analysis of Fourth Quarter 2008 Reis Findings for Construction Activity

                                                                       units). Over the last 12 months, completions were led by
              Victor Calanog PhD                                       Houston (14,156 units; 3.1% of inventory), Dallas (7,751 units;
              Director of Research                                     2.0% of inventory), Los Angeles (6,027 units; 0.8% of inven-
                                                                       tory), Atlanta (5,748 units; 1.7% of inventory) and Austin
              New York — January 15 2009                               (5.283 units; 3.7% of inventory).

                                                                       Office Sector
Construction Activity Overview                                         Fourth quarter completions of 15.010 million square feet rep-
                                                                       resent an decrease relative to fourth quarter completions of
In stark contrast to the steep decline in occupied space               22.427 million square feet in 2007. We are skeptical about
across the office, retail and apartment sectors throughout             the sector’s ability to deliver the 49.18 million square feet of
2008, completions were delivered in a relatively uniform               total space projected to
fashion each quarter. The Commerce Department reports†
                                                                                                         12 Month Change in Office Inventory
                                                                       come online by the end of 1.0%
that seasonally-adjusted private residential construction              2009. Developers will be
spending fell by 23.4% between November 2007 and Novem-                hesitant to commit to add- 0.8%
ber 2008. However, private nonresidential construction                 ing new space in an eco-
spending (excluding office buildings) grew by 9.1%. Over               nomic environment char-
40% of projects scheduled to come online in the fourth quar-           acterized by surging levels 0.6%
ter have either been delayed to 2009 or cancelled. Reis ex-            of sublease space.
pects more delays and cancellations in 2009 unless eco-                                                  0.4%
nomic conditions (particularly credit availability for develop- Leading markets for
ers) improve dramatically.                                                 fourth quarter comple-
                                                                           tions include the Houston 0.2%
                                                                           (1.11 million SF), Austin
                  Fourth Quarter 2008 Completions                          (1.02 million SF), Dallas 0.0%
                                                                           (0.99 million SF), San
         Apartment (units) Office (square feet)       Retail (square feet) Francisco (0.99 million SF)
                                                                           and Palm Beach (0.78 mil- -0.2% 1Q06 3Q06 1Q07 3Q07 1Q08 3Q08
Q4 2008        24,226              15,010,000             5,867,000
                                                                           lion SF). Over the last 12
Q3 2008        22,643             14,283,000              4,838,000
                                                                           months, completions were led by the Suburban Virginia (5.59
Q2 2008        28,178              14,212,000             6,408,000        million SF; 4.2% of inventory), Houston (4.33 million SF;
                                                                           2.8% of inventory), Chicago (4.24 million SF; 1.8% of inven-
Q1 2008        21,749              14,573,000             3,983,000
                                                                           tory), Dallas (3.93 million SF; 2.6% of inventory) and Seattle
Apartment and office figures are based on 79 metros; retail, on 76 metros
                                                                           (2.84 million SF; 3.9% of inventory).

Apartment Sector                                                       Given that the US is in the middle of what may well be the
                                                                       longest recession since the Second World War, Reis projects
Multifamily completions for the fourth quarter of 2008 to-             a rise in vacancy and negative net absorption through 2011.
taled 24,226 units, slightly lower than the figure of 30,706           The sharp decline in asking and effective rent growth in the
units that came online in the fourth quarter of 2007. Ap-              fourth quarter marks the beginning of what Reis foresees to
proximately 93,000 units are scheduled for completion in               be at least two years of negative rent growth.
2009, a figure that is representative of the latest information
from developers. Delays or cancellations are to be expected, Retail Sector
given the unprecedented decline in credit availability over
the last four months of 2008, combined with job losses and Approximately 5.9 million square feet of neighborhood and
                                                  contraction in consumer community shopping centers were completed in the fourth
                                                  spending. If this amount                                          quarter.     This quarter
        12 Month Change in Apartment Inventory
                                                  of new completions do in 2.0% 12 Month Change in Retail Inventory marks the fourth point in
   1.5%

                                                  fact materialize in 2009                                          Reis’s quarterly history
                                                  these buildings will face 1.8%                                    that the retail sector has
                                                  tough market conditions 1.6%                                      ever registered negative
   1.0%


                                                  and will serve as a supply                                        absorption. The 50 basis
                                                  glut that may depress re- 1.4%                                    point jump in vacancy from
                                                  covery once the economy 1.2%                                      8.4 to 8.9% is also the
  0.5%


                                                  rebounds.                                                         largest single-quarter in-
                                                                                                                    crease in vacancy since
                                                                               1.0%


                                                  Leading markets for com- 0.8%                                     Reis began reporting quar-
  0.0%


                                                  pletions in the fourth                                            terly performance figures
                                                  quarter include Houston 0.6%                                      in 1999.
                                                  (3,715 units), Phoenix 0.4%
 -0.5%


                                                  (1,393 units), Fort Worth                                         Leading markets for com-
                                                  (1,251 units), Austin (1,183 0.2%                                 pletion include Houston
                                                  units) and Orlando (1,115 0.0%                                    (0.54 million SF), Phoenix
  -1.0%
         1Q06  3Q06    1Q07   3Q07    1Q08   3Q08
                                                                            1Q06   3Q06   1Q07   3Q07   1Q08   3Q08
(0.45 million SF), Orlando (0.45 million SF), Tampa (0.43 mil-                       cember 2007.
lion SF) and Suburban Virginia (0.33 million SF). Over the
last four quarters, completions were led by Houston (2.21       According to December’s preliminary employment estimate,
million SF: 2.7% of inventory), Phoenix (2.17 million SF; 3.3%  construction payrolls fell by 265,000 jobs between Septem-
of inventory), Chicago (1.67 million SF; 1.7% of inventory),    ber and December. Construction payrolls fell by 632,000
Dallas (1.62 million SF; 3.1 % of inventory) and Las Vegas      jobs between December 2007 to December 2008, with
(1.54 million SF; 5.6% of inventory).                           120,400 jobs lost in residential construction. Non-residential
                                                                job losses in the last year total 53,400 jobs. Construction
Reis is currently tracking retail projects scheduled for com- earnings grew only by 1.3% from September to December
pletion in 2009 that will result in inventory additions of 19.6 but climbed 5.0% over the past year despite the job losses.
million square feet, about 5 million square feet less than what
                                                                                    Changes in Employment
was projected last quarter. Like the apartment and office
sectors, we expect delays and cancellations to occur.                                                       Quarter   12 Month
                                                                                     Construction Employment                                    -3.7%       -8.5%
                                                                                     Nonresidential Construction Employment                     -2.8%       -6.7%
                                                Construction Costs
       12 Month Change in Consumer and
                                                                                     Construction Wages                                         1.3%        5.0%
       Construction Prices
 14%
                                                                                     Source: Bureau of Labor Statistics (As of December 2008)
                                                                 The relatively modest
                                                                 level of completions
 12%


                                                                 (compared to previous
                                                                                            Note: History and 2008 inventory addition calculations are for 79 markets
10%
                                                                 boom periods) may end for apartment and office; 76 markets for retail. † Census Bureau,
                                                                 up serving as a boon to November 2008; ‡ Bureau of Labor Statistics, December 2008
 8%


                                                                 commercial real estate
 6%
                                                                 in the face of the current Copyright © 2009 Reis Inc.
                                                                 recession: there will be
 4%

                                                                 less of a glut that may
 2%
                                                                 delay recovery once the
                                                                 economy rebounds. This
 0%

                                                                 restrained pace of con-
   2003       2004        2005        2006     2007 2008


                                                                 struction was driven by
        Consumer Price Index for Urban Consumers
                                                     Source: BLS
        Inputs to Construction Industries
                                                                 the high relative price
                                                                 level of construction
materials set by the growth spike from 2004 to 2006. The
exception will be metropolitan areas relatively more depend-
ent on financial services
firms for employment.                                    12 Month Change in PPI
Markets like New York 12%
City are currently being
flooded with sublease 10%
space that will act as a
virtual supply glut, con- 8%
straining rent growth
even after job growth 6%
resumes.
                                     4%


Construction and labor
                           2%
costs declined from Sep-
tember to December
                           0%
2008.      The Producer
Price Index (PPI)     for -2%
                   ‡

construction materials       1998    2000        2002        2004        2006 2008

and their components fell         Materials & Components for Construction

by 3.0% between the
third quarter of 2008 and fourth quarter of 2008, yielding a
year over year change of 7.3% from December 2007 to De-
cember 2008. By way of comparison, the index increased
year over year by 4.4% in December 2006 and 2.0% in De-

                    Changes in Producer Price Index
                                                          Quarter      12 Month
Materials & Components for Construction                    -3.0%         7.3%
Commercial Electric Power                                  3.8%          8.5%
Industrial Electric Power                                  4.0%          5.9%
Cement                                                     2.0%          -0.6%
Concrete                                                    1.1%         4.3%
Source: Bureau of Labor Statistics (As of December 2008)

More Related Content

Viewers also liked

Viewers also liked (19)

snowmen
snowmensnowmen
snowmen
 
Webcast 4 T08 Eng
Webcast 4 T08 EngWebcast 4 T08 Eng
Webcast 4 T08 Eng
 
Alexaaaa .
Alexaaaa .Alexaaaa .
Alexaaaa .
 
E Learning Principle Survey
E Learning Principle SurveyE Learning Principle Survey
E Learning Principle Survey
 
Los Animales
Los AnimalesLos Animales
Los Animales
 
Fotosasombrosas
FotosasombrosasFotosasombrosas
Fotosasombrosas
 
IVY workbench evaluation
IVY workbench evaluationIVY workbench evaluation
IVY workbench evaluation
 
No Te Conozco
No Te ConozcoNo Te Conozco
No Te Conozco
 
Bonjour Viet Nam
Bonjour Viet NamBonjour Viet Nam
Bonjour Viet Nam
 
Fotostf
FotostfFotostf
Fotostf
 
Kaizo Advocacy Index Winter 2009
Kaizo Advocacy Index Winter 2009Kaizo Advocacy Index Winter 2009
Kaizo Advocacy Index Winter 2009
 
jardim
jardimjardim
jardim
 
K Animals I Like
K Animals I LikeK Animals I Like
K Animals I Like
 
El Traje Del Emperador
El Traje Del EmperadorEl Traje Del Emperador
El Traje Del Emperador
 
Animais De EstimaçãO
Animais De EstimaçãOAnimais De EstimaçãO
Animais De EstimaçãO
 
Vh Carta Y Plan
Vh   Carta Y PlanVh   Carta Y Plan
Vh Carta Y Plan
 
NCT Meeting - Media
NCT Meeting - MediaNCT Meeting - Media
NCT Meeting - Media
 
Primer Treabajo
Primer TreabajoPrimer Treabajo
Primer Treabajo
 
Ciclo De ConferêNcias Ponte da Barca
Ciclo De ConferêNcias Ponte da BarcaCiclo De ConferêNcias Ponte da Barca
Ciclo De ConferêNcias Ponte da Barca
 

Similar to Reis Construction First Glance Q4.08

North American Industrial Highlights 4Q 2010
North American Industrial Highlights 4Q 2010North American Industrial Highlights 4Q 2010
North American Industrial Highlights 4Q 2010Coy Davidson
 
Q2 2012 Houston Industrial Market Report
Q2 2012 Houston Industrial Market ReportQ2 2012 Houston Industrial Market Report
Q2 2012 Houston Industrial Market ReportCoy Davidson
 
National Market Report
National Market ReportNational Market Report
National Market Reportjonathanrutman
 
C&W - MONTREAL OFFICE MARKETBEAT - Q4 2012
C&W - MONTREAL  OFFICE MARKETBEAT - Q4 2012 C&W - MONTREAL  OFFICE MARKETBEAT - Q4 2012
C&W - MONTREAL OFFICE MARKETBEAT - Q4 2012 Guy Masse
 
Colliers International: Retail Highlights Fall 2010
Colliers International: Retail Highlights Fall 2010Colliers International: Retail Highlights Fall 2010
Colliers International: Retail Highlights Fall 2010Coy Davidson
 
Retail US Highlights Spring 2011
Retail US Highlights Spring 2011Retail US Highlights Spring 2011
Retail US Highlights Spring 2011Coy Davidson
 
US Apartment Market Trends - July 2009
US Apartment Market Trends - July 2009US Apartment Market Trends - July 2009
US Apartment Market Trends - July 2009mpfresearch
 
Q2 2011 Houston Industrial Market Report
Q2 2011 Houston Industrial Market ReportQ2 2011 Houston Industrial Market Report
Q2 2011 Houston Industrial Market ReportCoy Davidson
 
Office fall2010 final
Office fall2010 finalOffice fall2010 final
Office fall2010 finalChris Fyvie
 
Green Building Index Profile Report: Midtown NY
Green Building Index Profile Report: Midtown NYGreen Building Index Profile Report: Midtown NY
Green Building Index Profile Report: Midtown NYscottbrooker
 
Houston Office Market Report 1Q-2011
Houston Office Market Report 1Q-2011Houston Office Market Report 1Q-2011
Houston Office Market Report 1Q-2011Coy Davidson
 
Q4 2012 houston_industrial_market_report
Q4 2012 houston_industrial_market_reportQ4 2012 houston_industrial_market_report
Q4 2012 houston_industrial_market_reportLisa Bridges
 
Q2 2011 Houston Office Market Report
Q2 2011 Houston Office Market ReportQ2 2011 Houston Office Market Report
Q2 2011 Houston Office Market ReportCoy Davidson
 
Houston Office Market Report Q2 2012
Houston Office Market Report Q2 2012Houston Office Market Report Q2 2012
Houston Office Market Report Q2 2012Coy Davidson
 
Get Research Resource5
Get Research Resource5Get Research Resource5
Get Research Resource5Igor Bevzenko
 
Puget sound office market Q3 2012
Puget sound office market Q3 2012Puget sound office market Q3 2012
Puget sound office market Q3 2012GilWhiteCRE
 
Preliminary Trends
Preliminary TrendsPreliminary Trends
Preliminary Trendsekoransky
 
North American Office Highlights 1Q 2011
North American Office Highlights 1Q  2011North American Office Highlights 1Q  2011
North American Office Highlights 1Q 2011Coy Davidson
 
2Q08 Results Presentation
2Q08 Results Presentation2Q08 Results Presentation
2Q08 Results PresentationProvidência
 

Similar to Reis Construction First Glance Q4.08 (20)

North American Industrial Highlights 4Q 2010
North American Industrial Highlights 4Q 2010North American Industrial Highlights 4Q 2010
North American Industrial Highlights 4Q 2010
 
Q2 2012 Houston Industrial Market Report
Q2 2012 Houston Industrial Market ReportQ2 2012 Houston Industrial Market Report
Q2 2012 Houston Industrial Market Report
 
National Market Report
National Market ReportNational Market Report
National Market Report
 
C&W - MONTREAL OFFICE MARKETBEAT - Q4 2012
C&W - MONTREAL  OFFICE MARKETBEAT - Q4 2012 C&W - MONTREAL  OFFICE MARKETBEAT - Q4 2012
C&W - MONTREAL OFFICE MARKETBEAT - Q4 2012
 
Colliers International: Retail Highlights Fall 2010
Colliers International: Retail Highlights Fall 2010Colliers International: Retail Highlights Fall 2010
Colliers International: Retail Highlights Fall 2010
 
Retail US Highlights Spring 2011
Retail US Highlights Spring 2011Retail US Highlights Spring 2011
Retail US Highlights Spring 2011
 
US Apartment Market Trends - July 2009
US Apartment Market Trends - July 2009US Apartment Market Trends - July 2009
US Apartment Market Trends - July 2009
 
Office q4 2011
Office q4 2011Office q4 2011
Office q4 2011
 
Q2 2011 Houston Industrial Market Report
Q2 2011 Houston Industrial Market ReportQ2 2011 Houston Industrial Market Report
Q2 2011 Houston Industrial Market Report
 
Office fall2010 final
Office fall2010 finalOffice fall2010 final
Office fall2010 final
 
Green Building Index Profile Report: Midtown NY
Green Building Index Profile Report: Midtown NYGreen Building Index Profile Report: Midtown NY
Green Building Index Profile Report: Midtown NY
 
Houston Office Market Report 1Q-2011
Houston Office Market Report 1Q-2011Houston Office Market Report 1Q-2011
Houston Office Market Report 1Q-2011
 
Q4 2012 houston_industrial_market_report
Q4 2012 houston_industrial_market_reportQ4 2012 houston_industrial_market_report
Q4 2012 houston_industrial_market_report
 
Q2 2011 Houston Office Market Report
Q2 2011 Houston Office Market ReportQ2 2011 Houston Office Market Report
Q2 2011 Houston Office Market Report
 
Houston Office Market Report Q2 2012
Houston Office Market Report Q2 2012Houston Office Market Report Q2 2012
Houston Office Market Report Q2 2012
 
Get Research Resource5
Get Research Resource5Get Research Resource5
Get Research Resource5
 
Puget sound office market Q3 2012
Puget sound office market Q3 2012Puget sound office market Q3 2012
Puget sound office market Q3 2012
 
Preliminary Trends
Preliminary TrendsPreliminary Trends
Preliminary Trends
 
North American Office Highlights 1Q 2011
North American Office Highlights 1Q  2011North American Office Highlights 1Q  2011
North American Office Highlights 1Q 2011
 
2Q08 Results Presentation
2Q08 Results Presentation2Q08 Results Presentation
2Q08 Results Presentation
 

Recently uploaded

Advanced Test Driven-Development @ php[tek] 2024
Advanced Test Driven-Development @ php[tek] 2024Advanced Test Driven-Development @ php[tek] 2024
Advanced Test Driven-Development @ php[tek] 2024Scott Keck-Warren
 
#StandardsGoals for 2024: What’s new for BISAC - Tech Forum 2024
#StandardsGoals for 2024: What’s new for BISAC - Tech Forum 2024#StandardsGoals for 2024: What’s new for BISAC - Tech Forum 2024
#StandardsGoals for 2024: What’s new for BISAC - Tech Forum 2024BookNet Canada
 
Bun (KitWorks Team Study 노별마루 발표 2024.4.22)
Bun (KitWorks Team Study 노별마루 발표 2024.4.22)Bun (KitWorks Team Study 노별마루 발표 2024.4.22)
Bun (KitWorks Team Study 노별마루 발표 2024.4.22)Wonjun Hwang
 
Bluetooth Controlled Car with Arduino.pdf
Bluetooth Controlled Car with Arduino.pdfBluetooth Controlled Car with Arduino.pdf
Bluetooth Controlled Car with Arduino.pdfngoud9212
 
AI as an Interface for Commercial Buildings
AI as an Interface for Commercial BuildingsAI as an Interface for Commercial Buildings
AI as an Interface for Commercial BuildingsMemoori
 
Integration and Automation in Practice: CI/CD in Mule Integration and Automat...
Integration and Automation in Practice: CI/CD in Mule Integration and Automat...Integration and Automation in Practice: CI/CD in Mule Integration and Automat...
Integration and Automation in Practice: CI/CD in Mule Integration and Automat...Patryk Bandurski
 
Science&tech:THE INFORMATION AGE STS.pdf
Science&tech:THE INFORMATION AGE STS.pdfScience&tech:THE INFORMATION AGE STS.pdf
Science&tech:THE INFORMATION AGE STS.pdfjimielynbastida
 
Artificial intelligence in the post-deep learning era
Artificial intelligence in the post-deep learning eraArtificial intelligence in the post-deep learning era
Artificial intelligence in the post-deep learning eraDeakin University
 
"Federated learning: out of reach no matter how close",Oleksandr Lapshyn
"Federated learning: out of reach no matter how close",Oleksandr Lapshyn"Federated learning: out of reach no matter how close",Oleksandr Lapshyn
"Federated learning: out of reach no matter how close",Oleksandr LapshynFwdays
 
Unleash Your Potential - Namagunga Girls Coding Club
Unleash Your Potential - Namagunga Girls Coding ClubUnleash Your Potential - Namagunga Girls Coding Club
Unleash Your Potential - Namagunga Girls Coding ClubKalema Edgar
 
Build your next Gen AI Breakthrough - April 2024
Build your next Gen AI Breakthrough - April 2024Build your next Gen AI Breakthrough - April 2024
Build your next Gen AI Breakthrough - April 2024Neo4j
 
Transcript: New from BookNet Canada for 2024: BNC BiblioShare - Tech Forum 2024
Transcript: New from BookNet Canada for 2024: BNC BiblioShare - Tech Forum 2024Transcript: New from BookNet Canada for 2024: BNC BiblioShare - Tech Forum 2024
Transcript: New from BookNet Canada for 2024: BNC BiblioShare - Tech Forum 2024BookNet Canada
 
New from BookNet Canada for 2024: BNC BiblioShare - Tech Forum 2024
New from BookNet Canada for 2024: BNC BiblioShare - Tech Forum 2024New from BookNet Canada for 2024: BNC BiblioShare - Tech Forum 2024
New from BookNet Canada for 2024: BNC BiblioShare - Tech Forum 2024BookNet Canada
 
Transcript: #StandardsGoals for 2024: What’s new for BISAC - Tech Forum 2024
Transcript: #StandardsGoals for 2024: What’s new for BISAC - Tech Forum 2024Transcript: #StandardsGoals for 2024: What’s new for BISAC - Tech Forum 2024
Transcript: #StandardsGoals for 2024: What’s new for BISAC - Tech Forum 2024BookNet Canada
 
Connect Wave/ connectwave Pitch Deck Presentation
Connect Wave/ connectwave Pitch Deck PresentationConnect Wave/ connectwave Pitch Deck Presentation
Connect Wave/ connectwave Pitch Deck PresentationSlibray Presentation
 
Snow Chain-Integrated Tire for a Safe Drive on Winter Roads
Snow Chain-Integrated Tire for a Safe Drive on Winter RoadsSnow Chain-Integrated Tire for a Safe Drive on Winter Roads
Snow Chain-Integrated Tire for a Safe Drive on Winter RoadsHyundai Motor Group
 
Key Features Of Token Development (1).pptx
Key  Features Of Token  Development (1).pptxKey  Features Of Token  Development (1).pptx
Key Features Of Token Development (1).pptxLBM Solutions
 
Pigging Solutions in Pet Food Manufacturing
Pigging Solutions in Pet Food ManufacturingPigging Solutions in Pet Food Manufacturing
Pigging Solutions in Pet Food ManufacturingPigging Solutions
 

Recently uploaded (20)

Advanced Test Driven-Development @ php[tek] 2024
Advanced Test Driven-Development @ php[tek] 2024Advanced Test Driven-Development @ php[tek] 2024
Advanced Test Driven-Development @ php[tek] 2024
 
#StandardsGoals for 2024: What’s new for BISAC - Tech Forum 2024
#StandardsGoals for 2024: What’s new for BISAC - Tech Forum 2024#StandardsGoals for 2024: What’s new for BISAC - Tech Forum 2024
#StandardsGoals for 2024: What’s new for BISAC - Tech Forum 2024
 
Bun (KitWorks Team Study 노별마루 발표 2024.4.22)
Bun (KitWorks Team Study 노별마루 발표 2024.4.22)Bun (KitWorks Team Study 노별마루 발표 2024.4.22)
Bun (KitWorks Team Study 노별마루 발표 2024.4.22)
 
Bluetooth Controlled Car with Arduino.pdf
Bluetooth Controlled Car with Arduino.pdfBluetooth Controlled Car with Arduino.pdf
Bluetooth Controlled Car with Arduino.pdf
 
AI as an Interface for Commercial Buildings
AI as an Interface for Commercial BuildingsAI as an Interface for Commercial Buildings
AI as an Interface for Commercial Buildings
 
Integration and Automation in Practice: CI/CD in Mule Integration and Automat...
Integration and Automation in Practice: CI/CD in Mule Integration and Automat...Integration and Automation in Practice: CI/CD in Mule Integration and Automat...
Integration and Automation in Practice: CI/CD in Mule Integration and Automat...
 
Science&tech:THE INFORMATION AGE STS.pdf
Science&tech:THE INFORMATION AGE STS.pdfScience&tech:THE INFORMATION AGE STS.pdf
Science&tech:THE INFORMATION AGE STS.pdf
 
Artificial intelligence in the post-deep learning era
Artificial intelligence in the post-deep learning eraArtificial intelligence in the post-deep learning era
Artificial intelligence in the post-deep learning era
 
"Federated learning: out of reach no matter how close",Oleksandr Lapshyn
"Federated learning: out of reach no matter how close",Oleksandr Lapshyn"Federated learning: out of reach no matter how close",Oleksandr Lapshyn
"Federated learning: out of reach no matter how close",Oleksandr Lapshyn
 
Unleash Your Potential - Namagunga Girls Coding Club
Unleash Your Potential - Namagunga Girls Coding ClubUnleash Your Potential - Namagunga Girls Coding Club
Unleash Your Potential - Namagunga Girls Coding Club
 
DMCC Future of Trade Web3 - Special Edition
DMCC Future of Trade Web3 - Special EditionDMCC Future of Trade Web3 - Special Edition
DMCC Future of Trade Web3 - Special Edition
 
Build your next Gen AI Breakthrough - April 2024
Build your next Gen AI Breakthrough - April 2024Build your next Gen AI Breakthrough - April 2024
Build your next Gen AI Breakthrough - April 2024
 
Transcript: New from BookNet Canada for 2024: BNC BiblioShare - Tech Forum 2024
Transcript: New from BookNet Canada for 2024: BNC BiblioShare - Tech Forum 2024Transcript: New from BookNet Canada for 2024: BNC BiblioShare - Tech Forum 2024
Transcript: New from BookNet Canada for 2024: BNC BiblioShare - Tech Forum 2024
 
New from BookNet Canada for 2024: BNC BiblioShare - Tech Forum 2024
New from BookNet Canada for 2024: BNC BiblioShare - Tech Forum 2024New from BookNet Canada for 2024: BNC BiblioShare - Tech Forum 2024
New from BookNet Canada for 2024: BNC BiblioShare - Tech Forum 2024
 
Transcript: #StandardsGoals for 2024: What’s new for BISAC - Tech Forum 2024
Transcript: #StandardsGoals for 2024: What’s new for BISAC - Tech Forum 2024Transcript: #StandardsGoals for 2024: What’s new for BISAC - Tech Forum 2024
Transcript: #StandardsGoals for 2024: What’s new for BISAC - Tech Forum 2024
 
Hot Sexy call girls in Panjabi Bagh 🔝 9953056974 🔝 Delhi escort Service
Hot Sexy call girls in Panjabi Bagh 🔝 9953056974 🔝 Delhi escort ServiceHot Sexy call girls in Panjabi Bagh 🔝 9953056974 🔝 Delhi escort Service
Hot Sexy call girls in Panjabi Bagh 🔝 9953056974 🔝 Delhi escort Service
 
Connect Wave/ connectwave Pitch Deck Presentation
Connect Wave/ connectwave Pitch Deck PresentationConnect Wave/ connectwave Pitch Deck Presentation
Connect Wave/ connectwave Pitch Deck Presentation
 
Snow Chain-Integrated Tire for a Safe Drive on Winter Roads
Snow Chain-Integrated Tire for a Safe Drive on Winter RoadsSnow Chain-Integrated Tire for a Safe Drive on Winter Roads
Snow Chain-Integrated Tire for a Safe Drive on Winter Roads
 
Key Features Of Token Development (1).pptx
Key  Features Of Token  Development (1).pptxKey  Features Of Token  Development (1).pptx
Key Features Of Token Development (1).pptx
 
Pigging Solutions in Pet Food Manufacturing
Pigging Solutions in Pet Food ManufacturingPigging Solutions in Pet Food Manufacturing
Pigging Solutions in Pet Food Manufacturing
 

Reis Construction First Glance Q4.08

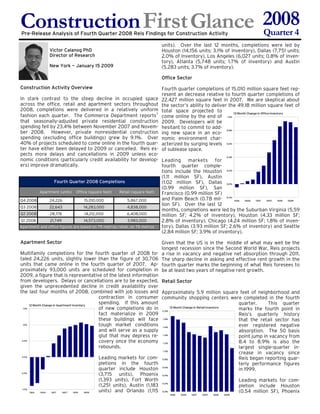
  • 1. Construction First Glance 2008 Quarter 4 Pre-Release Analysis of Fourth Quarter 2008 Reis Findings for Construction Activity units). Over the last 12 months, completions were led by Victor Calanog PhD Houston (14,156 units; 3.1% of inventory), Dallas (7,751 units; Director of Research 2.0% of inventory), Los Angeles (6,027 units; 0.8% of inven- tory), Atlanta (5,748 units; 1.7% of inventory) and Austin New York — January 15 2009 (5.283 units; 3.7% of inventory). Office Sector Construction Activity Overview Fourth quarter completions of 15.010 million square feet rep- resent an decrease relative to fourth quarter completions of In stark contrast to the steep decline in occupied space 22.427 million square feet in 2007. We are skeptical about across the office, retail and apartment sectors throughout the sector’s ability to deliver the 49.18 million square feet of 2008, completions were delivered in a relatively uniform total space projected to fashion each quarter. The Commerce Department reports† 12 Month Change in Office Inventory come online by the end of 1.0% that seasonally-adjusted private residential construction 2009. Developers will be spending fell by 23.4% between November 2007 and Novem- hesitant to commit to add- 0.8% ber 2008. However, private nonresidential construction ing new space in an eco- spending (excluding office buildings) grew by 9.1%. Over nomic environment char- 40% of projects scheduled to come online in the fourth quar- acterized by surging levels 0.6% ter have either been delayed to 2009 or cancelled. Reis ex- of sublease space. pects more delays and cancellations in 2009 unless eco- 0.4% nomic conditions (particularly credit availability for develop- Leading markets for ers) improve dramatically. fourth quarter comple- tions include the Houston 0.2% (1.11 million SF), Austin Fourth Quarter 2008 Completions (1.02 million SF), Dallas 0.0% (0.99 million SF), San Apartment (units) Office (square feet) Retail (square feet) Francisco (0.99 million SF) and Palm Beach (0.78 mil- -0.2% 1Q06 3Q06 1Q07 3Q07 1Q08 3Q08 Q4 2008 24,226 15,010,000 5,867,000 lion SF). Over the last 12 Q3 2008 22,643 14,283,000 4,838,000 months, completions were led by the Suburban Virginia (5.59 Q2 2008 28,178 14,212,000 6,408,000 million SF; 4.2% of inventory), Houston (4.33 million SF; 2.8% of inventory), Chicago (4.24 million SF; 1.8% of inven- Q1 2008 21,749 14,573,000 3,983,000 tory), Dallas (3.93 million SF; 2.6% of inventory) and Seattle Apartment and office figures are based on 79 metros; retail, on 76 metros (2.84 million SF; 3.9% of inventory). Apartment Sector Given that the US is in the middle of what may well be the longest recession since the Second World War, Reis projects Multifamily completions for the fourth quarter of 2008 to- a rise in vacancy and negative net absorption through 2011. taled 24,226 units, slightly lower than the figure of 30,706 The sharp decline in asking and effective rent growth in the units that came online in the fourth quarter of 2007. Ap- fourth quarter marks the beginning of what Reis foresees to proximately 93,000 units are scheduled for completion in be at least two years of negative rent growth. 2009, a figure that is representative of the latest information from developers. Delays or cancellations are to be expected, Retail Sector given the unprecedented decline in credit availability over the last four months of 2008, combined with job losses and Approximately 5.9 million square feet of neighborhood and contraction in consumer community shopping centers were completed in the fourth spending. If this amount quarter. This quarter 12 Month Change in Apartment Inventory of new completions do in 2.0% 12 Month Change in Retail Inventory marks the fourth point in 1.5% fact materialize in 2009 Reis’s quarterly history these buildings will face 1.8% that the retail sector has tough market conditions 1.6% ever registered negative 1.0% and will serve as a supply absorption. The 50 basis glut that may depress re- 1.4% point jump in vacancy from covery once the economy 1.2% 8.4 to 8.9% is also the 0.5% rebounds. largest single-quarter in- crease in vacancy since 1.0% Leading markets for com- 0.8% Reis began reporting quar- 0.0% pletions in the fourth terly performance figures quarter include Houston 0.6% in 1999. (3,715 units), Phoenix 0.4% -0.5% (1,393 units), Fort Worth Leading markets for com- (1,251 units), Austin (1,183 0.2% pletion include Houston units) and Orlando (1,115 0.0% (0.54 million SF), Phoenix -1.0% 1Q06 3Q06 1Q07 3Q07 1Q08 3Q08 1Q06 3Q06 1Q07 3Q07 1Q08 3Q08
  • 2. (0.45 million SF), Orlando (0.45 million SF), Tampa (0.43 mil- cember 2007. lion SF) and Suburban Virginia (0.33 million SF). Over the last four quarters, completions were led by Houston (2.21 According to December’s preliminary employment estimate, million SF: 2.7% of inventory), Phoenix (2.17 million SF; 3.3% construction payrolls fell by 265,000 jobs between Septem- of inventory), Chicago (1.67 million SF; 1.7% of inventory), ber and December. Construction payrolls fell by 632,000 Dallas (1.62 million SF; 3.1 % of inventory) and Las Vegas jobs between December 2007 to December 2008, with (1.54 million SF; 5.6% of inventory). 120,400 jobs lost in residential construction. Non-residential job losses in the last year total 53,400 jobs. Construction Reis is currently tracking retail projects scheduled for com- earnings grew only by 1.3% from September to December pletion in 2009 that will result in inventory additions of 19.6 but climbed 5.0% over the past year despite the job losses. million square feet, about 5 million square feet less than what Changes in Employment was projected last quarter. Like the apartment and office sectors, we expect delays and cancellations to occur. Quarter 12 Month Construction Employment -3.7% -8.5% Nonresidential Construction Employment -2.8% -6.7% Construction Costs 12 Month Change in Consumer and Construction Wages 1.3% 5.0% Construction Prices 14% Source: Bureau of Labor Statistics (As of December 2008) The relatively modest level of completions 12% (compared to previous Note: History and 2008 inventory addition calculations are for 79 markets 10% boom periods) may end for apartment and office; 76 markets for retail. † Census Bureau, up serving as a boon to November 2008; ‡ Bureau of Labor Statistics, December 2008 8% commercial real estate 6% in the face of the current Copyright © 2009 Reis Inc. recession: there will be 4% less of a glut that may 2% delay recovery once the economy rebounds. This 0% restrained pace of con- 2003 2004 2005 2006 2007 2008 struction was driven by Consumer Price Index for Urban Consumers Source: BLS Inputs to Construction Industries the high relative price level of construction materials set by the growth spike from 2004 to 2006. The exception will be metropolitan areas relatively more depend- ent on financial services firms for employment. 12 Month Change in PPI Markets like New York 12% City are currently being flooded with sublease 10% space that will act as a virtual supply glut, con- 8% straining rent growth even after job growth 6% resumes. 4% Construction and labor 2% costs declined from Sep- tember to December 0% 2008. The Producer Price Index (PPI) for -2% ‡ construction materials 1998 2000 2002 2004 2006 2008 and their components fell Materials & Components for Construction by 3.0% between the third quarter of 2008 and fourth quarter of 2008, yielding a year over year change of 7.3% from December 2007 to De- cember 2008. By way of comparison, the index increased year over year by 4.4% in December 2006 and 2.0% in De- Changes in Producer Price Index Quarter 12 Month Materials & Components for Construction -3.0% 7.3% Commercial Electric Power 3.8% 8.5% Industrial Electric Power 4.0% 5.9% Cement 2.0% -0.6% Concrete 1.1% 4.3% Source: Bureau of Labor Statistics (As of December 2008)