Exploring the Dark Universe

In this deck, Katrin Heitmann from Argonne National Laboratory presents: Exploring the Dark Universe. "Next-generation observatories will open new routes to understand the true nature of the 'Dark Universe'. These observations will pose tremendous challenges on many fronts -- from the sheer size of the data that will be collected (more than a hundred Petabytes) to its modeling and interpretation. The interpretation of the data requires sophisticated simulations on the world's largest supercomputers. The cost of these simulations, the uncertainties in our modeling abilities, and the fact that we have only one Universe that we can observe opposed to carrying out controlled experiments, all come together to create a major test for computational, statistical, and data analysis methods." Watch the video: https://wp.me/p3RLHQ-lwc Learn more: https://ciera.northwestern.edu/2019/01/15/katrin-heitmann-explores-the-dark-universe-at-ciera-interdisciplinary-colloquium/ and https://extremecomputingtraining.anl.gov/archive/atpesc-2019/agenda-2019/ Sign up for our insideHPC Newsletter: http://insidehpc.com/newsletter

Recommended
Recommended
More Related Content
More from inside-BigData.com
More from inside-BigData.com (20)
Recently uploaded
Recently uploaded (20)
Exploring the Dark Universe
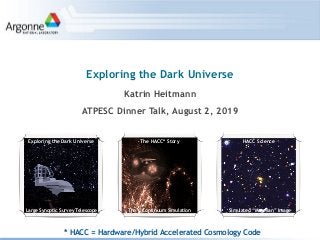
- 1. Katrin Heitmann ATPESC Dinner Talk, August 2, 2019 Exploring the Dark Universe Exploring the Dark Universe HACC Science The Q Continuum Simulation Simulated “Magellan” Image The HACC* Story * HACC = Hardware/Hybrid Accelerated Cosmology Code Large Synoptic Survey Telescope
- 2. Thanks to many collaborators! Physics/Astrophysics (Cosmology, Field Theory, Lattice QCD) StatisticsComputer Science
- 3. • Modern cosmology is the story of mapping the sky in multiple wavebands • Maps cover measurements of objects (stars, galaxies) and fields (temperature) • Maps can be large (Sloan Digital Sky Survey recorded >500 million photometric objects, many billions for planned surveys) • Statistical analysis of sky maps • All precision cosmological analyses constitute a statistical inverse problem: from sky maps to scientific inference • Therefore: No cosmology without (large-scale) computing Modern Cosmology and Sky Maps ROSAT (X-ray) WMAP (microwave) Fermi (gamma ray) SDSS (optical)
- 4. Observations from the SDSS: positions of 1,000,000 galaxies with redshifts (and therefore distance) leading to a 3-D map
- 5. Observations from the SDSS: positions of 1,000,000 galaxies with redshifts (and therefore distance) leading to a 3-D map
- 6. Observations from the SDSS: positions of 1,000,000 galaxies with redshifts (and therefore distance) leading to a 3-D map
- 7. Observations from the SDSS: positions of 1,000,000 galaxies with redshifts (and therefore distance) leading to a 3-D map
- 8. Observations from the SDSS: positions of 1,000,000 galaxies with redshifts (and therefore distance) leading to a 3-D map
- 9. Observations from the SDSS: positions of 1,000,000 galaxies with redshifts (and therefore distance) leading to a 3-D map
- 10. Observations from the SDSS: positions of 1,000,000 galaxies with redshifts (and therefore distance) leading to a 3-D map
- 11. Observations from the SDSS: positions of 1,000,000 galaxies with redshifts (and therefore distance) leading to a 3-D map
- 12. Observations from the SDSS: positions of 1,000,000 galaxies with redshifts (and therefore distance) leading to a 3-D map
- 13. Observations from the SDSS: positions of 1,000,000 galaxies with redshifts (and therefore distance) leading to a 3-D map
- 14. Observations from the SDSS: positions of 1,000,000 galaxies with redshifts (and therefore distance) leading to a 3-D map
- 15. Observations from the SDSS: positions of 1,000,000 galaxies with redshifts (and therefore distance) leading to a 3-D map
- 16. Observations from the SDSS: positions of 1,000,000 galaxies with redshifts (and therefore distance) leading to a 3-D map Credit: David Hogg, NYU
- 17. • Survey volume ‣ Surveys cover enormous observational volumes, ~(4 Gpc)3, of order 12 billion light- years in linear scale • Number of Galaxies ‣ Number of galaxies in surveys can be in the tens of billions, typical intergalactic separation is ~1 Mpc • Typical galaxy mass ‣ The mass associated with a typical bright galaxy in surveys ranges from 1011-1013 M☀ • Typical galaxy size ‣ The length scale of the mass distribution is approximately 100 kpc Relevant Numbers for Optical SurveysSimulation volume 3 Mpc Cluster of galaxies Distance between galaxies 1 Mpc 500 - 4000 Mpc *1 parsec = 3.26 light-years = 31 trillion kilometers
- 18. • Survey volume ‣ Surveys cover enormous observational volumes, ~(4 Gpc)3, of order 12 billion light- years in linear scale • Number of Galaxies ‣ Number of galaxies in surveys can be in the tens of billions, typical intergalactic separation is ~1 Mpc • Typical galaxy mass ‣ The mass associated with a typical bright galaxy in surveys ranges from 1011-1013 M☀ • Typical galaxy size ‣ The length scale of the mass distribution is approximately 100 kpc Relevant Numbers for Optical SurveysSimulation volume 3 Mpc Cluster of galaxies Distance between galaxies 1 Mpc 500 - 4000 Mpc *1 parsec = 3.26 light-years = 31 trillion kilometers ~1 Mpc ~(4 Gpc)3 100 kpc
- 19. Katrin Heitmann, Los Alamos National Laboratory Benasque Cosmology Workshop, August 2010 The Content of the Universe: It’s dark! 5% visible matter, 0.5% in stars 95% dark matter and dark energy • Dark Energy: Multiple observations show that the expansion of the Universe is accelerating (first measured in 1998, Nobel prize 2011) • Imagine you throw a ball in the air and instead of coming down it flies upwards faster and faster! • Questions: What is it? Why is it important now? Being totally ignorant, currently our main task is to characterize it better and exclude some of the possible explanations • Dark Matter: Observations show that ~27% of the matter in the Universe is “dark”, i.e. does not emit or absorb light • So far: indirect detection, aims: characterize nature of dark matter and detect the actual dark matter particle ~95% of the Universe is “dark” -- we do not understand the nature and origin of dark energy and dark matter. Observer’sTheorist’sUniverse
- 20. Katrin Heitmann, Los Alamos National Laboratory Benasque Cosmology Workshop, August 2010 The Evolution of the Universe: Structure Formation ‘Linear’‘Nonlinear’ SIMULATIONS • Solid understanding of structure formation; success underpins most cosmic discovery ‣ Initial conditions determined by primordial fluctuations, measured from the cosmic microwave background ‣ Initial perturbations amplified by gravitational instability in a dark matter-dominated Universe ‣ Relevant theory is gravity, field theory, and atomic physics (‘first principles’) • Early Universe: Linear perturbation theory very successful • Latter half of the history of the Universe: Nonlinear domain of structure formation, impossible to treat without large-scale computing Simulation start50 million
- 21. Katrin Heitmann, Los Alamos National Laboratory Benasque Cosmology Workshop, August 2010 • Gravity dominates on large scales, use Monte Carlo sampling of density with tracer particles • Particles are tracers of the dark matter in the Universe, mass typically at least ~10⁹ M☀ • Simulate galaxy size objects ( ), Newtonian description accurate • At smaller scales, add gas physics, feedback etc., sub- grid modeling inevitable Computing the Universe Time Today at 0.05 Gyr “The Universe is far too complicated a structure to be studied deductively, starting from initial conditions and solving the equations of motion.” Robert Dicke (Jayne Lectures, 1969) mp ⇠ V/np CDM + baryons + DE ¨x + 2 ˙a a ˙x = r a2 r2 (x) = 4⇡Ga2 [⇢(x, t) ⇢b(t)] ˙a a = H = H0 a3/2 p ⌦tot + a3⌦⇤ Poisson equation Equation of motion for tracer particles in expanding Universe v2 /c2 << 1
- 22. The Ingredients to Create your Own Universe LSST • Constituents • Initial conditions • Dynamical rules • Computer (big!)
- 23. (500 Mpc/h)3 box, 30723 particles, saved 750 snapshots, ~800TB of data, Movie from one rank (out of 1152 ranks), ~(41Mpc/h x 41Mpc/h x 62.5Mpc/h) Structure Formation in the Universe: The Delta Quadrant Simulation
- 24. (500 Mpc/h)3 box, 30723 particles, saved 750 snapshots, ~800TB of data, Movie from one rank (out of 1152 ranks), ~(41Mpc/h x 41Mpc/h x 62.5Mpc/h) Structure Formation in the Universe: The Delta Quadrant Simulation
- 25. Changing the Constituents Cosmic Emulators • Exploration of different dark energy models: How would a dark energy model beyond Einstein’s cosmological constant alter the distribution of matter (and galaxies) in the Universe? • Exploration of dark matter and neutrinos in the Universe: What can cosmology tell us about different matter components in the Universe?
- 26. Katrin Heitmann, Los Alamos National Laboratory Benasque Cosmology Workshop, August 2010 • Simulate the formation of the large scale structure of the Universe via dark matter tracer particles, taking dark energy into account in expansion history • Measure the high-density peaks (dark matter halos) in the mass distribution • “Light traces mass” to first approximation, so populate the halos with galaxies, number of galaxies depends on mass of halo (constraints from observations) • Galaxy population prescription (hopefully) independent of cosmological model • Future challenges: Error bars on measurements are shrinking, surveys cover more volume and resolve fainter and fainter galaxies Supercomputer Sloan Digital Sky SurveyDark matter Galaxies SDSS galaxies SDSS Galaxies Density Correlation function Salman (theorist) at the observatory Connecting Theory and Observations from M. White
- 27. Katrin Heitmann, Los Alamos National Laboratory Benasque Cosmology Workshop, August 2010 • Simulate the formation of the large scale structure of the Universe via dark matter tracer particles, taking dark energy into account in expansion history • Measure the high-density peaks (dark matter halos) in the mass distribution • “Light traces mass” to first approximation, so populate the halos with galaxies, number of galaxies depends on mass of halo (constraints from observations) • Galaxy population prescription (hopefully) independent of cosmological model • Future challenges: Error bars on measurements are shrinking, surveys cover more volume and resolve fainter and fainter galaxies Supercomputer Sloan Digital Sky SurveyDark matter Galaxies SDSS galaxies SDSS Galaxies Density Correlation function Salman (theorist) at the observatory Connecting Theory and Observations from M. White
- 28. Katrin Heitmann, Los Alamos National Laboratory Benasque Cosmology Workshop, August 2010 • Simulate the formation of the large scale structure of the Universe via dark matter tracer particles, taking dark energy into account in expansion history • Measure the high-density peaks (dark matter halos) in the mass distribution • “Light traces mass” to first approximation, so populate the halos with galaxies, number of galaxies depends on mass of halo (constraints from observations) • Galaxy population prescription (hopefully) independent of cosmological model • Future challenges: Error bars on measurements are shrinking, surveys cover more volume and resolve fainter and fainter galaxies Supercomputer Sloan Digital Sky SurveyDark matter Galaxies SDSS galaxies SDSS Galaxies Density Correlation function Salman (theorist) at the observatory Connecting Theory and Observations from M. White
- 29. Katrin Heitmann, Los Alamos National Laboratory Benasque Cosmology Workshop, August 2010 • Simulate the formation of the large scale structure of the Universe via dark matter tracer particles, taking dark energy into account in expansion history • Measure the high-density peaks (dark matter halos) in the mass distribution • “Light traces mass” to first approximation, so populate the halos with galaxies, number of galaxies depends on mass of halo (constraints from observations) • Galaxy population prescription (hopefully) independent of cosmological model • Future challenges: Error bars on measurements are shrinking, surveys cover more volume and resolve fainter and fainter galaxies Supercomputer Sloan Digital Sky SurveyDark matter Galaxies SDSS galaxies SDSS Galaxies Density Correlation function Salman (theorist) at the observatory Connecting Theory and Observations from M. White SDSS galaxies LSST galaxies
- 30. Katrin Heitmann, Los Alamos National Laboratory Benasque Cosmology Workshop, August 2010 • Simulate the formation of the large scale structure of the Universe via dark matter tracer particles, taking dark energy into account in expansion history • Measure the high-density peaks (dark matter halos) in the mass distribution • “Light traces mass” to first approximation, so populate the halos with galaxies, number of galaxies depends on mass of halo (constraints from observations) • Galaxy population prescription (hopefully) independent of cosmological model • Future challenges: Error bars on measurements are shrinking, surveys cover more volume and resolve fainter and fainter galaxies Supercomputer Sloan Digital Sky SurveyDark matter Galaxies SDSS galaxies SDSS Galaxies Density Correlation function Salman (theorist) at the observatory Connecting Theory and Observations from M. White
- 31. The HACC Story
- 32. The HACC Story Chapter 1 — The Southwest
- 33. The HACC Story Chapter 1 — The Southwest
- 34. The HACC Story Chapter 1 — The Southwest
- 35. The Story Begins ... • ... with an email: Los Alamos National Lab offers the opportunity to run open science projects on the fastest supercomputer in the world for the first six months of the machine’s existence: Roadrunner • Roadrunner: First machine to achieve Petaflop performance via Cell- acceleration, CPU/Cell hybrid architecture (more details later) (equivalent to ~200,000 laptops) • The Challenges: • The machine has a “crazy” architecture, requiring major code re- designs and rewrites (we ended up writing a brand new code) • Roadrunner probably one of a kind, code-design needs to be flexible and portable to other future architectures • Cosmologists are poor -- so we took on the challenge! • Outcome: MC3 (Mesh-based Cosmology Code on the Cell, based on MC2, a PM code written in High-Performance Fortran) which later morphed into HACC, N-body code to simulate large-scale structure formation in the Universe
- 36. The Story Begins ... • ... with an email: Los Alamos National Lab offers the opportunity to run open science projects on the fastest supercomputer in the world for the first six months of the machine’s existence: Roadrunner • Roadrunner: First machine to achieve Petaflop performance via Cell- acceleration, CPU/Cell hybrid architecture (more details later) (equivalent to ~200,000 laptops) • The Challenges: • The machine has a “crazy” architecture, requiring major code re- designs and rewrites (we ended up writing a brand new code) • Roadrunner probably one of a kind, code-design needs to be flexible and portable to other future architectures • Cosmologists are poor -- so we took on the challenge! • Outcome: MC3 (Mesh-based Cosmology Code on the Cell, based on MC2, a PM code written in High-Performance Fortran) which later morphed into HACC, N-body code to simulate large-scale structure formation in the Universe Andy White: “forward-looking”
- 37. The Story Continues ... and makes it into “Die Süddeutsche” Newspaper I read every morning “He is the fastest calculator in the world:” “leads by example” “technology of the future”
- 38. So we started thinking -- (from S. Furlanetto) The future -- exascale -- hybrid machines -- MIC, GPU, Cell, multicore... Crazy architectures.... how can we use them? Computational scientist Computer scientist
- 39. So we started thinking -- (from S. Furlanetto) The future -- exascale -- hybrid machines -- MIC, GPU, Cell, multicore... Crazy architectures.... how can we use them? Computational scientist Computer scientist
- 40. The Roadrunner Architecture • Opterons have little compute (5% of total compute) but half the memory and balanced communication, for N-body codes, memory is limiting factor, so want to make best use of CPU layer • Cells dominate the compute but communication is poor, 50-100 times out of balance (also true for CPU/GPU hybrid systems) • Multi-layer programming model: C/C++/MPI (Message Passing Interface) for Opterons, C/Cell-intrinsics for Cells (OpenCL or Cuda for GPUs)
- 41. Design Challenges and Solutions for MC³ • Challenges (summarized from last slide): • Opterons have half of the machine’s memory, balanced communication, but not much compute, standard programming paradigm, C/C++/MPI • Cells have other half of machine’s memory, slow communication, lots of compute (95% of machine’s compute power), new language required • Design desiderata: • Distribute memory requirements on both parts of the machine (different on GPUs!) • Give the Cell lots of (communication limited) work to do, make sure that Cell part is easy to code and later on easy to replace by different programming paradigm
- 42. ~50 Mpc ~1 Mpc Active particles Passive Passive Passive Passive Overload boundaries Rank RCB* tree levels * recursive- coordinate- bisection HACC in a Nutshell • Long-range/short range force splitting: ‣ Long-range: Particle-Mesh solver, C/C++/MPI, unchanged for different architectures, FFT performance dictates scaling (custom pencil decomposed FFT) ‣ Short-range: Depending on node architecture switch between tree and particle-particle algorithm; tree needs “thinking” (building, walking) but computationally less demanding (BG/Q, X86), PP easier but computationally more expensive (GPU) • Overload concept to allow for easy swap of short-range solver and minimization of communication (reassignment of passive/active in regular intervals) • Adaptive time stepping, analysis on the fly, mixed precision, custom I/O, ... 3-d domain decomposition, spectral PM solver HACC Top Layer HACC ‘Nodal’ Layer * * Mpc~3M light years, distance between 2 galaxies S. Habib et al. 2016, New Astronomy
- 43. HACC (MC³) Performance on Roadrunner Perfect weak-scaling of P³M code Perfect weak-scaling of long range solver on full Roadrunner Cell computation gives an improvement of two orders of magnitude over the Opterons for the short-range force
- 44. MC³ Gadget-2 Snapshot from Code Comparison simulation, ~25 Mpc region; halos with > 200 particles, b=0.15 Differences in runs: P³M vs. TPM, force kernels, time stepper: MC³: a; Gadget-2: log(a) Power spectra agree at sub-percent level 0.5%! Ratio for P(k) HACC/Gadget-2
- 45. The HACC Story Chapter 2 — The Midwest
- 46. The HACC Story Chapter 2 — The Midwest
- 47. The HACC Story Chapter 2 — The Midwest
- 48. The HACC Story Chapter 2 — The Midwest
- 49. The HACC Story Chapter 2 — The Midwest
- 50. • Proof of concept for “easy” portability: IBM Blue Gene (BG) systems • BG/Q Mira at Argonne: 10 PFlops, arrived in 2012, 750,000 cores, 16GB per node • BG/Q Sequoia at Livermore: twice as large • New challenges: • BG/Q systems have many cores but no accelerators • Slab-decomposed FFT does not scale well on very large number of cores • Solutions: • Particle-particle interaction now replaced by tree, OpenMP node parallel • Pencil decomposed FFT • Adaptive time stepping • Achieved 13.94PFlops on Sequoia, 90% parallel efficiency on 1,572,864 cores • 3.6 trillion particle benchmark run 0.01 0.1 1 10 100 1024 4096 16384 65536 2621441048576 1 2 4 8 16 32 64 128 256 512 1024 2048 4096 8192 16384 Time[nsec]perSubstepperParticle PerformanceinTFlop/s Number of Cores Weak Scaling up to 96 Racks; Strong Scaling, 10243 Particles 69.2% of peak Strong Scaling Strong Scaling Weak Scaling Weak Scaling Ideal Scaling Habib et al. SC12, Gordon Bell Finalist The Story continues, Multi-core systems, BG/Q
- 51. The HACC Story Chapter 3 — The South
- 52. The HACC Story Chapter 3 — The South
- 53. The HACC Story Chapter 3 — The South
- 54. The HACC Story Chapter 3 — The South
- 55. The HACC Story Chapter 3 — The South
- 56. HACC Accelerated Again: CPU+GPU • Proof of concept for easy portability: Go back to Roadrunner short-range solver, replace Cell part by GPU implementation (first version already existed in 2010) • New challenges: • CPU/GPU performance and communication out of balance AND unbalanced memory (CPU/main memory dominates) • New programming language on GPU, OpenCL • With the arrival of Titan in 2013 (GPU accelerated supercomputer at Oak Ridge National Lab): • Nick Frontiere rewrote and optimized P3M short-range solver, now in CUDA • New load-balance scheme • Now running on Summit S. Habib et al. 2013: SuperComputing13, Gordon Bell Finalist 0.01 0.1 1 10 100 32 64 128 256 512 1024 2048 4096 8192 16384 Time[nsec]perSubstepperParticle Number of Nodes Weak Scaling up to 16384 nodes; Strong Scaling for 10243 Particles Weak scaling, original submission Weak scaling, improved P3 M version Weak scaling, TreePM version Strong scaling, original submission Ideal Scaling Basically full machine run P3M improvement NOW EVEN BETTER TreePM Weak and Strong Scaling Results • 20.54 Pflops peak performance evolving 1.23 trillion particles in test run on ~75% of machine (full machine not available at the time) • Summitdev: Speed up of short-range solver by ~3.2x (with no changes) on NVIDIA Pascals
- 57. The HACC Story Chapter 4 — The West and back Home
- 58. The HACC Story Chapter 4 — The West and back Home
- 59. The HACC Story Chapter 4 — The West and back Home
- 60. The HACC Story Chapter 4 — The West and back Home
- 61. The HACC Story Chapter 4 — The West and back Home
- 62. The HACC Story Chapter 4 — The West and back Home
- 63. The HACC Story Chapter 4 — The West and back Home
- 64. The HACC Story Chapter 4 — The West and back Home
- 65. The HACC Story Chapter 4 — The West and back Home
- 66. HACC on KNL: Successful Port and New Physics 0.01 0.1 1 10 100 1000 4 8 16 32 64 128 512 2048 Time[nsec]pergridpoint/particleperstep Number of Nodes FFT Full time step Ideal Scaling • Proof of concept for easy portability: KNL • Short-range solver again tree-based, minor modifications to the short-range solver, obtained expected performance for gravity-only part • And: New physics! Supercomputers are getting faster but memory increase doesn’t keep up, so instead of bigger, more physics: baryons • HACC is particle-based code, therefore use Smoothed Particle Hydrodynamics (SPH) approach with new developments (Conservative reproducing kernel) to overcome traditional SPH short-comings = CRK HACC Weak scaling up to 3072 nodes Dark matter density Baryon density Santa Barbara Cluster
- 67. Emberson et al., ApJ 2019. Color: Baryon temperature, white: density. Full size: 1126 Mpc, 24 billion particles, movie: Zoom in to (35x35x47)Mpc volume. Borg Cube Simulation carried out with CRK-HACC on Theta
- 68. Emberson et al., ApJ 2019. Color: Baryon temperature, white: density. Full size: 1126 Mpc, 24 billion particles, movie: Zoom in to (35x35x47)Mpc volume. Borg Cube Simulation carried out with CRK-HACC on Theta
- 69. The HACC Story Chapter 5 — Back to the South
- 70. The HACC Story Chapter 5 — Back to the South
- 71. The HACC Story Chapter 5 — Back to the South
- 72. The HACC Story Chapter 5 — Back to the South
- 73. The HACC Story Chapter 5 — Back to the South
- 74. The HACC Story Chapter 5 — Back to the South From 1PFlop+ in 2008
- 75. The HACC Story Chapter 5 — Back to the South From 1PFlop+ in 2008 to 200 PFlop+ in 2018
- 76. Qo’noS simulation carried out with HACC on Summit • HACC and CRK-HACC scale to full machine • Three simulations, each evolving 1.85 trillion particles carried out already Image Credit: S. Rizzi, J. Insley
- 77. HACC in Pictures Why is his flop count higher than mine...? Picture with Gordon Bell and all previous finalists Preparation for Gordon Bell paper on Mira/SequoiaEric Isaacs me Director’s Award together with Mira-ALCF team for stress-testing Mira with HACC
- 78. MC2
- 79. HACC
- 82. SummaryHACC Science Fundamental Physics Questions New Probes to Understand the Universe
- 83. SummaryHACC Science Fundamental Physics Questions New Probes to Understand the Universe Survey Science
- 84. The Large Synoptic Survey Telescope • 8.4-m mirror • 37 billion stars and galaxies • 10 year survey of the sky • 10 million alerts, 15 TB of data, every night! • First light ~2020, first science data in ~2022 • In the meantime: LSST DESC (Dark Energy Science Collaboration) is generating simulations as close to the real data as possible
- 85. The LSST Survey and Data ● Worldwide “Alerts” released nightly (with minimal info) ● Annual data releases: Images, Object and Source tables ● LSST DESC “Data Challenge”: To prepare for the arrival of data, simulate a patch of the survey as realisticly as possible Main survey: 18,000 sq deg of southern sky, “Deep Drilling Fields”, 10 sq deg each, plus further “mini-surveys” to support special science cases
- 86. The LSST Survey and Data ● Worldwide “Alerts” released nightly (with minimal info) ● Annual data releases: Images, Object and Source tables ● LSST DESC “Data Challenge”: To prepare for the arrival of data, simulate a patch of the survey as realisticly as possible Main survey: 18,000 sq deg of southern sky, “Deep Drilling Fields”, 10 sq deg each, plus further “mini-surveys” to support special science cases
- 87. Data Challenge Design Image Credit: H. Awan, Rutgers U.
- 88. Data Challenge Design Image Credit: H. Awan, Rutgers U.
- 89. Data Challenge Design Image Credit: H. Awan, Rutgers U.
- 90. Data Challenge Design Image Credit: H. Awan, Rutgers U.
- 91. Data Challenge Design Image Credit: H. Awan, Rutgers U.
- 92. Data Challenge Design Image Credit: H. Awan, Rutgers U.
- 93. DESC End-to-End Simulation Workflow Extra-galactic catalog: Galaxy shapes and colors, shears, dust, …. Image simulations: Milky Way stars, dust, atmosphere and seeing conditions, telescope, CCD defects, cosmic rays, transients, … Processing with the LSST Science Pipeline: Calibration, clean-up, …
- 94. CosmoDC2: The Extragalactic Catalog Ingredients: • A REALLY large simulation: HACC simulation with > 1 trillion particles, 4.5PB of data; 4.2Gpc volume, mp~2x10⁹Msun; carried out on 2/3 of Mira • A physics-based model that allows us to determine which halos host what kind of galaxies • Validation data and tests from past and ongoing surveys to confirm that our simulated data looks like the real Universe! • Result: Catalog where each galaxy has more than 500 properties 4.2Gpc Large halos in the Outer Rim simulation, volume large enough to model future survey Image Credit: S. Rizzi, J. Insley
- 95. Image Simulation Runs ● Image simulations rather costly, running at NERSC, Argonne (ALCF), and UK/France Grid ● Developed workflows for imSim using Parsl (ran on up to 4000 nodes at ALCF) ● 7.5M sensor visits need to be simulated and processed! Image Credit: H. Kelly, SLAC
- 96. Processing with the LSST Science Pipeline
- 97. Processing with the LSST Science Pipeline Image Credit: C. Walter, Duke U.
- 98. Image Credit: D. Boutingy and the DC2 Team of LSST DESC
- 99. Image Credit: D. Boutingy and the DC2 Team of LSST DESC