1. “sf” RTA P2005#84 EPA SBIR Phase II CN: EP-D-06-084 Phase II Final Report May 2010
Report Type: Phase II EPA SBIR Final Report
Date of the report: May 2010
EPA Contract Number: EP-D-06-084
Title: Multiplexed Chemical Sensor for Water Security
PI: Dr. Stuart Farquharson
Business name: Real-Time Analyzers, Inc.
EPA contact: James Gentry
Project period: May 1, 2006 to May 31, 2010
Research category: SBIR, Topic I1. Drinking Water and Wastewater Security (2004)
Purpose of the research:
The overall goal of this proposed program (through Phase III) is to provide the EPA with a
chemical sensor that can be multiplexed into water distribution systems to provide early warning
of poisoned water supplies.
Brief description of the research carried out:
The overall goal of the Phase II program was to fully develop the proposed analyzer and improve
sensitivity to detect poisons at 10 µg/L (10 parts-per-billion, ppb) in 10 minutes. This was
accomplished by optimizing the surface-enhanced Raman active sol-gel chemical selectivity,
ruggedizing the capillaries, developing a universal sampling system with a stream-to-capillary
interface and a capillary-to-fiber optic probe interface, and developing a comprehensive analysis
that included a searchable spectral library of 96 poison related chemicals capable of rapidly
identifying these chemicals.
Research findings:
Twenty target chemicals, consisting of chemical agents, their hydrolysis products, simulants,
pesticides and toxic industrial chemicals, were measured reproducibly at 10 µg/L (10 ppb) in 10
minutes, with a statistical confidence of 95% or greater! A universal and automated sampling
system that controlled flow, pressure and delivery of water samples to the surface-enhanced
Raman active capillaries, was successfully designed and used to measure samples from New
York City’s Kensico Reservoir. This included measurement of methyl phosphonic acid (75
ppb), thiodiglycol (100 ppb), and cyanide (100 ppb), the primary hydrolysis products of the
nerve agents, mustard gas, and cyanide salts, close to or exceeding the required detection limits
(10, 100, and 6000 ppb, respectively).
Potential applications:
In addition to the proposed application of monitoring water supplies to ensure safe drinking
water, the proposed analyzer could be used by first responders to assess safety of any water
supply. It could also be used to evaluate groundwater contaminated by cyanide (leaching
operations) or chromium (plating operations).
This entire document is considered Proprietary Information,
except for this Cover Page and the Executive Summary.
362 Industrial Park Road
Providing Chemical Information When & Where You Need It Middletown, CT 06457
1
2. “sf” RTA P2005#84 EPA SBIR Phase II CN: EP-D-06-084 Phase II Final Report May 2010
“Multiplexed Chemical Sensor for Water Security”
EXECUTIVE SUMMARY
The overall goal of this proposed program (through Phase III) is to provide the EPA with a chemical sensor that can
be multiplexed into water distribution systems to provide early warning of poisoned water supplies. This will be
accomplished by developing surface-enhanced Raman (SER) sensors that can be integrated into water supply
systems and coupled to a central Raman analyzer via fiber optics.
The overall goal of the Phase II program was to fully develop the proposed analyzer and improve sensitivity to
detect poisons at 10 µg/L (10 parts-per-billion, ppb) in 10 min (~the 5 day/5L values in Table E.1). This included
optimizing the SER-active sol-gel chemical selectivity, ruggedizing the capillaries, developing a universal sampling
system with a stream-to-capillary interface and a capillary-to-fiber optic probe interface, and developing a
comprehensive analysis that includes rapid chemical identification. These goals were largely met as summarized
by the following accomplishments:
1) The sol-gel chemistry was successfully optimized to achieve the required sensitivity of at least 10 µg /L (ppb) for
all of the 20 target chemicals within 10 minutes using a solid phase extraction cartridge that was included in the
sampling system. The Lowest Measured Concentrations (LMC) for these chemicals are summarized in Table E.1.
SER spectra are shown in Figure E.1 for methyl phosphonic acid, thiodiglycol, and cyanide, the primary hydrolysis
products of the nerve agents, mustard gas, and cyanide salts.
Table E.1. Lowest Measured Concentrations (LMC) for the 20 primary chemicals studied compared to the
Required Detection Limit (RDL, Military Drinking Water Guidelines, Short Term, 19991), along with the parent
chemical agents, stimulants, pesticides, chlorinated by-products and their selected hydrolysis products.
Chemical Agents & Hydrolysis RDL (5-day/5L LMC
Simulants (Abbreviation) Products (µg/L (ppb) (µg/L (ppb))
Sarin (GB) isopropyl methylphosphonic acid (IMPA) 28 10
Soman (GD) pinacolyl methylphosphonic acid (PMPA) 12 10
Tabun (GA) ethyldimethyl-phosporamidate (EDMPA) 140
Cyclohexyl Sarin (GF) cyclo methylphosphonic acid (CMPA) 28 10
VX ethyl methylphosphonic acid (EMPA), 15 10
EA2192, methylphosphonic acid (MPA), 1
di-isopropylamino ethanethiol (DIASH) 10
EA2192 same as for VX 30
Mustard (HD) thiodiglycol (TDG), 1,4-dithiane 100 10
2-chloroethyl ethylsulfide 2-hydroxyethyl ethyl sulfide (HEES) 10
(CEES, half mustard) 10
2-chloroethyl methyl sulfide same as for CEES
(CEMS, HD simulant) 10
cysteamine S-phosphate sodium
salt (CSPS, VX simulant) 10
Hydrogen Cyanide (HCN) cyanide (CN) 6000 0.1
Pesticides
chlorpyrifos (CP) trichloropyridinol (TCP) 40 10
fonofos (FON) O,O-dimethyl hydrogen thiophosphate, 30 10
potassium salt (DMHTP) 10
methyl parathion (MP) dimethylthiophosphoric acid DMTPA 300 10
disulfoton (DS) disulfoton sulfoxide (DS-SO) 140 10, 10
Chlorination By-products
3,5-dichlorobenzoic acid (DCBA) 1500 10
4,4-dichlorobiphenyl (DCBP) 1400 1
2) The two most active sol-gel chemistries were successfully developed to withstand flow rates of 5 mL/min and
pressures of 30 psi. The sample system was successfully designed to reduce flow and pressure to at least these
values.
2
3. “sf” RTA P2005#84 EPA SBIR Phase II CN: EP-D-06-084 Phase II Final Report May 2010
Methyl Phosphonic Acid 100
Probability of Detection, %
95% Confidence Line
80
60
Thiodiglycol
40
20
Cyanide
0
20 040 60 80 100
Probability of False Positive, %
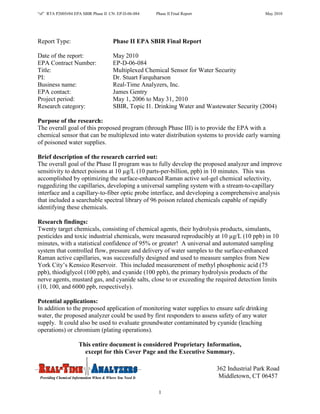
Figure E.1. Surface-enhanced Raman spectra of 10 Figure E.2. Receiver Operator Characteristic curves for
µg/L (ppb) methyl phosphonic acid (MPA), 5 µg/L (ppb) methyl phosphonic acid using the raster
thiodyglycol (TDG), and sodium cyanide (CN). program (green) and discrete points (red). The black
line is the probability of a random guess (50/50).
3) Receiver operator characteristic (ROC) curves were used to demonstrate that the required sensitivity could be
reproducibly achieved 95% of the time with a 3 minute spectral acquisition for methyl phosphonic acid,
thiodyglycol, cyanide, fonofos, dichlorobenzoic acid, and sunset yellow (a food dye selected for field studies).
However, this required scanning the length of the capillary (rastering, Figure E.2), which was not implemented in
the final sampling system.
4) Software was written that successfully identified any of 96 chemicals within a spectral library data base,
consisting of chemical agents, pesticides, toxic industrial chemicals, and hydrolysis products. The spectral search
software ranks all of the chemicals based on the closest match to the unknown. The analysis is virtually
instantaneous (<< 1 sec, Figure E.3)
Figure E.3. Spectral search software showing
identification of unknown sample (10 ppb MPA Spectral Match (MPA)
in water) as MPA using the 96 component library.
Measured Unknown
Conditions: 80 mW, 785 nm, 1-min.
Note the following ranking of phosphate
containing chemicals (a score greater than 0.4
represents a mismatch):
Hit Quality Name
0 0.174 MPA
1 0.477 DEHDTP
2 0.498 EMPA
3 0.512 CMPA
4 0.522 DMHP
5 0.524 VX
5) A computer controlled sample system was designed and successfully built that was capable of being connected to
virtually any water supply. It controls the water flow rate and pressure, directs the sample first through a solid phase
extraction cartridge (for 5 min) into a waste container, then switches flow to pass methanol through the cartridge and
transfer the concentrated sample to the SERS-active capillary (for 5 min). The flow is reset to introduce the next
sample, while the SER spectrum is acquired using a fiber optic coupled Raman spectrometer (Figure E.3). Analysis
is updated every 10 minutes.
3
4. “sf” RTA P2005#84 EPA SBIR Phase II CN: EP-D-06-084 Phase II Final Report May 2010
Sample
In Waste
Bypass
SERS
Capillary
SPE
A B MeOH Waste
D C
Figure E.4. A) Photograph of prototype Raman analyzer with fiber optic probe connected to B) the sampling system.
The yellow line shows the sample flow through the SPE during the concentration step. The red line shows the flow
of methanol through the SPE to the SERS Capillary during the extraction and delivery step. C) User Interface
software used to control the sample and solvent flow. D) User interface of software used during operation (“More”
shows spectral match as shown in Figure E.3).
6) The automated sample system in conjunction with a Raman analyzer was successfully used to detect 75 µg/L
(ppb) methyl phosphonic acid artificially added to water samples obtained from the Kensico Water Reservoir, which
supplies New York City its drinking water (Figure E.5). The raster method was NOT used, which improved
sensitivity by more than a factor of 10 (and would therefore achieve the required sensitivity).
Figure E.5. Surface-enhanced Raman spectrum of
75 ppb MPA extracted from a Kensico Reservoir
water sample using the Figure E.4B sample system
(SPE and SERS Capillary). The total analysis
time is approximately 10 minutes.
4
5. “sf” RTA P2005#84 EPA SBIR Phase II CN: EP-D-06-084 Phase II Final Report May 2010
Limitations and Suggestions. Although 17 of 20 milestones were met, 3 were not. First, the proposed fiber-optic
to SERS-capillary interface, which would use a Parker-Hannifin “Intraflow” machined block, was not pursued. This
was largely due to the fact that Parker-Hannifin delayed delivery by more than 1 year of the sample system Intraflow
components that they presumably already manufactured. Nevertheless, we successfully built a suitable (non-
integrated) probe to perform the measurements. This probe could be readily modified to be a permanent component
of the sample system.
Second, the proposed measurements of actual nerve agents at the US Army’s Edgewood Chemical and Biological
Research Center were never performed. Although the US Army provided a letter indicating that they would perform
such measurements, and we mailed SERS-active capillaries to them for these measurements, they were not able to
fit these measurements into their schedule. We understand their priorities have changed to detecting biological
warfare agents.
Third, the at-site measurements at Kensico Reservoir were never performed. This was due to the fact that the
prototype system requires a number of modifications to perform these tests correctly. These modifications include:
1) developing a motorized fiber optic probe system to “scan” the SERS capillary to achieve the necessary sensitivity
and/or 2) incorporating additional solid phase extraction material into the SERS-active sol-gel to overcome sample
dilution due to the sample system channels to achieve the necessary sensitivity, 3) mounting the probe to the sample
system, 4) completing the top level software user interface so that it incorporates a) the flow control software, b) the
Raman analyzer control software, c) the chemical identification software, d) the ROC curve concentration software
with alarms. It should be noted that the personnel at Kensico Reservoir were willing to perform the proposed
measurements using the food dye sunset yellow, which we measured at 1 µg/mL (ppb).
Fourth, although the proposed prototype was built using matching funds and tested using the Commercialization
Option funds, due to the limitations cited above (primarily sensitivity), the proposed additional field tests were not
performed. Finally, for these same reasons, the Verification Option was not exercised.
Finally, it is worth noting that we (Real-Time Analyzers) have continued talks with Hach and GE Power & Water
(March, 2010, April 2010, respectively), and will pursue Phase III commercialization with these companies as
partners.
5
6. “sf” RTA P2005#84 EPA SBIR Phase II CN: EP-D-06-084 Phase II Final Report May 2010
Confidential Proprietary Information
TABLE OF CONTENTS
Cover Page ................................................................................................................................................... 1
Executive Summary ..................................................................................................................................... 2
Table of Contents ......................................................................................................................................... 4
Program Description .................................................................................................................................. 4
1. Identification and Significance of the Problem or Opportunity................................................................... 6
2. The Phase II Program Schedule (verbatim from the Phase II proposal) ...................................................... 8
3. Detailed Summary of Phase II Work ........................................................................................................... 8
Task 1. Refine sol-gel selectivity and sensitivity ..................................................................................... 9
Task 2. Develop SER-active capillary durability .................................................................................. 20
Task 3. Develop Spectral Library.......................................................................................................... 30
Task 4. Test Sol-Gel Capillaries with Real Water Samples ................................................................... 59
Task 5. Establish Performance (ROC Curves) ...................................................................................... 63
Task 6. Design and Test Sample System .............................................................................................. 75
Task 7. Field Tests ................................................................................................................................ 87
4. Conclusions ............................................................................................................................................... 89
5. Publications ............................................................................................................................................... 89
6. Commercialization .................................................................................................................................... 90
References ................................................................................................................................................. 90
Appendix (Publications) ............................................................................................................................ 92
PROGRAM DESCRIPTION
1. Identification and Significance of the Problem or Opportunity
The nation’s drinking water supply is a potential target for terrorists. Chemical sensors or sensor systems are needed to
provide an early warning of poisoned water supplies to protect US citizens. This program will develop such a sensor to
meet this need. The remainder of this section is verbatim from the Phase I Proposal. The Phase II summary begins
on page 8.
1.a. The Problem or Opportunity - Countering terrorist attacks requires recognizing likely deployment scenarios
and having the required technology to rapidly detect the deployment event. In addition to the expected use of
chemical agents released into the air, terrorists may also poison water supplies. The National Strategy for Homeland
Security designates the Environmental Protection Agency with the task of securing the nations drinking water.2 In
response the EPA has defined four broad categories of both public and private labs based on analysis type:
environmental, radiochemical, biotoxins, and chemical weapons.3 In the case of attack (real or suspected) the EPA
has developed protocols for collecting samples, sending them to EPA designated labs, and performing analyses. In
the case of chemical warfare agents (CWAs) there are only two labs with the surety to perform these analyses.
Furthermore, the analytical methods employed (e.g. gas chromatography coupled with mass spectrometry) require
sample extraction and calibration, and are time consuming. The positive determination that a water supply is
contaminated is likely to take as much as a day. This is entirely inadequate for the prevention of widespread illness,
death, and terror. To overcome this limitation, the EPA has identified a number of field test kits, but unfortunately,
they lack chemical selectivity and yield positive response to other chemicals. Clearly, a system of integrated sensors
with chemical specificity is needed to monitor the safety of drinking water in real-time.
1.b. The Innovation - We at Real-Time Analyzers (RTA) believe that a series of chemical sensors, based on
surface-enhanced Raman (SER) spectroscopy, can be multiplexed into water distribution systems to provide early
warning of poisoned water supplies. The proposed analyzer would employ sensors composed of 1 mm diameter
windows coated with chemically selective sol-gels that will extract and concentrate target chemical agents,
pesticides or harmful industrial chemicals from flowing streams (Figure 1.1). The sol-gel sensor will also contain
metal particles to generate SER spectra of these analytes allowing detection of 10 microg/L in 10 minutes. The
coated sensor windows will be hermetically mounted to a stainless steel flange, such that it can handle high
pressures (100 psi) and variable temperatures (5-40 C). Fiber optics will allow placement of sensors at critical nodes
throughout the distribution system at distances up to 100 m from a central Raman analyzer. A 10-position fiber
optic coupling wheel interfaced to the Raman analyzer will allow sequential analysis of the nodes. Multiplexing
software and supervisory control and data acquisition (SCADA) system software will provide the appropriate
6
7. “sf” RTA P2005#84 EPA SBIR Phase II CN: EP-D-06-084 Phase II Final Report May 2010
warnings to EPA and/or water authority personnel.
The proposed SERS-active, chemically-selective Fiber Optic
sensors are based on several important advances Coupled Probe
developed at RTA. First, we have developed and
patented a sol-gel process that incorporates silver Fibers to
and/or gold nanoparticles into a stable porous silica Raman
matrix.4,5 Second, no special reagents, conditions or Analyzer
sample treatments are required, and aqueous solutions
ranging in pH from 2 to 11 can be used. Third, the sol-
gel process is highly reproducible, and we guarantee
SER-activity at 20% RSD for our Simple SERS Water
Pipe SER-Active
Sample Vials, now sold commercially for 2 years Window
(Figure 1.2). Fourth, we have used these metal-doped
sol-gels to measure SER spectra of several hundred
chemicals,6-11 with typical detection limits of 10 mg/L
using 100 mW of 785 nm and 3-min acquisition time.
Fifth, we have measured cyanide (CN), mustard (HD), Figure 1.1. Idealized concept of a SERS-based chemical
VX, as well as several CWA hydrolysis products, (e.g. agent detection node integrated into a water distribution
pinacolyl methyl phosphonic acid), and numerous system.
pesticides at 10 mg/L in 1 minute, with estimated limits of detection of 1 mg/L (Figure 1.3). Sixth, the choice of
metal and alkoxide can be used to develop chemically selective sensors. We have successfully developed sol-gels
that select for polar-positive, polar-negative, weakly polar-positive, and weakly polar-negative chemical species.12
Seventh, we can coat a variety of surfaces to produce a wide range of sensor designs, including the glass discs
proposed here. We have filled capillaries and micro-channels to detect flowing samples, as well as to perform
chemical separations.13
1008 cm-1 band intensity for BA
A
45 40.0-45.0
40 35.0-40.0
35 30.0-35.0
30 25.0-30.0
25
B
20.0-25.0
20
15.0-20.0
15
10.0-15.0
10
5.0-10.0
5
6 0 0.0-5.0 C
330
9
300
270
240
210
12
180
150
Height
120
90
along 15
60
30
15o increments around vial
0
vial (mm)
Figure 1.2. Reproducible SER-intensity response for Figure 1.3. SER spectra of A) cyanide, B)
benzoic acid over entire surface of a Simple SERS pinacolyl methyl phosphonic acid and C) fonofos,
Sample Vial. Average = 29.1± 4.26 (14.6%) for 240 all at 10g/L in water. Conditions: 100 mW of 785
points (10 sec per point). nm, 1-min.
Finally, it is worth noting that RTA has developed an extremely rugged, compact Raman instrument that employs
interferometry for absolute wavelength accuracy and an avalanche Si detector that improves sensitivity by ~100
times.14 And we are currently developing a portable, battery powered version of the system for the Navy, which will
weigh 21.5 pounds, occupy 0.5 cubic foot, require 23.5 W, and will be capable of wireless communication.15
7
8. “sf” RTA P2005#84 EPA SBIR Phase II CN: EP-D-06-084 Phase II Final Report May 2010
2. The Phase II Program Schedule (verbatim from the Phase II proposal)
Performance Schedule (24 Months) Quarters
0 1 2 3 4 5 6 7 8
Task 1 - Refine sol-gel chemistry (6 mo) 1 2 3 .
Task 2 - Develop capillary durability (4 mo) 4 5 .
Task 3 - Develop spectral library (2 mo) 6 7.
Task 4 - Identify real sample interferents (3mo) 8 9 10 .
Task 5 - Define performance (ROC) (4 mo) 11 12 .
Task 6 - Design and test sampling system (3 mo) 13-16.
Task 7 - Perform field tests (2 mo) 17 18 19 20.
Milestones
1. Prepare various Chem. 2 sol-gel capillaries 11. Measure 5 conc, 5 samples
2. Test extraction and SER-activity for 20 analytes 12. Plot ROC curves, calc. K
3. Determine baseline LODs 13. Finalize sample system design
4. Develop capillary coating process 14. Build SERS-capillary interface
5. Test flow and pressure integrity 15. Build FO interface
6. Measure chemicals, calc LODs 16. Test sample system
7. Test library search algorithms 17. Obtain Kensico samples
8. Measure artificially prepared interferents 18. Perform Edgewood measurements
9. Measure real sample interferents 19. Perform Kensico measurements
10. Design solution (filter) as needed 20. Summarize Data in a Final Report.
All data will be summarized in terms of existing and estimated (Phase III product) capabilities in the Final Report.
3. Detailed Summary of Phase II Work
The overall goal of Phase II will be to fully develop the proposed analyzer and improve sensitivity to allow detection
at 10 microg/L in 10 min (~the 5 day/5L values in Table 2). This will include ruggidizing the SER-active sol-gel
capillaries, developing a universal sampling system with a stream-to-capillary interface and a capillary-to-fiber optic
probe interface, and developing comprehensive analysis that includes rapid chemical identification. Capabilities
will be developed using real-world samples and performing two field tests. The American Water Works will supply
numerous samples from the NJ drinking water distribution system. One field test will involve the analysis of a food
dye artificially added to a NYC water supply, while the other field test, performed at the US Army’s Edgewood
Chem Bio Research Center, will involve the analysis of HD and VX added to a close-loop water test system.
8
9. “sf” RTA P2005#84 EPA SBIR Phase II CN: EP-D-06-084 Phase II Final Report May 2010
Task 1. Refine sol-gel selectivity and sensitivity. The overall objective of this task is to finalize the sol-gel
chemistry so that the target chemicals can be detected at the required concentrations (e.g.10 microg/L (10 ppb)).
This will be accomplished by improving chemical extraction and taking advantage of improved SER-active sol-gels
to detect 20 targeted chemicals.
Twenty primary target chemicals listed in Table 1.1 (Bold) were tested in this Task (as well as in Task 3)
with a refined subset of the SERS-active sol-gel chemical libraries summarized in Table 1.2. The SER activities and
lowest measured concentrations for the 20 chemicals and the 6 sol-gel libraries are summarized in Table 1.3.
Table 1.1. Chemical agents, stimulants, pesticides, chlorinated by-products and selected hydrolysis products with the Military
Drinking Water Guidelines (Short Term, 1999).16 Bold indicates the 20 primary chemicals to be included in this study.
Chemical Agents & 5-day/5L 5-day/15L Hydrolysis Hydrolysis
Simulants (mg/L) (mg/L) Half-Life* Products
Sarin (GB) 0.028 0.0093 21.3 hours IMPA
Soman (GD) 0.012 0.004 2.3 hours PMPA
Tabun (GA) 0.14 0.046 4.1 hours CN/EDMPA
Cyclohexyl Sarin (GF) 0.028 0.0093 21.3 hours CMPA
VXL 0.015 0.005 82.1 hours EMPA, EA2192, MPA, DIASH
EA2192 0.03 0.01 9 years same as for VX
Mustard (HD)L 0.1 0.05 2-30 hours TDG, 1,4-dithianeL
CEES (1/2mustard) 2-4hrs HEES
CEMS (HD simulant) 1-2 hrs same as for CEES
CSPS (VX simulant)
HCN 6 2 (0.2)** Stable CN
Pesticides
CP 0.04 0.014 (0.09)** 35-78 days TCPL
FON 0.03 0.0009 2 days DMHTP (EEPA)
MP 0.3 0.1 (0.002)** 11.2 days DMTPAL
DS 0.014 0.005 (0.01)** 5-12 hrs DS-SO
Chlorination By-products
DCBA 1.5 0.5 (0.06)**
DCBP 1.4 0.5
* pH 7 to 7.5 and 20 to 25 oC, ** EPA MCL, L = to be measured as part of the spectral library. CN = cyanide, IMPA = isopropyl
methylphosphonic acid, PMPA = pinacolyl methylphosphonic acid, EDMPA = ethyldimethyl-phosporamidate, EMPA = ethyl
methylphosphonic acid, CMPA = cyclo methylphosphonic acid, MPA = methylphosphonic acid, DIASH = di-isopropylamino ethanethiol, TDG
= thiodiglycol, CEES = 2-chloroethyl ethylsulfide, HEES = 2-hydroxyethyl ethyl sulfide, CEMS = 2-chloroethyl methyl sulfide, CSPS =
cysteamine S-phosphate sodium salt, TCP = trichloropyridinol, EEPA = O-ethyl ethylphosphonothioic acid, DMHTP = O,O-dimethyl hydrogen
thiophosphate, potassium salt, DMTPA = dimethylthiophosphoric acid, DS = disulfoton, DS-SO = disulfoton sulfoxide, DCBA = 3,5-
dichlorobenzoic acid, DCBP = 4,4-dichlorobiphenyl, CP = chlorpyrifos, FON = fonofos, and MP = methyl parathion. Italics mean not in SERS
library; of these GA, GB, GD, EEPA and DMTPA have not yet been measured. We are in process of measuring G-agents at Aberdeen. Chemicals
in parentheses mean could not be purchased.
Table 1.2. Updated summary of chemically-selective, SERS-active, sol-gel libraries (capillaries) used in Task 1.
Chemistry Selectivity/Analyte Metal Solution A/ Metal precursor A (µL) B (µL) Solution B/ Sol-gel precursor
Type M Component ratio volume volume Si-Alkoxide ratio + additional
components
standard P-C Ag 1N AgNO3/28%NH3OH/CH3OH/H2O
L1 polar - negative silver 5:1:10:0 100 120 TMOS/MTMS (1:6)
L2 non-polar - negative silver 5:5:10:0 100 100 MTMS
L3 non-polar – negative silver 5:5:10:0 100 175 MTMS/ODS/TMOS (5:1:1)
P-C Au 0.25N HAuCl4 /70% HNO3
L4 polar - positive gold 4:1 100 100 TMOS
OTC Ag 1N AgNO3 /0.026M NaBH4
L6 polar-negative silver 3:1 120 120 APTES (95/5 in EtOH)
modified P-C (polymer) Ag 1N AgNO3/28%NH3OH/CH3OH/H2O
L1_PEG polar - negative silver 5:1:10:0 100 120 TMOS/MTMS (1:6) + 10 PDMS
L2_PEG non-polar – negative silver 5:5:10:0 100 120 TMOS/MTMS (1:6) + 10 PEG
L3_PDMS non-polar – negative silver 5:5:10:0 100 100 MTMS/ODS/TMOS (5:1:1) + 10 PDMS
Note: Initial metal precursors/reagents prepared in water unless noted. Sol-gel chemistries in Italics are new chemistries developed during two
NASA PII SBIRs. P-C designates filled packed-capillaries and OTC designates open tubular capillaries. Si-alkoxide precursors: TMOS
(tetramethyl-orthosiloxane), MTMS (methyltrimethoxy-siloxane), ODS (octadecyl-trimethoxysilane) and APTES (3-
aminopropyltrimethoxysilane). Polymer additives: PDMS (polydimethyl-siloxane) and PEG (polyethyleneglycol).
9
10. “sf” RTA P2005#84 EPA SBIR Phase II CN: EP-D-06-084 Phase II Final Report May 2010
Table 1.3. SERS-activity (+/-) and LMC (ppb) summary of the 20 target chemicals measured (on L1-L6).
CN CSP MPA DIASH EMPA IMPA CMPA PMPA CEES CEMS TDG HEES
S
L1 + + + - + + + + + +
peg + + + + + + + + + + + -
L2 + + + + + + +
peg + + + + - + - + + + -
L3 + + + + + + + + + + + +
pdms + + + +
2/1 +
L4 + - - + - - - - + + - -
L6 + + + + + + + + + + + +
Static L2 1k L1 1k L3 1k L3100 L3 1k L3 10k L3100k L3 10k L3100k L1 10k -1kL3
L6 1k L6 10 L6 10 L6 10 L6 100k L61000k L61000k L6 100k L6 1k L6 1k
L3pdms10k L4 1k L4 1k
Flow L2 1 L2 1k L3 1k -10 L3 L3 1k -1kL2 -1k L2 -1k L3pdms L3 1k L3 500wk L11k L2 1k
L32/1 L2 100 -500L1peg L2 100
500 L4 50
SPE L2 0.1 L6 10 L3 1k L3 10 L2 10 L1 10 L2 10 L1peg10 L6 10
L4 10 L1peg 10
AIEX L3 10 L2 10 L3 10 L3 10 L2 10 L2 10 L3 10
L6 10 L6 1
CP MP FON DS DSSO DMHTP DCBA 44DCBP
L1 + + + + +
peg + + + +
L2 + + + + +
peg + +
L3 + + + + + + +
pdms -
2/1 +
L4 - - wk - - - - +
L6 + + + + + + + +
Static L3 1k L3 1k L2 1k L3 1k -1k L3
L6 L6 50 L6 10 L6 10
100 L32/1500 L4 10
Flow L3 1k L3 1k -10 L3 L2 1k
-1k L2 L2 1k L2 100 -1k L2 -1k L2 -1k L2
L1peg 1k L32/150 -1kL1peg -1k L1peg L4 0.1
SPE L3 10 L3 10 L3 10 L3 10 L3 10 L2 10
L1peg10 L6 10 L6 10
AIEX L2 10 L2 10
L3 10
Red indicates successful low ppb measurements.
SERS measurements were performed in glass capillaries (1.1 mm outer diameter, 0.8 mm inner diameter) filled with
metal-doped sol-gels. The basic design and use of the SER-active capillaries is shown in Figure 1.1, and are
prepared as follows. The alkoxide and amine precursors are prepared according to Table 1.2, mixed, and then drawn
into the capillary by syringe. Typically 0.1 mL of solution coats a 4 cm length of capillary. The sol solution gels in
5 minutes, and a more rigid structure is obtained after 24 hours. A solution of 0.1g/100mL NaBH4 is drawn through
the capillary to reduce the metal. This is followed by a 0.035% HNO3 acid wash, and then the capillary is ready to
be used.
10
11. “sf” RTA P2005#84 EPA SBIR Phase II CN: EP-D-06-084 Phase II Final Report May 2010
Fig.1.1. Photograph of silver-doped sol-gel coated melting point capillaries attached to syringes, before (top) and after (bottom)
reduction with sodium borohydride. Note: capillaries filled with gold-doped sol-gels are similarly prepared, but reduced twice.
Initial screening of the sol-gel SER-activity employed 1 mg samples in 1 mL HPLC grade methanol or water. For
“static” measurements, 50 µL of the samples were drawn into the capillaries, which were mounted on an XY sample
stage above a fiber optic probe coupled to RTA’s Industrial Raman Analyzer. Spectra were obtained using 80 to
100 mW of 785 nm excitation at the sample and 1 minute acquisition time unless noted otherwise. Once the initial
screening was performed, the stock samples were serially diluted to determine sensitivity. Also, normal Raman
(NR) spectra of the analytes were acquired as pure solids, neat liquids or solutions (in appropriate solvents) in glass
capillaries (or vials) using 300 mW at 785 nm for 5 minutes. Table 1.3 above shows the activity table for the 20
primary chemicals screened on the different chemistries, as well as the lowest measured concentrations (LMC) using
the static, flow and solid phase extraction methods. Figures 1.2 to 1.21show a stack plot of the NR (solid), NR
(solution) and SERS respectively for the 20 target chemicals. Most of the SERS are for 100 or 1000 ppm (0.1 or 1
mg/mL) and are intended to clearly show the Raman peaks (high signal-to-noise ratios) and are not intended to show
the lowest possible concentrations (which come later).
A A
B B
C
C
Fig.1.2. A) NR (solid), B) NR solution (20 mg/mL in Fig.1.3. A) NR (solid), B) NR solution (30 mg/mL in
HPLC water) and C) SERS of 100 ppm sodium cyanide HPLC water) and C) SERS of 1000 ppm cysteamine S-
in water on chem. L2_PEG. Conditions: A) and B) phosphate sodium salt in water on chem. L2.
200mw, 785 nm, 5-min, and C) 80mW, 785 nm, 1-min. Conditions: as in Fig.1.2.
A
A
B
B
C
C
Fig.1.4. A) NR (solid), B) NR solution (400 mg/mL in Fig.1.5. A) NR (solid), B) NR solution (1000 mg/mL in
HPLC water) and C) SERS of 1 ppm HPLC water) and C) SERS of 1000 ppm
methylphosphonic acid in water on chem. L6. di-isopropylamino ethanethiol in methanol on chem.
Conditions: as in Fig.1.2. L2_PEG. Conditions: as in Fig.1.2.
11
12. “sf” RTA P2005#84 EPA SBIR Phase II CN: EP-D-06-084 Phase II Final Report May 2010
A A
B B
C C
Fig.1.6. A) NR (solid), B) NR solution (200 mg/mL in Fig.1.7. A) NR (solid), B) NR solution (250 mg/mL in
3:1 HPLC water/MeOH) and C) SERS of 1000 ppm HPLC water) and C) SERS of 1000 ppm isopropyl
ethyl methylphosphonic acid in methanol on chem. methylphosphonic acid in methanol on chem. L2.
L3. Conditions: as in Fig.1.2. Conditions: as in Fig.1.2.
A A
B B
C C
Fig.1.8. A) NR (solid), B) NR solution (saturated in 1N Fig.1.9. A) NR (solid), B) NR solution (200 mg/mL in
KOH) and C) SERS of 1000 ppm 3:1 HPLC water/MeOH) and C) SERS of 1000 ppm
cyclo methylphosphonic acid in methanol on chem. pinacolyl methylphosphonic acid in methanol on
L2. Conditions: as in Fig.1.2. chem. L2. Conditions: as in Fig.1.2.
A A
B B
Fig.1.10. A) NR (neat liquid) and B) SERS of 1000 ppm Fig.1.11. A) NR (neat liquid), and B) SERS of 1000 ppm
2-chloroethyl ethylsulfide in methanol on chem. L3. 2-chloroethyl methyl sulfide in methanol on chem.
Conditions: as in Fig.1.2. L3_PDMS. Conditions: as in Fig.1.2.
12
13. “sf” RTA P2005#84 EPA SBIR Phase II CN: EP-D-06-084 Phase II Final Report May 2010
A
A
B
B
Fig.1.12. A) NR (neat liquid), and B) SERS of 1000 ppm Fig.1.13. A) NR (neat liquid), and B) SERS of 1000 ppm
thiodiglycol in methanol on chem. L3. Conditions: as in 2-hydroxyethyl ethyl sulfide in water on chem. L3.
Fig.1.2. Conditions: as in Fig.1.2.
A
A
B
B
C
C
Fig.1.14. A) NR (solid), B) NR solution (100 mg/mL in Fig.1.15. A) NR (solid), B) NR solution (neat liquid)
methanol) and C) SERS of 1000 ppm chlorpyrifos in and C) SERS of 500 ppm methyl parathion in
methanol on chem. L2. Conditions: as in Fig.1.2. methanol on chem. L2_PEG. Conditions: as in Fig.1.2.
A A
B B
Fig.1.16. A) NR (neat liquid) and B) SERS of 1000 ppm Fig.1.17. A) NR (neat liquid) and B) SERS of 1000 ppm
fonofos in methanol on chem. L3. Conditions: as in disulfoton in methanol on chem. L1. Conditions: as in
Fig.1.2. Fig.1.2.
13
14. “sf” RTA P2005#84 EPA SBIR Phase II CN: EP-D-06-084 Phase II Final Report May 2010
A
B
Fig.1.18. A) NR (neat liquid) and B) SERS of 1000 ppm Fig.1.19. SERS of 1000 ppm dimethyl hydrogen
disulfoton sulfoxide in methanol on chem. L6. Conditions: thiophosphate in methanol on chem. L3. Conditions:
as in Fig.1.2. as in Fig.1.2. Note; no pure sample was available to
generate NR.
A
A
B
B
Fig.1.20. A) NR (solid) and B) SERS of 1000 ppm Fig.1.21. A) NR (solid) and B) SERS of 1000 ppm
3,5-dichlorobenzoic acid in methanol on chem. L3. 4,4-dichlorobiphenyl in methanol on chem. L3.
Conditions: as in Fig.1.2. Conditions: as in Fig.1.2.
From the above it was found that chem. L2, L3 and L6 are universal chemistries for routine screening of the 20
target chemicals at nominal concentrations. Once the screening was performed, the chemicals were serially diluted
to 10 ppb (desired sensitivity). Initially, two methods were experimented with to achieve the desired sensitivity.
The first method was the static method, which simply involved loading a small sample plug over the sol-gel and
making SERS measurement. The second method was the flow method, which involved flowing a fixed volume of
the sample through the sol-gel capillaries.
The static method, in general, allowed measuring a few chemicals in the range of 100 ppm to 10 ppb (for e.g. MPA,
DS and DSSO at 10 ppb on chem. L6, CN at 100 ppb on chem. L2 and CEES at 1 ppm on chem. L4) as can be seen
from Figures 1.22 (A) to 1.41 (A). Unfortunately, the static method could not achieve the desired sensitivity of 10
ppb for all the 20 target chemicals. Thus flow experiments were performed to test the ability of the sol-gels to
extract the target analytes by measuring the SERS signal as the sample flowed through a capillary as a function of
time.
For the flow experiments, a syringe pump (Sage model 341B, Thermo Electron, Waltham, MA) was used to flow
the sample (10-50 mL) through the capillary at a rate of 1 mL/min until a signal was observed. SER spectral
collection was initiated when the sample solution entered the capillary and spectra were collected continuously (20
sec/spectrum) for ~5-30 minutes. This was followed by stop-flow measurements (i.e. measure 9 points along the
capillary after flowing the fixed volume of sample). The flow method, in general, allowed measurements in the
range of 1ppm to 10 ppb for few of the target chemicals, (for e.g. CN on chem. L2, DIASH on chem.L3, and DCBP
on chem. L4 at 10 ppb, CEES on chem. L4 at 50 ppb and EMPA on chem. L3 at 1 ppm). See Figures 1.22 (B) to
1.41 (B). Unfortunately, the flow method also did not achieve the desired sensitivity of 10 ppb for all the 20 target
analytes.
14
15. “sf” RTA P2005#84 EPA SBIR Phase II CN: EP-D-06-084 Phase II Final Report May 2010
In an effort to improve sensitivity several variations to the 3 chemistries (L3, L6 and L4) were performed by
changing the ratios of the metal to the alkoxide and by the addition of polymers like polydimethyl siloxane (PDMS)
and polyethylene glycol (PEG). Table 1.4 shows the initial modifications made on chem. L3. NOTE: not all
permutations were tried.
Table 1.4. Initial modifications for making chem.L3 more polar.
Chem Selectivity/Analyte Metal Solution A/ Metal precursor A(µL) B (µL) Solution B/ Sol-gel precursor
Type M Component ratio volume volume Si-Alkoxide ratio
P-C Ag 1N AgNO3/28%NH3OH/MeOH MTMS/ODS/TMOS
5:5:10 5:1:1
L3 non-polar - negative Silver A = 25 + 25 + 50 100 175 B = 125 + 25 + 25 5:1:1
L31 less non-polar – neg. Silver A= 25 + 25 + 50 100 175 B= 125 + 20 + 30
100 175 B= 125 + 15 + 35
100 175 B= 125 + 10 + 40
100 175 B= 125 + 5+ 45
more polar – neg. 100 175 B= 125 + 0+ 50 5:0:2
L32 less non-polar – neg. Silver A= 25 + 25 + 50 100 170 B= 125 + 20 + 25
100 165 B= 125 + 15 + 25
100 160 B= 125 + 10 + 25
100 155 B= 125 + 5+ 25
more polar – neg. 100 150 B= 125 + 0+ 25 5:0:1
Two alkyl phosphonic acids (APA’s), PMPA and EMPA were chosen for preliminary screening with the modified
chem.L3. The preliminary results obtained for PMPA indicate that it is enhanced on the standard non-polar
chem.L3 as opposed to the more polar L.3 chemistries (L.3_PDMS>L3>L32&L31). In contrast, the SERS-response
of EMPA appeared to be improved with these new modified chem. L3 polar subsets (L32>L31>L3). Note:
L3_PDMS = inclusion of 10 microL of PDMS within chemistry L3. (chem.L3_PDMS) provided a static detection
of PMPA in water at 10 ppm, as opposed to 100 ppm for chem.L3.
Similarly, 3 modifications were performed on chem.L6. In the first modification, 0.5% APTMS solution was used
in place of a 1% APTMS. This produced a better signal at 1 ppm, but the thinner coat resulted in less
reproducibility. In the second modification, a 10/1 ratio of 1% APTMS and 1% MTMS was used to make a more
hydrophobic coating. In this case also MPA was only detected at 1 ppm. In the third modification, 1% amino
propyl 3-ethoxysilane (APTES) was used instead of APTMS. This resulted in a more uniform coat and better
reproducibility and MPA was reproducibly detected at 1 ppm to 125 ppb, and sporadically at 100 ppb.
Finally, modifications to chem.L4 were made. This included making the chemistry more non-polar with the
addition of MTMS (6/1 TMOS/MTMS, chem3b), 1/1 TMOS/MTMS (chem3c) and PTMS (1/1 TMOS/PTMS
chem4b_PTMS). CEES, CEMS and 44DCBP were measured on the modified chemistries. The SERS-response is
much weaker on chem3c and chem4b_PTMS with respect to chemL4. Static chemL4 LMC = 10 ppb for 44DCBP
while flowing 10 mL aqueous sample improved the LMC to 100 ppt. These modifications also however did not
allow detection at the required sensitivity for all the 20 target chemicals using the flow method. However, it is
worth pointing out that the standard and modified L1-L6 libraries were used to further test and extensively screen
over 71 additional chemicals in Task 3, spanning a wide range of different classes and subclasses of relevance.
As an alternative method to flow we investigated the use of solid phase extraction (SPE) and ion-exchange (IEX)
techniques as a way to pre-concentrate the sample to achieve the desired sensitivity. SPE is a form of
chromatography designed to extract, partition, and/or adsorb one or more components (sample) from a liquid phase
(sample matrix) onto stationary phase (sorbent). The steps involve 1) conditioning the SPE sorbent with methanol
and water, 2) flowing the sample through the sorbent and 3) eluting the extracted sample with a solvent. As part of
the method development, we experimented with various SPE sorbents (C2, C8 and C18), IEX sorbents (anion
exchange and cation exchange), different flow rates, and eluting solvents (methanol, acetonitrile, dichloromethane
and hexane). These experimental conditions allowed us to develop SPE/IEX methods for all the 20 target analytes.
Table 1.5 lists the different SPE/IEX conditions for all the target chemicals, while Figures 1.22 (C) to 1.42 (C)
shows the SERS of the 20 chemicals at10 ppb obtained using the SPE/IEX pre-concentration method.
15
16. “sf” RTA P2005#84 EPA SBIR Phase II CN: EP-D-06-084 Phase II Final Report May 2010
Table 1.5. SPE/IEX sample pre-concentration conditions for the 20 target chemicals.
Chemical Sorbent Elution Solvent Procedure
CN AEX 0.01M HNO3 Load 50 mL sample at 0.5mL/min, wash sorbent with water, elute with 0.4 mL of 0.01 M
HNO3
CSPS ENVI- MeOH Load 50 mL sample at 1mL/min, wash sorbent with water, elute with 0.2 mL of MeOH
CARB
MPA mixed mode 0.01M HCl in MeOH Load 50 mL sample at 0.5mL/min, wash sorbent with water, elute with 0.4 mL of 0.01M
(C8+AEX) HCl in MeOH
DIASH C8 MeOH Load 50 mL sample at 1mL/min, wash sorbent with water, elute with 0.2 mL of MeOH
EMPA AEX 0.01 M NaCl Load 50 mL sample at 0.5mL/min, wash sorbent with water, elute with 0.3 mL of 0.01 M NaCl
IMPA AEX 0.01 M NaCl Load 50 mL sample at 0.5mL/min, wash sorbent with water, elute with 0.3 mL of 0.01 M NaCl
CMPA AEX 0.01 M NaCl Load 50 mL sample at 0.5mL/min, wash sorbent with water, elute with 0.3 mL of 0.01 M NaCl
PMPA AEX 0.01 M NaCl Load 50 mL sample at 0.5mL/min, wash sorbent with water, elute with 0.3 mL of 0.01 M NaCl
CEES C8 MeOH Load 50 mL sample at 1mL/min, wash sorbent with water, elute with 0.2 mL of MeOH
CEMS C8 MeOH Load 50 mL sample at 1mL/min, wash sorbent with water, elute with 0.2 mL of MeOH
TDG DPA-6S MeOH Load 50 mL sample at 1mL/min, wash sorbent with water, elute with 0.2 mL of MeOH
HEES C8 MeOH Load 50 mL sample at 1mL/min, wash sorbent with water, elute with 0.2 mL of MeOH
CP C18 DCM/MeOH (4:1v/v) Load 50 mL sample at 1mL/min, wash sorbent with water, elute with 0.2 mL of
DCM/MeOH (4:1v/v)
MP C18 DCM/MeOH (4:1v/v) Load 50 mL sample at 1mL/min, wash sorbent with water, elute with 0.2 mL of
DCM/MeOH (4:1v/v)
FON C18 DCM/MeOH (4:1v/v) Load 50 mL sample at 1mL/min, wash sorbent with water, elute with 0.2 mL of
DCM/MeOH (4:1v/v)
DS C8 MeOH Load 50 mL sample at 1mL/min, wash sorbent with water, elute with 0.2 mL of MeOH
DSSO C8 MeOH Load 50 mL sample at 1mL/min, wash sorbent with water, elute with 0.2 mL of MeOH
DCBA C8 MeOH Load 50 mL sample at 1mL/min, wash sorbent with water, elute with 0.2 mL of MeOH
44DCBP C18 MeOH Load 50 mL sample at 1mL/min, wash sorbent with water, elute with 0.2 mL of MeOH
AEX=anion-exchange, MeOH=methanol, C8=silica based reversed-phase packing with monomerically bonded octyl (9%) carbon load, DPA-
6S=polyamide resin with reverse phase retention mechanism, C18= silica based reversed-phase packing with monomerically bonded octadecyl
(18%) carbon load, DCM=dichloromethane.
Figures 1.22 to 1.41 shows the stack plot of the SER spectra of the LMC obtained using the static, flow and the
SPE/IEX methods, respectively.
A
A
B
B
C
C
Fig.1.22. LMC for CN obtained by A) static (100 ppb, Fig.1.23. LMC for CSPS obtained by A) static (10 ppb,
chem.L2), B) flow (10 ppb, chem.L2), and C) SPE (10 chem.L6), B) flow (1000 ppb, chem.L2), and C) SPE (10
ppb, chem.L2). Conditions: as in Fig.1.2. ppb, chem.L3). Conditions: as in Fig.1.2.
16
17. “sf” RTA P2005#84 EPA SBIR Phase II CN: EP-D-06-084 Phase II Final Report May 2010
A A
B B
C C
Fig.1.24. LMC for MPA obtained by A) static (10 ppb, Fig.1.25. LMC for DIASH obtained by A) static (1000 ppb,
chem.L6), B) flow (100 ppb, chem.L3), and C) SPE (1 chem.L3), B) flow (10 ppb, chem.L3), and C) SPE (10 ppb,
ppb, chem.L6). Conditions: as in Fig.1.2. chem.L3). Conditions: as in Fig.1.2.
A A
B
B
C
Fig.1.26. LMC for EMPA obtained by A) static (1000 ppb, Fig.1.27. LMC for IMPA obtained by A) static (100 ppm,
chem.L3), B) flow (1000 ppb, chem.L3), and C) SPE (10 chem.L3), and B) SPE (10 ppb, chem.L3). Conditions: as
ppb, chem.L3). Conditions: as in Fig.1.2. in Fig.1.2. NOTE: No SERS from flowing 1 ppm.
A A
B B
Fig.1.28. LMC for CMPA obtained by A) static (100 ppm, Fig.1.29. LMC for PMPA obtained by A) static (10 ppm,
chem.L3), and B) SPE (10 ppb, chem.L2). Conditions: as in chem.L3_PDMS), and B) SPE (10 ppb, chem.L2).
Fig.1.2. NOTE: No SERS from flowing 1 ppm. Conditions: as in Fig.1.2. NOTE: No SERS from flowing
1 ppm.
17
18. “sf” RTA P2005#84 EPA SBIR Phase II CN: EP-D-06-084 Phase II Final Report May 2010
A A
B B
C C
Fig.1.30. LMC for CEES obtained by A) static (1000 ppb, Fig.1.31. LMC for CEMS obtained by A) static (1000 ppb,
chem.L4), B) flow (50 ppb, chem.L4), and C) SPE (10 ppb, chem.L4), B) flow (500 ppb, chem.L3), and C) SPE (10
chem.L1). Conditions: as in Fig.1.2. ppb, chem.L2). Conditions: as in Fig.1.2.
A A
B B
C C
Fig.1.32. LMC for TDG obtained by A) static (10 ppm, Fig.1.33. LMC for HEES obtained by A) static (100
chem.L1), B) flow (1 ppm, chem.L1), and C) SPE (10 ppm, chem.L3), B) flow (1 ppm, chem.L2), and C) SPE
ppb, chem.L1_PEG). Conditions: as in Fig.1.2. (10 ppb, chem.L6). Conditions: as in Fig.1.2.
A A
B B
C C
Fig.1.34. LMC for CP obtained by A) static (10 ppm, Fig.1.35. LMC for MP obtained by A) static (1 ppm,
chem.L3), B) flow (1 ppm, chem.L3), and C) SPE (10 chem.L6), B) flow (1 ppm, chem.L2), and C) SPE (10 ppb,
ppb, chem.L3). Conditions: as in Fig.1.2. chem.L3). Conditions: as in Fig.1.2.
18
19. “sf” RTA P2005#84 EPA SBIR Phase II CN: EP-D-06-084 Phase II Final Report May 2010
A A
B B
C C
Fig.1.36. LMC for FON obtained by A) static (1 ppm, Fig.1.37. LMC for DS obtained by A) static (100 ppm,
chem.L2), B) flow (500 ppb, chem.L3), and C) SPE (10 chem.L6), B) flow (1 ppm, chem.L3), and C) SPE (10
ppb, chem.L3). Conditions: as in Fig.1.2. ppb, chem.L2). Conditions: as in Fig.1.2.
A A
B
C B
Fig.1.38. LMC for DS-SO obtained by A) static (10 ppb, Fig.1.39. LMC for DMHTP obtained by A) static (1 ppm,
chem.L6), B) flow (1 ppm, chem.L1_PEG), and C) SPE chem.L3), and B) SPE (10 ppb, chem.L3). Conditions: as in
(10 ppb, chem.L6). Conditions: as in Fig.1.2. Fig.1.2.
A A
B B
C C
Fig.1.40. LMC for 3,5-DCBA obtained by A) static (100 ppm, Fig.1.41. LMC for 4,4-DCBP obtained by A) static (10 ppb,
chem.L6), B) flow (1 ppm, v), and C) SPE (10 ppb, chem.L2). chem.L4), B) flow (1 ppb, 4), and C) SPE (10 ppb, chem.L4).
Conditions: as in Fig.1.2. Conditions: as in Fig.1.2.
Task 1 Summary: Chem. L2, L3 and L6 are the universal chemistries for screening of the 20 target chemicals at
nominal concentrations. Polymer modified chemistries provided some selectivity towards a few classes of
chemicals (e.g. L1_PEG was better for pesticides and L2_PEG was better for Blister and Blood agent simulants like
CEES, CEMS, TDG and CN). Although a few chemicals could be detected at 10 ppb using the static or the flow
methods, none of the modifications provided this detection limit for all the 20 target chemicals. To achieve the
desired sensitivity of 10 ppb, SPE or AIEX methods were necessary. SPE sorbents like C8 and C18 provided a
universal pre-concentration method for the purpose of detecting the various chemical, toxic industrial and pesticide
agents of concern, while the AIEX sorbents provide for the pre-concentration of nerve agent hydrolysis products.
In conclusion, all of the 20 target chemicals could be detected at 10 ppb using SPE/AIEX methods with sol-gel
chemistries L2 and L6.
19
20. “sf” RTA P2005#84 EPA SBIR Phase II CN: EP-D-06-084 Phase II Final Report May 2010
Task 2. Develop SER-active capillary durability. The overall objective of this task is to develop the SER-active
capillary fabrication procedure so that modest flow rates, pressure, and temperature can be used for extended periods
of time. This will be accomplished by investigated cure and coating procedures, and performing flow, pressure and
temperature tests.
As part of this task, we performed studies to evaluate the stability and shelf-life of our SER active sol-gels. The
primary issues that must be addressed include determining the optimal conditions (e.g. temperature, time) for curing
specific sol-gel chemistries, under what conditions can the sol-gels (e.g. in capillaries) be reduced and stored with
minimal loss of performance (e.g. 3 months) and their resistance to degradation during sample flow. Preliminary
results have indicated that a constant cure temperature (e.g. cure at 20-25°C for up to 24 hrs) with the sol-gel sensors
properly sealed (to minimize solvent loss and subsequent drying out) is critical.
We performed extensive durability studies on chem.L2, L3, and L6, the three universal chemistries determined
during Task 1.
A. chem.L6 Durability Studies: As described before chem.L6 is an open-tubular chemistry (OTC), where silver
nanoparticles are embedded into a thin Si-alkoxide film functionalized on the internal glass capillary surface. Since
the coating is thin, it was important to know if this open tubular format is durable during continuous water flow and
how frequently the substrates need to be replaced. Hence, to determine the optimum fabrication conditions for
manufacturing durable chem.L6 OTCs we performed the following experiments.
1. The durability of chem.L6 was demonstrated by flowing pure water for one hour (at 1 mL/min) using a
peristaltic pump through such a coated capillary. This was followed by measuring a 0.1 mg/mL sample of
MPA, which exhibited no apparent decrease in the SERS signal as compared to similar pre-flow control
measurements (see Figure 2.1). A similar set of experiments were performed in which HPLC water was flowed
through the standard chem.L6 coated capillaries for 1 and 2 hours prior to the introduction of analyte samples
(at RT, 10 mL/min). After 1 hour of flowing pure water, a 1 ppm sample of MPA in HPLC water was drawn
into this capillary and measured. No MPA signal was detected (see Figure 2.2). To verify if SER-activity was
completely extinguished, a 1000 ppm sample was measured on this same capillary. Again no signal was
observed. Flowing water through capillaries coated with chem.L6 at 10 mL/min eliminates the SERS response.
A A
B B
Fig.2.1. SERS of MPA at 0.1 mg/mL in HPLC water; A) Fig.2.2. SERS of MPA after flowing HPLC water at 10
sample loaded and measured (static) after flowing 50 mL of mL/min for 1 hr on chem.L6A) 1 ppm and B) 1000 ppm.
pure HPLC water at 1 mL/min, and B) sample loaded and Conditions: 80 mW, 785 nm, 1-min.
measured (static) on a different capillary with no prior flowing
of water. Conditions: OTC chem.L6 (APTMS based), 90
mW, 785 nm, 1-min.
2. We examined the shelf-life of chem.L6. Two batches of chem.L6 OTC capillaries (40 each) were made initially
(1 week apart) using the standard procedure. All measurements (here and in Task 5) were performed on
multiple capillaries (and 9 spots for each capillary). This allowed evaluating variations within capillaries,
between capillaries, and batch-to-batch capillaries. For the shelf-life test, a 30-min reduction was applied to the
sol-gel, water removed, and sealed with parafilm. Measurements were made on the first day, and then on the
following 4th and 7th days. In each case, MPA at 1 ppm was used to test the response over time (see Figures
2.3-2.4). The results indicate that 1 ppm can still be detected at the 9 equidistant points along the sol-gel coated
capillary after 7 days. However, the signal appears to start dropping off substantially after 2 days.
20
21. “sf” RTA P2005#84 EPA SBIR Phase II CN: EP-D-06-084 Phase II Final Report May 2010
A
B
C
Fig.2.3. SERS of MPA at 1 ppm on chem.L6, 9-points, which Fig.2.4. SERS of MPA at 1 ppm on chem.L6, for the averaged
was parafilmed and capped for 7 days. Conditions: in water, 9-point spectra: aged A) 1 (red), B) 4 (black), and C) 7 days
785 nm, 80 mw, 1-min (batch 1). (blue); 785 nm, 80 mw, 1-min (batch 1).
3. We examined the sol-gel curing process as a function of both temperature and time in our continuing effort to
further improve the overall performance (sensitivity, reproducibility and durability) of chem.L6 capillaries.
Initial test were carried out on capillaries prepared as above with the exception that after curing for 24-hrs at
RT, 4 of the chem.L6 capillaries were placed in a preheated oven set at 35 °C. A single capillary was removed
after heating for a period of 10, 30, 60 or 180-min, respectively, which was allowed to cool to room temperature
for 45-min, and then reduced (30-min) by the standard method. In each case, MPA at 1 ppm was used to test
the response. The 9-point averaged SER spectra obtained for each capillary heated for the specified time at 35
°C are presented in Figure 2.5. This experiment was repeated on a different set of 4 capillaries at 50 °C (see
Figure 2.6), and again at 65 °C (see Figure 2.7). These results are summarized in Figure 2.8 where the
intensity of the 759 cm-1 peak (9 points averaged) is plotted for each temperature as a function of time. Two
additional experiments were carried out at 35 °C and 50 °C. In these 2 cases, the capillaries were reduced first
then heated. These results are also shown in Figures 2.9-2.10. Capillaries coated with chem.L6 1) heated for
10-min at 35 °C afforded an improvement in sensitivity by a factor of ~2 times that of the standard RT base-line
response of 1 ppm MPA (this was confirmed in repeat measurements), and 2) extended heating over time
(greater than 10-min) or at elevated temperatures (e.g. 50 °C) diminished the SERS response. It is important to
point out that degradation generated artifacts in the spectra at 65 °C, which greatly enhanced the MPA signal
over time. Although improvements were observed for some higher cure temperatures and periods, the
improvements were not consistent, nor were they substantially better than RT cure. Since the RT conditions
gave consistent results, they were used.
A
Fig.2.5. SERS of MPA at 1 ppm on chem.L6 (9 point
B average), cured at 35 oC for A) 10, B) 30, C) 60, and D) 180-
min. Conditions: in HPLC water, 80 mW, 785 nm, 1-min.
C
D
21
22. “sf” RTA P2005#84 EPA SBIR Phase II CN: EP-D-06-084 Phase II Final Report May 2010
A
A B
B C
C
D
D
Fig.2.6. SERS of MPA at 1 ppm on chem.L6 (9 point
Fig.2.7. SERS of MPA at 1 ppm on chem.L6 (9 point
average), cured at 50 oC for A) 10, B) 30, C) 60, and D) 180-
average), cured at 65 oC for A) 10, B) 30, C) 60, and D) 180-
min. Conditions: in HPLC water, 80 mW, 785 nm, 1-min.
min. Conditions: in HPLC water, 80 mW, 785 nm, 1-min.
0.12
50 C
0.1
35 C
65 C
0.08
Peak Height
35 C Red
0.06 50 C Red
0.04
0.02
0
0 50 100 150 200
Curing time (min)
Fig.2.8. Intensity of the peak at 759 cm-1 (baseline at 720 cm-1 subtracted) of MPA at 1 ppm as a function of curing time on
chem.L6 (9 point average), at different curing temperatures 35 oC, 50 oC, and 65 oC. Conditions: 80 mW, 785 nm, 1-min.
A
A
B
C
B
D
Fig.2.9. SERS of MPA at 1 ppm on chem.L6 (9 point Fig.2.10. SERS of MPA at 1 ppm on chem.L6 (9 point
average), reduced then cured at 35o C for A) 10 and B) average), reduced then cured at 50o C for A) 10, B) 30,
30-min. Conditions: 80 mW, 785 nm, 1-min. C) 60, and D) 180-min. Conditions: 80 mW, 785 nm, 1-
min.
4. In order to determine the operational range of the chem.L6 capillaries, a temperature bath was used to set the
temperature of aqueous samples of MPA, drawn through a capillary and measured. The analyte samples were
measured at 20 and 40 °C (Figure 2.11). The response did not appear affected at 40 °C.
22
23. “sf” RTA P2005#84 EPA SBIR Phase II CN: EP-D-06-084 Phase II Final Report May 2010
A
Fig.2.11. SERS of MPA (static)1 ppm in HPLC water, with
sample at A) 20 °C and B) 40 °C. Conditions: 80 mW, 785
nm, 1-min.
B
5. We continued to evaluate the shelf-life of our standard chem.L6 capillaries by investigating the optimum
storage conditions. Three methods for storing these capillaries were investigated. A) Initially, a 30-min addition
of Ag-colloids was applied to the sol-gel, water removed, and the capillary ends sealed with parafilm. The
results indicate that 1 ppm MPA can still be detected at 9 equidistant points along the sol-gel coated capillary
after 7 days (Figure 2.12), but exhibited no activity after 14 days. B) A similar experiment was also performed,
but in this case water was added to the capillary prior to sealing. The activity is significantly diminished on the
4th day, and completely gone on the 7th day (Figure 2.13). C) A 3rd experiment was carried out where the
APTES coating solution was removed after 24-hr, and then the capillaries sealed. After 7 days, the standard
method for adding the Ag-colloids to the sol-gel coat was followed. SER-activity for MPA at 1 ppm was still
observed (Figure 2.14). It is worth pointing out that the initial chem.L6 vials, which can be prepared and
ready for measurement within 24-hrs, is still capable of detecting 250 ppb MPA even after 4 days of storage
(see Figure 2.15).
A
A
B
B
C
Fig.2.12. SERS of MPA on chem.L6 at 1 ppm after A) 1, B) 4 Fig.2.13. SERS of MPA on chem.L6 at 1 ppm after A) 4, and
and C) 7 days, sealed with no water following Ag-colloid B) 7 days, sealed with water following Ag-colloid addition.
addition. Conditions: HPLC water, 80 mW, 785 nm, 1-min. Conditions: HPLC water, 80 mW, 785 nm, 1-min.
A
B
Fig.2.14. SERS of MPA on chem.L6 at 1 ppm after coating Fig.2.15. SERS of MPA on chem.L6 coated vials at 250 ppb
step, sealed empty for 7 days, then Ag-colloids added, and after 4 days, A) single spot and B) 9 points averaged. Coated
tested at 9 spots. Conditions: HPLC water, 80 mW, 785 nm, 1- with 1% APTES for 24-hr, Ag-colloids added for 1-min, sealed
min. empty, tested 4 days later. Conditions: HPLC water, 80 mW,
785 nm, 1-min.
23
24. “sf” RTA P2005#84 EPA SBIR Phase II CN: EP-D-06-084 Phase II Final Report May 2010
6. Finally, we evaluated the shelf-life of our new chem.L6 vials (Figures 2.16-2.19), which were sent to the ECBC
facilities at Aberdeen for preliminary testing as part of Task 7. Our preliminary results show that if Ag-colloid
solution is added immediately following the APTES coating procedure, then sealed and stored empty, MPA can
be detected at 25 ppb if measured on the first day (Figure 2.17A), at 250 ppb after being stored for 1-2 days
(Figure 2.17B), and at 1 ppm following 7 days of storage (see Figure 2.18). It is worth pointing out that a very
weak signal was observed sporadically for MPA at 1 ppm after 10 days of storage. However, as shown by the
SERS of MPA at 250 ppb (Figure 2.19B) obtained with coated vials stored empty for 7 days, adding the Ag-
colloids prior to making a measurement is the best method for maintaining sensitivity.
A
A
B
B
Fig.2.16. Images of A) standard chem.L1 coated vials (left: Fig.2.17. SERS of MPA on chem.L6 coated vials at A) 25 ppb 1st
Ag-TMOS sol-gel unreduced, right: after reduction) as day and B) 250 ppb 2nd day; after spin coated with 1% APTES for
compared to B) chem.L6 coated vials (left: after APTES 1-min (1400 rpm), then Ag-colloids added for 1-min (spinning at
coating, right: after silver colloids added). 1400 rpm), sealed empty. Conditions: HPLC water, 80 mW, 785
nm, 1-min.
A
B
Fig.2.18. SERS of MPA on chem.L6 coated vials, 1 ppm (on Fig.2.19. SERS of MPA on chem.L6 coated vials at A) 1 ppm
2 spots); after spin coated with 1% APTES for 1-min (1400 and B) 250 ppb; after 1-min spin coating step (1400 rpm),
rpm), then Ag-colloids added for 1-min (spin at 1400 rpm), sealed empty for 7 days, then Ag-colloids added for 1-min
sealed empty for 7 days, and then measured. Conditions: as in (spin at 1400 rpm). Conditions: as in Fig.2.17. Note 889 and
Fig.2.17. 1418 cm-1 peaks indicate degradation of the APTES/colloid.
Summary for the durability studies of chem.L6:
1. The shelf-life of chem.L6 standard capillaries was found to be 1 week, though the signal started to drop off
substantially after 2 days (Figures 2.1-2.3).
2. Capillaries coated with chem.L6 1) heated for 10-min at 35 °C afforded an improvement in sensitivity by a
factor of ~2 times that of the standard RT base-line response, and 2) extended heating over time (greater than
10-min) or at elevated temperatures (e.g. 50 °C) diminished the SERS response. Signal improvements were
observed at further elevated cure temperatures (e.g. 65°C) and extended heating (greater than 60-min) but it also
produced degradation (of sol-gel) generated artifacts in the spectra (Figures 2.5-2.8). Although improvements
were observed for some higher cure temperatures and periods, the improvements were not consistent, nor were
they substantially better than RT cure. Since the RT conditions gave consistent results, they were used.
3. Flowing water through capillaries coated with chem.L6 at 1 mL/min did not affect the SERS response, whereas
at 10 mL/min the response was eliminated (Figures 2.1 and 2.2). However none of these sol-gels became
24
25. “sf” RTA P2005#84 EPA SBIR Phase II CN: EP-D-06-084 Phase II Final Report May 2010
detached.
4. Storing the chem.L6 capillaries without any solvent and sealed with parafilm gave better shelf life 7 days
compared to those stored in water (signal seen after 4 days no signal seen on the 7th day- Figures 2.12-2.13).
5. Initial results suggest that chem.L6 vials, which can be prepared and ready for measurement within 24-hrs, is
capable of detecting 250 ppb MPA even after 4 days of storage (see Figure 2.15).
6. For chem.L6 vials, our preliminary results show that if a Ag-colloid solution is added immediately following
the APTES coating procedure, then sealed and stored empty, MPA can be detected at 25 ppb if measured on the
first day (Figure 2.17A), at 250 ppb after being stored for 1-2 days (Figure 2.17B), and at 1 ppm following 7
days of storage (see Figure 2.18). It is worth pointing out that a very weak signal was observed sporadically for
MPA at 1 ppm after 10 days of storage. However, as shown by the SERS of MPA at 250 ppb (Figures 2.14
and 2.19B) obtained with chem.L6 coated capillaries and vials stored empty, the best way to prolong the life of
chem.L6 substrates is to store the APTEOS functionalized substrates (capillaries and vials) sealed and add silver
colloid prior to making a measurement.
B. chem.L3 Durability Studies:
1. We examined the sol-gel curing process as a function of both temperature and time in our continuing efforts to
improve the overall performance (sensitivity, reproducibility and durability) of sol-gel plugs in “packed”
capillaries filled with chem.L3 and its variations of (e.g. chem.L32). We prepared chem.L3 and chem.L32 filled
capillaries, allowed them to gel over night (24-hrs at RT), and then placed them into a pre-heated oven set
initially at 40 °C for 10-min. Following this, the capillaries were taken out of the oven, allowed to equilibrate to
RT for ~30-min, then reduced by the standard method, and tested for SER-activity (static) with FON at 1 ppm
in HPLC water. In both instances, no SER-activity was observed (see Figure 2.20).
2. In a second set of experiments, we prepared chem.L3 and chem.L32 filled capillaries, and immediately placed
part of them into a pre-heated oven set initially at 26 °C and the rest in a refrigerator, for overnight curing.
Following this, the two different sets of capillaries were taken out, allowed to equilibrate to RT for ~30-min,
then reduced by the standard method, and tested for SER-activity (static) with FON at 1 ppm in HPLC water.
For each case, SER-activity was observed (see Figure 2.21). An important observation was that all of the sol-
gels cured at 26 °C formed “half-filled” capillaries similar to that of chem.2c. Such a capillary format is
generally more reproducible than the standard filled format, but unfortunately is not as amenable to analyte pre-
concentration by the continuous flow method.
A A
B B
Fig.2.20. SERS of FON, on A) chem.L3, and B) chem.L32 Fig.2.21. SERS of FON, on chem.L3 initially cured overnight
after curing 24-hrs at RT, heated at 40 °C for 10-min, in A) oven at 26 °C, and B) refrigerator at 4 °C. Conditions: 1
equilibrated, reduced, and tested. Conditions: 1 ppm in HPLC ppm in HPLC water, 80 mW, 785 nm, 1-min (see Fig.2.20).
water, 80 mW, 785 nm, 1-min.
3. To investigate the durability of the capillaries, experiments were also performed in which HPLC water (at RT)
was flowed continuously at a rate of 5 mL/min using a peristaltic pump through a standard series of reduced
chem2d capillaries for 1, 2 and 5 hours prior to the introduction of an analyte sample (see Figure 2.22). The 3
point averaged “static” spectra of FON (10 ppm in HPLC water) following flow of water for 2-hr (Fig.2.22A)
and 5-hr (Fig.2.22B) are nearly identical.
4. A similar experiment was then carried out on a second set of chem.L3 capillaries, where ordinary tap water was
continuously flowed through the reduced sol-gels (at RT, and 5 mL/min) for 24-hrs. None of these sol-gels
became detached or appeared bleached out. The subsequent addition of a 10 ppm FON sample revealed that
SER-activity was retained after 24-hrs of flowing just water (Fig.2.22C), but the signal was relatively weak.
25