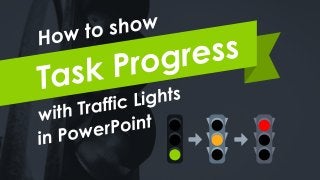
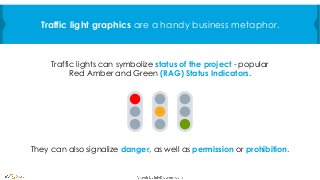
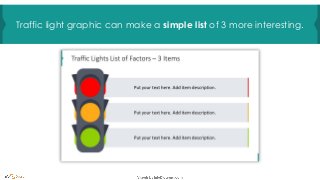
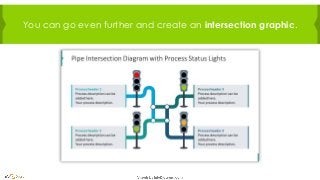
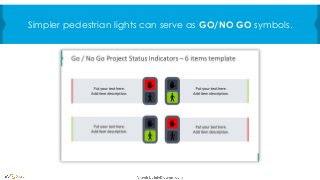
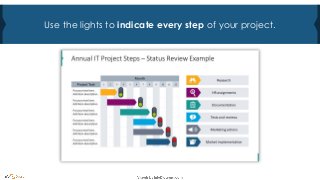
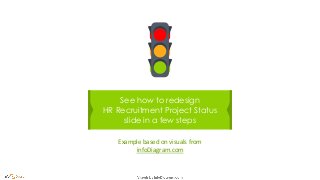
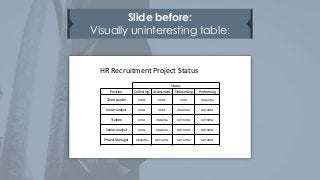
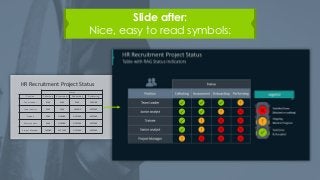
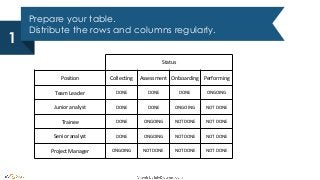
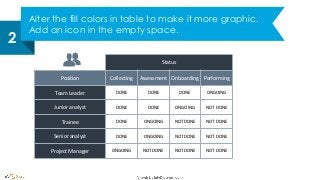
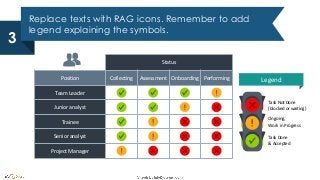
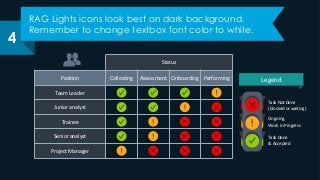
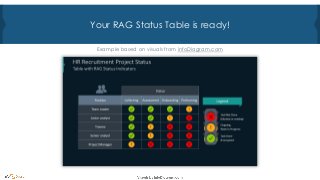
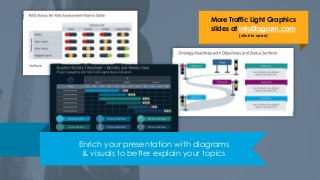
RAG status icons will help you to
transform a boring table into a progress
tracker.
Do you need to show status of your
projects in a legible, but original way?
Traffic lights can symbolize status of the project - popular
Red Amber and Green (RAG) Status Indicators.
Traffic light graphics are a handy business metaphor.
They can also signalize danger, as well as permission or prohibition.
Traffic light graphic can make a simple list of 3 more interesting.
You can go even further and create an intersection graphic.
Simpler pedestrian lights can serve as GO/NO GO symbols.
Use the lights to indicate every step of your project.
See how to redesign
HR Recruitment Project Status
slide in a few steps
Example based on visuals from
infoDiagram.com
Slide before:
Visually uninteresting table:
Status
Position Collecting Assessment Onboarding Performing
Team Leader DONE DONE DONE ONGOING
Junior analyst DONE DONE ONGOING NOT DONE
Trainee DONE ONGOING NOT DONE NOT DONE
Senior analyst DONE ONGOING NOT DONE NOT DONE
Project Manager ONGOING NOT DONE NOT DONE NOT DONE
HR Recruitment Project Status
Slide after:
Nice, easy to read symbols:
Status
Position Collecting Assessment Onboarding Performing
Team Leader DONE DONE DONE ONGOING
Junior analyst DONE DONE ONGOING NOT DONE
Trainee DONE ONGOING NOT DONE NOT DONE
Senior analyst DONE ONGOING NOT DONE NOT DONE
Project Manager ONGOING NOT DONE NOT DONE NOT DONE
HR Recruitment Project Status
Prepare your table.
Distribute the rows and columns regularly.
1
Status
Position Collecting Assessment Onboarding Performing
Team Leader DONE DONE DONE ONGOING
Junior analyst DONE DONE ONGOING NOT DONE
Trainee DONE ONGOING NOT DONE NOT DONE
Senior analyst DONE ONGOING NOT DONE NOT DONE
Project Manager ONGOING NOT DONE NOT DONE NOT DONE
Alter the fill colors in table to make it more graphic.
Add an icon in the empty space.
2
Status
Position Collecting Assessment Onboarding Performing
Team Leader DONE DONE DONE ONGOING
Junior analyst DONE DONE ONGOING NOT DONE
Trainee DONE ONGOING NOT DONE NOT DONE
Senior analyst DONE ONGOING NOT DONE NOT DONE
Project Manager ONGOING NOT DONE NOT DONE NOT DONE
Replace texts with RAG icons. Remember to add
legend explaining the symbols.
3
Status
Position Collecting Assessment Onboarding Performing
Team Leader
Junior analyst
Trainee
Senior analyst
Project Manager
Task Not Done
(blocked or waiting)
Task Done
& Accepted
Ongoing,
Work in Progress
Legend
RAG Lights icons look best on dark background.
Remember to change textbox font color to white.
4
Status
Position Collecting Assessment Onboarding Performing
Team Leader
Junior analyst
Trainee
Senior analyst
Project Manager
Task Not Done
(blocked or waiting)
Task Done
& Accepted
Ongoing,
Work in Progress
Legend
Your RAG Status Table is ready!
Example based on visuals from infoDiagram.com
Enrich your presentation with diagrams
& visuals to better explain your topics
More Traffic Light Graphics
slides at infoDiagram.com
(click to open)
For more presentations,
hit FOLLOW on slideshare.net/infodiagramFollow
More Traffic Light Graphics
slides at infoDiagram.com
(click to open)

How to Show Task Progress with Traffic Lights in PPT

  • 2.
    RAG status iconswill help you to transform a boring table into a progress tracker. Do you need to show status of your projects in a legible, but original way?
  • 3.
    Traffic lights cansymbolize status of the project - popular Red Amber and Green (RAG) Status Indicators. Traffic light graphics are a handy business metaphor. They can also signalize danger, as well as permission or prohibition.
  • 4.
    Traffic light graphiccan make a simple list of 3 more interesting.
  • 5.
    You can goeven further and create an intersection graphic.
  • 6.
    Simpler pedestrian lightscan serve as GO/NO GO symbols.
  • 7.
    Use the lightsto indicate every step of your project.
  • 8.
    See how toredesign HR Recruitment Project Status slide in a few steps Example based on visuals from infoDiagram.com
  • 9.
    Slide before: Visually uninterestingtable: Status Position Collecting Assessment Onboarding Performing Team Leader DONE DONE DONE ONGOING Junior analyst DONE DONE ONGOING NOT DONE Trainee DONE ONGOING NOT DONE NOT DONE Senior analyst DONE ONGOING NOT DONE NOT DONE Project Manager ONGOING NOT DONE NOT DONE NOT DONE HR Recruitment Project Status
  • 10.
    Slide after: Nice, easyto read symbols: Status Position Collecting Assessment Onboarding Performing Team Leader DONE DONE DONE ONGOING Junior analyst DONE DONE ONGOING NOT DONE Trainee DONE ONGOING NOT DONE NOT DONE Senior analyst DONE ONGOING NOT DONE NOT DONE Project Manager ONGOING NOT DONE NOT DONE NOT DONE HR Recruitment Project Status
  • 11.
    Prepare your table. Distributethe rows and columns regularly. 1 Status Position Collecting Assessment Onboarding Performing Team Leader DONE DONE DONE ONGOING Junior analyst DONE DONE ONGOING NOT DONE Trainee DONE ONGOING NOT DONE NOT DONE Senior analyst DONE ONGOING NOT DONE NOT DONE Project Manager ONGOING NOT DONE NOT DONE NOT DONE
  • 12.
    Alter the fillcolors in table to make it more graphic. Add an icon in the empty space. 2 Status Position Collecting Assessment Onboarding Performing Team Leader DONE DONE DONE ONGOING Junior analyst DONE DONE ONGOING NOT DONE Trainee DONE ONGOING NOT DONE NOT DONE Senior analyst DONE ONGOING NOT DONE NOT DONE Project Manager ONGOING NOT DONE NOT DONE NOT DONE
  • 13.
    Replace texts withRAG icons. Remember to add legend explaining the symbols. 3 Status Position Collecting Assessment Onboarding Performing Team Leader Junior analyst Trainee Senior analyst Project Manager Task Not Done (blocked or waiting) Task Done & Accepted Ongoing, Work in Progress Legend
  • 14.
    RAG Lights iconslook best on dark background. Remember to change textbox font color to white. 4 Status Position Collecting Assessment Onboarding Performing Team Leader Junior analyst Trainee Senior analyst Project Manager Task Not Done (blocked or waiting) Task Done & Accepted Ongoing, Work in Progress Legend
  • 15.
    Your RAG StatusTable is ready! Example based on visuals from infoDiagram.com
  • 16.
    Enrich your presentationwith diagrams & visuals to better explain your topics More Traffic Light Graphics slides at infoDiagram.com (click to open)
  • 17.
    For more presentations, hitFOLLOW on slideshare.net/infodiagramFollow More Traffic Light Graphics slides at infoDiagram.com (click to open)