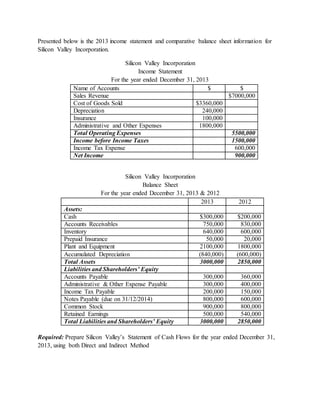
1. Presented below is the 2013 income statement and comparative balance sheet information for
Silicon Valley Incorporation.
Silicon Valley Incorporation
Income Statement
For the year ended December 31, 2013
Name of Accounts $ $
Sales Revenue $7000,000
Cost of Goods Sold $3360,000
Depreciation 240,000
Insurance 100,000
Administrative and Other Expenses 1800,000
Total Operating Expenses 5500,000
Income before Income Taxes 1500,000
Income Tax Expense 600,000
Net Income 900,000
Silicon Valley Incorporation
Balance Sheet
For the year ended December 31, 2013 & 2012
2013 2012
Assets:
Cash $300,000 $200,000
Accounts Receivables 750,000 830,000
Inventory 640,000 600,000
Prepaid Insurance 50,000 20,000
Plant and Equipment 2100,000 1800,000
Accumulated Depreciation (840,000) (600,000)
Total Assets 3000,000 2850,000
Liabilities and Shareholders’ Equity
Accounts Payable 300,000 360,000
Administrative & Other Expense Payable 300,000 400,000
Income Tax Payable 200,000 150,000
Notes Payable (due on 31/12/2014) 800,000 600,000
Common Stock 900,000 800,000
Retained Earnings 500,000 540,000
Total Liabilities and Shareholders’ Equity 3000,000 2850,000
Required: Prepare Silicon Valley’s Statement of Cash Flows for the year ended December 31,
2013, using both Direct and Indirect Method
2. Cash Flows from Operating Activities
Cash Inflows from Operating Activities:
Cash Received from Customers $7,080,000
Total Cash Collection from Operating Activities $7,080,000
Cash outflows through Operating Activities:
Payment to Suppliers $3,460,000
Insurance Paid during the year 130,000
Administrative and Other Expense paid during the
year 1,900,000
Income Taxes Paid during the year 550,000
Total Cash paid through Operating Activities $6,040,000
Net cash flow from Operating Activities $1,040,000
Cash Flows from Investing Activities:
Addition of Plant & Equipment 300,000
Net cash flow from Investing Activities -300,000
Cash flow from Financing Activities
Issue of Notes Payable 200,000
Issue of Common Stock 100,000
Total Cash Inflows from Financing Activities 300,000
Cash outflows through Financing Activities:
Dividend Paid 940,000
Net cash flow through Financing Activities -640,000
Net Changes in Cash during the year $100,000
Add: Cash Balance, beginning $200,000
Cash balance, Ending $300,000
Cash collection from customers
Sales $7,000,000
Add: Accounts Receivable, beginning 830,000
$7,830,000
Less: Accounts Receivable, ending 750,000
Cash Collected from Customers $7,080,000
Purchase During the year ended 2013
Closing Inventory 640,000
Add: Cost of Goods Sold $3,360,000
$4,000,000
Less: Beginning Inventory 600,000
Purchase during the Year $3,400,000
3. Cash Payment to the Suppliers
Purchase during the Year $3,400,000
Add: Accounts Payable, beginning 360,000
$3,760,000
Less: Accounts Payable, ending 300,000
$3,460,000
Administrative & Other Expenses During the year
Administrative & Other Expenses 1,800,000
Add: Admin & other expense payable, beginning 400,000
2,200,000
Less: Admin & other expense payable, ending 300,000
1,900,000
Income Taxes Paid during 2013
Income Tax Expense 600,000
Add: Income Taxes Payable,beginning 150,000
750,000
Less: Income Taxes Payable, ending 200,000
550,000
Dividend Paid during 2013
Retained Earnings, beginning 540,000
Add: Net Profit during the year 900,000
1,440,000
Less: Retained Earnings, ending 500,000
Dividend Paid 940,000
Insurance Paid during 20123
Insurance Expense 100,000
Add: Prepaid Insurance,ending 50,000
150,000
Less: Prepaid Insurance, beginning 20,000
130,000