
Recommended
More Related Content
Similar to Audit Plan 11Running head AUDIT PLANAu.docx
Similar to Audit Plan 11Running head AUDIT PLANAu.docx (20)
More from ikirkton
More from ikirkton (20)
Recently uploaded
Recently uploaded (20)
Audit Plan 11Running head AUDIT PLANAu.docx
- 1. Audit Plan 11 Running head: AUDIT PLAN Audit Plan Introduction In this paper, selects a public accounting company and conduct an audit for the selected company. Public accounting company hired a senior partner to complete an external audit to ensure their stakeholders that the company’s financial statements are prepared according to the GAAP (Generally Accepted Accounting Principles) or IFRS (International Financial Reporting Standards) standards. In this paper, for conduct an external audit selects Hawaiian Airlines, Inc. that is 8th largest commercial airline largest airlines in term of revenues, profitability and market share in the US. Hawaiian Airlines, Inc. is based in Honolulu, Hawaii and it is considered as the number one on-time carrier in the United States in terms of their history of never had a fatal accident with a hull loss. As a senior partner to complete an external audit the financial statements of Hawaiian Airlines, Inc and test the effectiveness of internal control over financial reporting through evaluate the performance ratios. Outline the critical steps inherent in an audit planning and
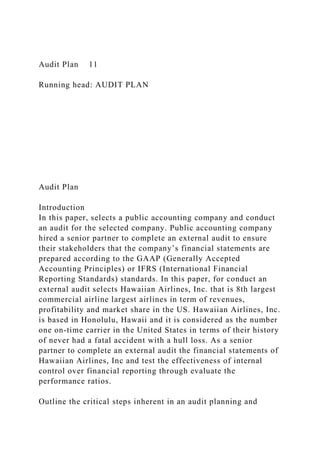
- 2. planning an effective audit program As a senior partner to complete an external audit of the Hawaiian Airlines, Inc, firstly outlines the critical steps related to audit planning that will help to plan an effective audit program. As an external audit partners primary responsibilities are identifies items that causing the financial statements to be materially misstated, execute or design tests to identify whether misstatements have happened, and test the internal control effectiveness over financial reporting thorough use of performance ratio (Thomas & Chizek, 2003). The below diagram is shown the audit planning is a three step process that is underlined by the external auditor, audit committee during evaluated the each audit cycle. International Standards on Auditing (ISA) no.300 has defined three step of the audit planning process, that is described in the below: · Understanding of the entity, its environment and its internal controls system, and information flow process, · Assessing financial reporting or statements risk related to material misstatement · Designing integrated audit processes with the evaluated risk level (Thornton, 2010). These three steps are mentioned in the below diagram of audit plan. (Source: Thornton, 2010) According to the above described the audit process, the senior partner company should undertake performance ratio examine and financial statement analyze actions during planning and designing the audit program. Examine at Least Two Performance Ratios The ratio analysis is used to evaluate the financial performance of a firm in compare to its past performance or competitions performance. Financial ratio indicates the firm ability to utilize the resources that will help to assess and compare financial performance of them over the period. In this audit plan, two performance ratios that is profitability and activity or efficiency
- 3. ratio is selected to find out efficiency of internal control system of Hawaii. The below table indicates the past two years profitability and activity ratio of Hawaiian Airlines, Inc., that indicates the company performance is declined due to the declined of ratio in year 2013 from 2012 (Brigham & Daves, 2009). The profitability ratio of Hawaiian Airlines indicates that the profitability position of it is decreased continuously as all profitability ratios are decreased in year 2013 from 2012. Gross and net profit margin ratios are declined in 2013 from 2012, it indicates Hawaii profit earning capacity also diminished. Earnings per share and return of equity ratios are also reduced that presents the company financial position is not well (Nissim & Penman, 2001). It represents this situation also declined the shareholders value that is not significant of the company to enhance the capital resources as more investors will not invest in the company. Activity or efficiency ratios show the efficiency of Hawaii’s business and management. The company account receivable ratio and account payable ratio is increased in 2013 from 2011 that indicates its efficiency in collecting outstanding sales and payable ability. In addition, declined in turnover ratio indicates the inefficiency of management and business to utilize the resources (Stickney, Weil, Schipper & Francis, 2009). 2013 2012 Profitability Ratios Net profit margin 2.41% 2.71% Gross profit margin 6.20% 6.59%
- 4. Return on equity (ROE) 13.07% 19.82% Earnings per share (EPS) 0.98 1.01 Activity Ratios Net working capital turnover -40.81 -23.95 Asset turnover 1.00 1.05 Fixed asset turnover 1.62 1.84 Average collection period 12.57 15.02 Accounts receivable turnover 29.04 24.30 Accounts payable period 24.01 23.91 Days of cash 0.23 0.24 Three analytical procedures: Analytical procedure is an essential part of the audit process and consists of assessments of financial information through both the financial and non- financial data. The three analytical procedures that would use in this audit are ratio analysis, financial statements analysis and internal control reviews.
- 5. Analyze the Balance Sheet and Income Statement of the Company In this section, financial statements of the Hawaii analyzes through use of common size analysis method. A common-size financial statements are produced to display line items as a percentage on a statement of one common figure that is also shown in the below appendixes. The common size analysis is easy to analyze a firm overtime. In the appendixes tables indicates the common size analysis of the balance sheet and income statement of Hawaii and represents the company expenses has increased in 2013 from 2011 that means the company has not control its operations and other process (Brigham & Daves, 2009). The common figure for an income statement represents as a percent of total sales, while balance sheet common figure indicates as a percent of total assets and total liabilities and shareholders’ equity. In the below appendixes the common size income statement for Hawaii shows that the company spend more than 60% of sales on aircraft fuel, wages and benefits, and maintenance materials and repairs. The common size income statement indicates the company aircraft fuel, wages and benefits, and maintenance materials and repairs expenses also increased in 2013 (61.68%) from 2012 (60.74%). It impacts on the total net income of the company such as the total net income percent of total sales also decreased in 2013 (2.41%) from 2012 (2.71%). It indicates the weakness of the company internal control and management less effectiveness (Drake & Fabozzi, 2012). In addition, common-size balance sheet indicates the company current sales portion on total sales has declined as it is 30.65% in 2012 declined to 27.99% in 2013 and the company property and equipment section increased in 2013 (61.65%) from 2012 (57.28%). Moreover, declined in goodwill in 2012 (4.93%) from 2012 (5.72%) indicates the company has depended on acquisitions for growth. At the same time, declined in short- term and long-term liabilities percent of total liabilities and
- 6. shareholders’ equity in 2013 from 2012 indicates the company is dependent on the markets to refinance debt while it comes due (Stickney, Weil, Schipper & Francis, 2009). Audit Risk Model The sampling technique would use as the audit risk model to support the preliminary judgment about materiality. The sampling technique is widely adopted method of auditing because it provides the option for the auditor to get the minimum audit evidence that is appropriate to form valid conclusions on the preliminary judgment materials (Whittington & Delaney, 2011). This technique is widely used to reduce the risk of over auditing at the audit review stage. The Primary Responsibilities of the Audit Firm The primary responsibility of the audit firm is to ensure audit’s is done right and with integrity. In the case of end result is an unqualified audit report, the audit firm responsibility is to detect fraud or misstated financial reporting or information and after find the issues or fraud report in question in the final audit report (Thornton, 2010). References Brigham, E.F. & Daves, P.R. (2009). Intermediate Financial Management (10th ed.). USA: Cengage Learning. Drake, P.P. & Fabozzi, F.J. (2012). Analysis of Financial Statements (3rd ed.). USA: John Wiley & Sons. Nissim, D. & Penman, S.H. (2001). Ratio Analysis and Equity Valuation: From Research to Practice. Review of Accounting Studies, 6, 109–154. Stickney, C.P., Weil, R.L., Schipper, K. & Francis, J. (2009). Financial Accounting: An Introduction to Concepts, Methods, and Uses (13th ed.). Canada: Cengage Learning. Thomas, E.M. & Chizek, C. (2003). The Seven-step Process to Risk-based Auditing. The Institute Of Internal Auditors, 2(4). Thornton, G. (2010). Planning the external audit. Retrieved from: http://www.grantthornton.com/staticfiles/GTCom/Audit/Assuran
- 7. cepublications/Audit%20committee%20guides/ACH- Guides_Planning-External-Audit_WEB.pdf Whittington, O.R. & Delaney, P.R. (2011). Wiley CPA Exam Review 2012, Auditing and Attestation (9th ed.). USA: John Wiley & Sons. Appendixes Hawaiian Holding Inc. Consolidated Statements of Income For the Years Ended December 31, 2013, & 2012 2013 2012 Operating Revenue: Passenger 90.12% 90.05% Others 9.88% 9.95% Total Revenue 100.00% 100.00% Operating Expenses: Aircraft fuel, including taxes and delivery 32.41% 32.19% Wages & benefits 19.83% 19.19% Aircraft rent 5.03%
- 8. 5.03% Maintenance materials and repairs 9.43% 9.35% Aircraft and passenger servicing 5.60% 5.29% Commissions and other selling 5.84% 5.83% Depreciation and amortization 3.85% 4.36% Other rentals and landing fees 3.77% 4.36% Other rentals and landing fees 8.03% 100.00% Lease termination changes Total expenses 93.80% 93.41% Operation Income 6.20% 6.59% Non-operating income (Expenses): Interest expenses and amortization of debt discounts and issues cost -2.34% -2.22% Interest income
- 9. 0.03% 0.03% Capitalized interest 0.59% 0.54% Losses on fuel derivatives -0.25% -0.58% Gains on Investments Other, net -0.22% 0.01% Total -2.20% -2.22% Income before income taxes 4.01% 4.37% Income tax expense 1.60% 1.66% Net income (loss) 2.41% 2.71% Net income (loss) Per Common Stock Share: Basic 1.00 1.04 Diluted 0.98 1.01 Weighted Average Number of Common Stock Share
- 10. Outstanding: Basic 52099 51314 Diluted 53155 52535 Hawaiian Holding Inc. Consolidated Balance Sheets For the Years Ended December 31, 2013, & 2012 2013 2012 ASSETS Current Assets: Cash and cash equivalent 19.56% 21.75% Restricted cash 0.90% 0.27% Total Cash, Cash equivalent and Restricted Cash 20.46% 22.02% Account receivable, net 3.43% 4.33% Spare parts and suppliers, net 0.91%
- 11. 1.48% Deferred tax assets, net 0.80% 0.95% Prepaid expenses and others 2.39% 1.88% Total 27.99% 30.65% Property and equipment, net Flight Equipment 60.06% 53.60% Pre-delivery deposits on flight equipment 8.72% 10.35% Other property and equipment 7.99% 6.71% 77.04% 70.65% Less accumulated depreciation and amortization -15.11% -13.37% Total 61.65% 57.28% Other assets: Long-term prepayments and other 4.25%
- 12. 2.98% Restricted cash 0.07% - Deferred tax assets, net - 1.95% Intangible assets, net 1.11% 1.42% Goodwill 4.93% 5.72% Total assets 100.00% 100.00% LIABILITIES AND SHAREHOLDERS' EQUITY Current Liabilities: Accounts payable 4.15% 4.40% Air traffic liability 18.90% 20.83% Other accrued liabilities 4.51% 4.01% Current maturities of long-term and capital lease obligations 2.87%
- 13. 5.80% Total 30.43% 35.04% Long-term Debt, less discount, and Capital Lease Obligations 34.39% 29.64% Other Liabilities and Deferred Credits Accumulated pension and other postretirement benefit obligations 12.20% 18.89% Other liabilities and deferred credits 2.75% 2.03% Deferred tax liability, net 1.89% - Total 16.84% 20.92% Commitments and Contingent Liabilities Shareholders’ equity: Special preferred stock, $0.01 par value per share Common stock, $0.01 par value per share, 2013 and 2012, respectively
- 14. 0.02% 0.03% Capital in excess of par value 12.47% 14.20% Accumulated income 7.82% 6.29% Accumulated other comprehensive loss, net -1.97% -6.11% Total 18.34% 14.40% Total liabilities and shareholders’ equity 100.00% 100.00%