Cf31537544
•
0 likes•229 views

IJERA (International journal of Engineering Research and Applications) is International online, ... peer reviewed journal. For more detail or submit your article, please visit www.ijera.com

Recommended
More Related Content
Viewers also liked
Viewers also liked (20)
Similar to Cf31537544
Similar to Cf31537544 (20)
Cf31537544
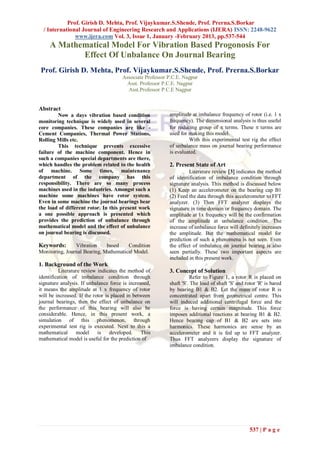
- 1. Prof. Girish D. Mehta, Prof. Vijaykumar.S.Shende, Prof. Prerna.S.Borkar / International Journal of Engineering Research and Applications (IJERA) ISSN: 2248-9622 www.ijera.com Vol. 3, Issue 1, January -February 2013, pp.537-544 A Mathematical Model For Vibration Based Progonosis For Effect Of Unbalance On Journal Bearing Prof. Girish D. Mehta, Prof. Vijaykumar.S.Shende, Prof. Prerna.S.Borkar Associate Professor P.C.E. Nagpur Asst. Professor P.C.E. Nagpur Asst.Professor P.C.E Nagpur Abstract Now a days vibration based condition amplitude at imbalance frequency of rotor (i.e. 1 x monitoring technique is widely used in several frequency). The dimensional analysis is thus useful core companies. These companies are like - for reducing group of terms. These terms are Cement Companies, Thermal Power Stations, used for making this model. Rolling Mills etc. With this experimental test rig the effect This technique prevents excessive of unbalance mass on journal bearing performance failure of the machine component. Hence in is evaluated. such a companies special departments are there, which handles the problem related to the health 2. Present State of Art of machine. Some times, maintenance Literature review 3 indicates the method department of the company has this of identification of imbalance condition through responsibility. There are so many process signature analysis. This method is discussed below machines used in the industries. Amongst such a (1) Keep an accelerometer on the bearing cap B1 machine some machines have rotor system. (2) Feed the data through this accelerometer to FFT Even in some machine the journal bearings bear analyzer. (3) Then FFT analyzer displays the the load of different rotor. In this present work signature in time domain or frequency domain. The a one possible approach is presented which amplitude at 1x frequency will be the confirmation provides the prediction of unbalance through of the amplitude at unbalance condition. The mathematical model and the effect of unbalance increase of unbalance force will definitely increases on journal bearing is discussed. the amplitude. But the mathematical model for prediction of such a phenomena is not seen. Even Keywords: Vibration based Condition the effect of imbalance on journal bearing is also Monitoring, Journal Bearing, Mathematical Model. seen partially. These two important aspects are included in this present work. 1. Background of the Work Literature review indicates the method of 3. Concept of Solution identification of imbalance condition through Refer to Figure 1, a rotor R is placed on signature analysis. If unbalance force is increased, shaft 'S'. The load of shaft 'S' and rotor 'R' is bared it means the amplitude at 1 x frequency of rotor by bearing B1 & B2. Let the mass of rotor R is will be increased. If the rotor is placed in between concentrated apart from geometrical centre. This journal bearings, then the effect of unbalance on will induced additional centrifugal force and the the performance of this bearing will also be force is having certain magnitude. This force considerable. Hence, in this present work, a imposes additional reactions at bearing B1 & B2. simulation of this phenomenon, through Hence bearing cap of B1 & B2 are sets into experimental test rig is executed. Next to this a harmonics. These harmonics are sense by an mathematical model is developed. This accelerometer and it is fed up to FFT analyzer. mathematical model is useful for the prediction of Thus FFT analyzers display the signature of imbalance condition. 537 | P a g e
- 2. Prof. Girish D. Mehta, Prof. Vijaykumar.S.Shende, Prof. Prerna.S.Borkar / International Journal of Engineering Research and Applications (IJERA) ISSN: 2248-9622 www.ijera.com Vol. 3, Issue 1, January -February 2013, pp.537-544 FFT analyzer F=me2 B1 Rotor 'R' B2 Foundation Foundation Shaft 'S' Figure 1: schematic of a rotor unit placed on two bearings B1 and B2 In the mean time, if the unbalance force is 4. Formulation of Experimental Data Based further increased, this may creates additional load Model on the journal bearings, which in turn increases the Mathematical model is nothing but the amplitude at 1x frequency of rotor. While the algebraic relationship amongst the response increase in load generates additional heat, in the oil variable and independent variable. Here, response of journal bearing if the machine is kept still in variable is called dependant variable. Any operation. Thus increases in heat will be phenomena can be presented mathematically by responsible for decrease in the absolute viscosity knowing the physics involve in it. These (z). Conversely this may affect the performance of mathematical models are of three types 1. Logic the bearing. based 2. Field data based 3. Experimental data based. Some phenomena can be presented by 3.1 Salient Details of the Solution application of basic balances. The simulation of experimental test rig is In certain situations, it is not possible to not a scaled model of any machine. But this shows formulate a mathematical model for complex a general concept which can be applied to any phenomena on the basis of application of the basic machine for the diagnosis purpose. The balances of mechanics. In such situations, it experimental test rig is established by the two becomes inevitable to collect experimental data for rotors placed on two journal bearings. This the process and to utilize the generated experimental test rig is designed and fabricated. experimental data to formulate the generalized Artificial unbalance are created by placing algebraic relationship amongst the various physical addition masses at the rotor in the step of 5gm. quantities involved in the process. Then, Data is gathered for every step like vibration amplitude at 1 x frequency of the rotor, speed of 4.1 Process of Model Formulation the rotor, load torque, time between two spectrum The process of model formulation readings, temperature of bearing body etc. includes the following sequential steps: Conversely dimensional analysis is formed. This data is then useful to form a mathematical model 4.1.1 Process Variables for the prediction of unbalance at 1x frequency of Any physical quantity prevailing in the rotor. process under study is designated as process variable. Process variables are categorized as: 1) Independent variables, 2) Dependent variables and 3) Extraneous variables. The following process variables are identified . 538 | P a g e
- 3. Prof. Girish D. Mehta, Prof. Vijaykumar.S.Shende, Prof. Prerna.S.Borkar / International Journal of Engineering Research and Applications (IJERA) ISSN: 2248-9622 www.ijera.com Vol. 3, Issue 1, January -February 2013, pp.537-544 Table 1 : Type of variable, Name of variable and Designation of variable. Sr.No. Type of variable Name of variable Designation i Dependent Vibration Amplitude Y ii Independent Weight of Rotor 1 W1 iii Independent Weight of Rotor 2 W2 iv Independent Weight of equivalent shaft WS v Independent Mass moment of Inertia of Rotor 1 IR1 vi Independent Mass moment of Inertia of Rotor 2 IR2 vii Independent Mass moment of Inertia of Shaft IS viii Independent Weight of unbalance mass Wum ix Independent Viscosity of oil V x Independent Radial clearance of Bearing RcB xi Independent Length of Bush LB xii Independent Diameter of Bush DB xiii Independent Thickness of Bush tB xiv Independent Density of Bush B1 xv Independent Modulus of Elasticity of Rotor 1 ER1 xvi Independent Modulus of Elasticity of Rotor 2 ER2 xvii Independent Modulus of Elasticity of Shaft ES xviii Independent Modulus of Elasticity of Bearing Cap EBM xix Independent Modulus of Elasticity of Bush EBG xx Independent Equivalent length of Rotor 1 L1 xxi Independent Equivalent length of Rotor 2 L2 xxii Independent Equivalent length of Shaft LS xxiii Independent Second moment of inertia IA xxiv Independent Polar moment of inertia IP xxv Independent Radius of Bearing Cap RB xxvi Independent Width of Bearing Cap WB xxvii Independent Thickness of Bearing Cap TB xxviii Independent Center dist. between the Bearing Bolt CDB xix Independent Material density of bearing cap B2 xxx Independent Speed of rotor N xxxi Independent Load Torque TL xxxii Independent Time T xxxiii Independent Acceleration due to gravity g xxxiv Independent Pressure in the Bearing PB 4.1.2 Reduction of variables – Dimensional L = Ф ((M)a ,(M)b ,(M)c ,(ML2)d ,(ML2)e ,(ML2)f analysis ,(M)g, Dimensional analysis is the best known (ML-1T-1)h ,(L)i ,(L)j ,(L)k ,(L)l ,(ML-3)m -1 -2 n and the most powerful technique of reducing the ,(ML T ) , number of variables and making the experimental (ML-1T-2)o ,(ML-1T-2)p ,(ML-1T-2)q , plan compact without loss of generality or control. (ML-1T-2)r ,(L)s ,(L)t ,(L)u ,(L4)v ,(L4)w Dimensional analysis, basically, helps in deciding ,(L) ,(L)y ,(L)z,(L)a1 , x algebric relationship amongst the various physical (ML-3)a2 ,(T-1)a3 ,(ML+2T-2)a4,(T)a5,(LT- 2 a6 quantities encountered in the process. Using ) ,(ML-1T-2)a7) Buckingham π theorem following dimensional 4.1.3 Plan of Experimentation equation is formed. 1) Test point 2) Test envelop and 3) Test 1. The general equation form of dependent and Sequence independent variables are as follows. Detailed experimental plans are made at MLT Equations - this stage to give speed of testing, minimization of Y = Ф (W1a, W2b, Wsc, IR1d, IR2e, ISf, Wumg, vh, errors, maximization of useful data, and maximum RcBi, LBj, DBk, tBl, B1m, ER1n, ER2o, control of extraneous and outside influence. This ESp, EBMq, EBGr, L1s, L2t, LSu, IAv, Ipw, RBx, detailed planning includes the decisions about 1) WB , TBz, CDBa1, B2a2, Na3, TLa4, y Test envelope: The test envelope is the range in Ta5, ga6, PBa7) which independent variables is to be varied during 2. The MLT form of the above equation is – experimentation. 539 | P a g e
- 4. Prof. Girish D. Mehta, Prof. Vijaykumar.S.Shende, Prof. Prerna.S.Borkar / International Journal of Engineering Research and Applications (IJERA) ISSN: 2248-9622 www.ijera.com Vol. 3, Issue 1, January -February 2013, pp.537-544 2) Test points: Test points are discrete values of an 3) Test sequence: In this work partly reversible independent variable at which experiments are experiments are used. conducted. Following table 2 and 3 shows test envelop while table 4 and 5 shows test point. Table 2 : Test envelop for bearing B1 Sr.No. Values π1 π2 π3 1 Minimum 9.82081E-07 6.39393E-06 9.74914E-07 2 Maximum 9.82081E-07 6.39393E-06 3.89966E-05 Table 3 : Test envelop for bearing B2 Sr.No. Values π1 π2 π3 1 Minimum 9.82081E-07 6.39393E-06 1.07241E-05 2 Maximum 9.82081E-07 6.39393E-06 7.79931E-05 Table 4 List of test point for different π terms of bearing B1 Sr.No. π1 π2 π3 1 9.82081E-07 6.39393E-06 9.74914E-07 2 9.82081E-07 6.39393E-06 2.59977E-06 3 9.82081E-07 6.39393E-06 4.87457E-06 4 9.82081E-07 6.39393E-06 7.79931E-06 5 9.82081E-07 6.39393E-06 1.1374E-05 6 9.82081E-07 6.39393E-06 1.55986E-05 7 9.82081E-07 6.39393E-06 2.04732E-05 8 9.82081E-07 6.39393E-06 2.59977E-05 9 9.82081E-07 6.39393E-06 3.21722E-05 10 9.82081E-07 6.39393E-06 3.89966E-05 Table 5 List of test point for different π terms of bearing B2 Sr.No. π1 π2 π3 1 9.82081E-07 6.39393E-06 1.07241E-05 2 9.82081E-07 6.39393E-06 1.55986E-05 3 9.82081E-07 6.39393E-06 2.11231E-05 4 9.82081E-07 6.39393E-06 2.72976E-05 5 9.82081E-07 6.39393E-06 3.4122E-05 6 9.82081E-07 6.39393E-06 4.15963E-05 7 9.82081E-07 6.39393E-06 4.97206E-05 8 9.82081E-07 6.39393E-06 5.84949E-05 9 9.82081E-07 6.39393E-06 6.7919E-05 10 9.82081E-07 6.39393E-06 7.79931E-05 540 | P a g e
- 5. Prof. Girish D. Mehta, Prof. Vijaykumar.S.Shende, Prof. Prerna.S.Borkar / International Journal of Engineering Research and Applications (IJERA) ISSN: 2248-9622 www.ijera.com Vol. 3, Issue 1, January -February 2013, pp.537-544 4.1.4 Experimental procedure increased in the step of 5 grams, and measured the The total ten readings of vibration amplitude at 1x frequency from vibration spectrum. amplitudes at 1x frequency of rotor of bearing B1 In the same way the procedure is also done for and ten readings of bearing B2 are taken. By bearing B2. While the reading was taken keeping load torque constant the unbalance mass is measurement of bearing body temperature is also change in the step of 5gm. Thus a reading of done for every reading. vibration amplitude at 1x frequency of rotor is noted down in Table 6 and 7. 4.1.5 Measurement of amplitude, temperature The experimental procedure is evaluated like as and speed. under - In this experimentation, the speed of shaft For first reading, a 15 gm mass is placed is measured with the help of tachometer, vibration on rotor R1. Then, keeping accelerometer on amplitude is measured with the help of FFT bearing B1, the vibration spectra is taken. analyzer and the temperature is measured with the Conversely the amplitude at 1x frequency is help of thermocouple. These values are shown in measured. Thus for every reading, the mass is the Table 6 and 7. Table 6: Different values of amplitudes, speed, load torque, time, imbalance mass for ten readings on bearing B1 Y N TL T Wum Sr.No. (mm) (rpm) (N-mm) (sec)(Time) (gm) 1 1.23E-04 1430 6900 120 15 2 1.39E-04 1430 6900 240 20 3 2.56E-04 1430 6900 360 25 4 2.97E-04 1430 6900 480 30 5 3.37E-04 1430 6900 600 35 6 3.90E-04 1430 6900 720 40 7 4.10E-04 1430 6900 840 45 8 4.63E-04 1430 6900 960 50 9 5.03E-04 1430 6900 1080 55 10 6.69E-04 1430 6900 1200 60 Table 7: Different Values of amplitudes, speed, load torque, time, imbalance mass for ten readings on bearing B2 Y N TL T Wum Sr.No. (mm) (rpm) (N-mm) (sec) (gm) 1 1.00E-06 1430 6900 1320 15 2 1.23E-04 1430 6900 1440 20 3 1.39E-04 1430 6900 1560 25 4 1.39E-04 1430 6900 1680 30 5 2.31E-04 1430 6900 1800 35 6 2.56E-04 1430 6900 1920 40 7 2.97E-04 1430 6900 2040 45 8 3.37E-04 1430 6900 2160 50 9 3.90E-04 1430 6900 2280 55 10 4.10E-04 1430 6900 2400 60 541 | P a g e
- 6. Prof. Girish D. Mehta, Prof. Vijaykumar.S.Shende, Prof. Prerna.S.Borkar / International Journal of Engineering Research and Applications (IJERA) ISSN: 2248-9622 www.ijera.com Vol. 3, Issue 1, January -February 2013, pp.537-544 4.6 Calculate different indices of π terms The general form of mathematical model to pertaining prediction of amplitudes of unbalance as under. (Y/RB) = K (π1)a x (π2)b (π3)c .........................(1) Where, K = constant, a, b, c are Indices. The value of different indices of the above equation is found by using regression equation which is as follows. Regression Equations: ∑Y = 10K + a∑A + b∑B + c∑C ∑YA = K ∑A + a∑A2 + b∑AB + c∑AC ∑YB = K ∑B + a∑AB + b∑B2 + c∑BC ∑YC = K ∑C + a∑AC + b∑BC + c∑C2..................... (2) Where y = dependent π term A, B,C are independent π term of π1 π2 π3, n is number of readings. By using above equation and placing the values of different independent and dependent π terms for bearing B1, the following matrix is obtained. - 5.19517 10 - 6.00785276 - 5.19423191 - 4.99425 K 31.21183 = - 6.00785278 36.09429 31.20618 30.00471 x a 26.98493 - 5.19423191 31.20618 26.98005 25.94128 b 26.053221 - 4.99425 30.00471 25.94128 25.18146 c Solving above matrix one can get the The influence of independent π term over values of K, a, b and c for the bearing B1 which is dependent π term depicted in equation 5 & 6 as follows. discussed below. K = 0.923209, a =-0.2778, b =0.8015, c = 0.5339 The model pertaining to B1 : Similarly for Bearing B2 the values of K, a, b, c are In this model π2 term has the highest influence on - dependent variable because the value of index of K = 1, a = 1.4742, b = -2.4821, c = 2.1487 π2 term is greater. Also the value of index of π1 Thus the mathematical model for bearing term is less so one can conclude that the π1 term B1 will be as below: has less influence on dependent variable. [Y/RB]= 0.923209 x (π1)-0.2778 x (π2)0.8015 The model pertaining to B2 : 0.5339 x (π3) --------------------(3) In this model π3 term has the highest influence on Also the mathematical model for bearing dependent variable because the value of index of B2 will be as below : π3 term is greater. Also the value of index of π2 [Y/RB]= 1 x (π1)1.4742 x (π2)-2.4821 x term is less so one can conclude that the π2 term (π3) 2.1487 -------------------------------(4) has less influence on dependent variable. 5. Result and Discussion 2) Discussion about the performance of The experimentation is done on journal bearing: experimental test rig. Following results are During experimentation, the unbalance mass is obtained, which is discussed into two parts (1) attached to the rotor. This unbalance mass is then Discussion about the Mathematical Model for the progressively added in the step of 5gm. Thus Prediction of Unbalance. (2) Discussion about the increased unbalance mass will be produced effect of Unbalance on Journal bearing additional centrifugal force to the rotor. The performance. increase in centrifugal force is thus added to the 1) Discussion about the mathematical model for load bared by the bearing. Now as load is the prediction of unbalance mass: changed and it is thought that this may increase The mathematical model for bearing B1 & B2 are additional heat generation. reproduced here for the sake In this context, the temperature of bearing body of explanation which are detailed in equation 5 & is noted down. This temperature shows 6. increment in its value. Some important points [Y/RB]= 0.923209 x (π1)-0.2778 x (π2)0.8015 x regarding how a unbalance force affect the (π3)0.5339 ...............(5) parameters referred to the journal bearing is [Y/RB]= 1 x (π1)1.4742 x (π2)-2.4821 x (π3)2.1487 discussed through following points by studying .............................(6) the graphs shown below. 542 | P a g e
- 7. Prof. Girish D. Mehta, Prof. Vijaykumar.S.Shende, Prof. Prerna.S.Borkar / International Journal of Engineering Research and Applications (IJERA) ISSN: 2248-9622 www.ijera.com Vol. 3, Issue 1, January -February 2013, pp.537-544 1) With reference to Figure 2. This figure is a graph 3) Figure 8 details about the relation between of unbalance mass versus coefficient of friction. unbalance mass and viscosity of oil. From this From this graph it is quite confirmed that, as the graph it is quite confirmed that. If the imbalance load on journal increases it may in turns increase is increased in the rotor. It may affect the the friction in between journal and bearing. viscosity of oil. 2) Figure 7 gives an idea about, how the change in 4) If unbalance force increases over a period of oil temperature affects the viscosity (z) of the oil. time, then it will affect the viscosity of oil which The probable reason in increasing of temperature will in turn affect the performance of the bearing. is nothing but the increase in friction. Sometime it may lead the bearing towards seizing condition . Unbalance mass Unbalance ass Figure 2 : Unbalance mass versus vibration amplitude Figure 3 : Unbalance mass versus vibration amplitude 25 70 60 20 50 V is c os ity Z W um 40 15 30 10 S eries 1 20 S eries 2 10 5 0 03 03 03 03 03 03 03 03 03 03 0 E- E- E- E- E- E- E- E- E- E- 30 50 60 90 40 60 00 50 10 50 40 40.9 41.19 42.28 43.9 44.6 46.7 47 48.8 49.6 2. 2. 2. 2. 3. 3. 4. 4. 5. 5. T e m pe ra ture t C oiffic ie nt of F ric tion µ 5.3 : Figure 5.4 : Figure 4 : Temperature v/s Viscosity Figure 5 : Coefficient of Friction v/s unbalance mas 25 25 20 20 V is c os ity Z V is c os ity Z 15 15 10 S eries 1 10 S eries 1 5 5 0 03 03 03 03 03 03 03 03 03 03 0 E- E- E- E- E- E- E- E- E- E- 30 50 60 90 40 60 00 50 10 50 40 41.8 42.2 44.4 47.8 49.2 51.4 54 57.6 59 2. 2. 2. 2. 3. 3. 4. 4. 5. 5. C oiffic ie nt of F ric tion µ T oil Figure 5.5 : Figure 6 : Coefficient of friction v/s Viscosity Figure 7 : Temperature v/s Viscosity 543 | P a g e
- 8. Prof. Girish D. Mehta, Prof. Vijaykumar.S.Shende, Prof. Prerna.S.Borkar / International Journal of Engineering Research and Applications (IJERA) ISSN: 2248-9622 www.ijera.com Vol. 3, Issue 1, January -February 2013, pp.537-544 25 20 V is c os ity Z 15 S eries 1 10 S eries 2 5 0 15 20 25 30 35 40 45 50 55 60 W Um Figure 8 : Unbalance mass v/s viscocity z Conclusions In this investigation following some important conclusion are made. 1) As there is increase in unbalance mass, amplitude at 1 x frequency gets increased. 2) For this phenomenon of unbalance the mathematical model for prognosis of amplitude at 1x frequency of rotor is established for the individual bearing. 3) As unbalance mass is increased, this will increases coefficient of friction between journal and oil film. This increase in friction enhances high temperature to the oil. Conversely the viscosity of oil may get changed. If the viscosity of oil changes continuously, then there will be a chance of oil film breakage. Thus bearing may get seize. 4) Hence, if it is observed that the bearing body temperature increases. It means there would be a one possibility of unbalance present in the rotor. References 1. Banwait S.S.- Effect of Misalignment of Thermo hydrodynamic Analysis of Elliptical Journal Bearings. IE (I) Journal, Vol. 81, Oct. 2000, PP 93-101. 2. Sehgal R.- Failure Mode Analysis of Sliding Bearings. IE (I), Vol. 81, Oct 2000, PP 123-129. 3. Wock Victor - Machinery Vibration (Measurement and Analysis)", MacGraw Inc Singapore, 1991, First Edition. 544 | P a g e