Analysis of Regional Enterprises in China's Belt and Road Initiative
•
0 likes•52 views

This document analyzes the business characteristics and performance of regional enterprises in Shaanxi Province, China that are involved in the Belt and Road Initiative. It finds that over half of the 226 sampled enterprises have losses or no profit. Manufacturing contributes the most tax revenue while some industries have low or negative profits. Most enterprises have reasonable asset structures and solvency, though some show insolvency issues. Overall profitability is negative, with Singaporean enterprises being the most profitable. Asset turnover rates indicate generally good operational capabilities. The document concludes by recommending policies to improve foreign capital utilization in Shaanxi under the Belt and Road Initiative.

Recommended
Recommended
More Related Content
What's hot
What's hot (20)
Similar to Analysis of Regional Enterprises in China's Belt and Road Initiative
Similar to Analysis of Regional Enterprises in China's Belt and Road Initiative (20)
More from International Journal of Economics and Financial Research
More from International Journal of Economics and Financial Research (20)
Recently uploaded
Recently uploaded (20)
Analysis of Regional Enterprises in China's Belt and Road Initiative
- 1. International Journal of Economics and Financial Research ISSN(e): 2411-9407, ISSN(p): 2413-8533 Vol. 5, Issue. 2, pp: 43-48, 2019 URL: https://arpgweb.com/journal/journal/5 DOI: https://doi.org/10.32861/ijefr.52.43.48 Academic Research Publishing Group *Corresponding Author 43 Original Research Open Access Analysis of the Business of the Regional Enterprises in the Belt and Road Wang Tao* School of Economics and Manangement,Xidian University, China Li Mengqi School of Economics and Manangement,Xidian University, China Abstract With the increase in China's opening up to the outside world, the implementation of China's “One Belt, One Road” strategy has become more in-depth, and foreign-invested enterprises have an indispensable role in China's economic growth. As the starting point of the Silk Road, with its unique geographical location and important strategic position, Shaanxi will link Shaanxi with the regional enterprises in the Belt and Road, which will improve the utilization rate of foreign capital in Shaanxi Province in the context of the Belt and Road Initiative. The cooperation of countries along the way has important and realistic significance. Based on the data of foreign-invested enterprises in Shaanxi Province in 2017, this paper analyzes the business characteristics and business performance of the regional enterprises in the Belt and Road in Shaanxi. Finally, draw the conclusion of this paper and give the corresponding policy recommendations. Keywords: Belt and road; Regional enterprises; Business characteristics; Business performance. CC BY: Creative Commons Attribution License 4.0 1. Introduction The Silk Road, which was first formed by Zhang Qian to make the Western Regions, is an ancient road from the ancient capital Chang'an (now Xi'an) to the eastern coast of the Western China Sea. It has become an ancient land trade route connecting Asia, Africa and Europe. In September and October 2013, Chinese President Xi Jinping proposed the cooperation initiative for the construction of the “New Silk Road Economic Belt” and the “21st Century Maritime Silk Road”. The “Belt and Road” initiative was launched in 2013. In 2014, it became one of the three national strategies. In 2015, the top-level planning and design was completed. Since 2016, the “Belt and Road” has entered the stage of full implementation. As the starting point of the Silk Road, Shaanxi has fully utilized its own advantages and inherited the spirit of the Silk Road since ancient times. It is committed to cooperation with countries along the Belt and Road, bringing greater development and challenges to the economic development of Shaanxi Province. However, although Shaanxi is the starting point of the Silk Road, there are not many articles to investigate and analyze the operation of the regional enterprises in Shaanxi Province, and it is impossible to understand the operation of the regional enterprises in Shaanxi Province. This paper analyzes the operation status of investment enterprises in Shaanxi, and provides specific analysis of the advantages and disadvantages of different industries and different countries of investment for the regional enterprises in the Belt and Road. In the context of the Belt and Road Initiative, it is of great and practical significance to increase the utilization rate of foreign capital in Shaanxi Province, strengthen cooperation with countries along the Belt and Road, and promote the capital cooperation potential of the Belt and Road Initiative. 2. The Analysis of the Business Characteristics of the Regional Enterprises in the Belt and Road in Shaanxi 2.1. Data Source and Organization The data in this paper are all derived from the relevant data of foreign-invested enterprises in Shaanxi Province in 2017. According to the relevant definitions, the sample data compiled by the Group has a total of 226 enterprises operating in Shaanxi. 2.2. Analysis of Total Profit of Regional Enterprises in the Belt and Road Through the analysis of the data, we found that the total profit between the companies is very different. Among the 226 enterprises invested by Shaanxi, 101 companies have total profits ranging from -1 million yuan to 0, and 51 companies have total profits of between 0 and 1 million yuan.Besides,there are 42 enterprises with total profit of more than 1 million yuan.The above data shows that 226 companies can achieve profitability in general. Specifically, from the perspective of the industry, we can know that among the 15 industries invested by Shaanxi, the first place in total profit is manufacturing, and secondly, the total profit of residential services and other service industries and real estate industry is relatively high. In contrast, the total profit of six industries, including accommodation and catering, and finance, is negative, and the industries with the most losses are agriculture, forestry, animal husbandry, and fisheries.
- 2. International Journal of Economics and Financial Research 44 From the perspective of the source of investment, among the 13 countries invested by Shaanxi, the total profits of Korean and Singaporean investment companies are much higher than the total profits of investment companies in other countries. In terms of the operating conditions in 2017, the total profits of each of the 10 companies invested by New Zealand and Malaysia are negative and in a state of loss. 2.3. Analysis of the Net Profit of the Regional Enterprises in the Belt and Road Among the 226 enterprises invested by Shaanxi, the enterprises with a net profit of between -1 and 0 million yuan have the most, reaching 103. Secondly, there are more enterprises, almost 52 ,with net profit of 0-1 million yuan , and there are 38 enterprises with a total of more than 1 million yuan. Besides, there are a total of 33 enterprises with a net profit of less than -1 million yuan. Specifically, according to the data, the overall profit and loss situation is as follows: Table-2.1. Overall Profit and Loss of the Enterprise Profit and loss situation Number of enterprises Net profit (ten thousand yuan) Profit and loss average (ten thousand yuan) profit 80 697235.2 8715.44 Flat 13 0 0 Loss 133 -52160.5 -392.18 total 226 645074.7 2854.31 Source: Shaanxi Foreign Investment Enterprise in 2017 From the above data, it can be seen that more than half of the enterprises have losses or no profit. The reasons are as follows: (1) In recent years, the economic downturn in the international market (2) Most companies are in the start-up. During the period or transition period, profit is not the main strategic goal. (3) Influenced by the market, strong competition, increased operating costs (4) Problems in the operation of the company itself, no increase in research and development, resulting in operational problems such as operating income. . From the perspective of the industry and the source of investment to analyze the net profit, we can draw conclusions that are almost consistent with the analysis of the total profit. 2.4. Analysis of Total Tax Payment of Regional Enterprises in the Belt and Road Among the 226 enterprises invested by Shaanxi, the enterprises with tax payment of 0-100,000 yuan are the most, accounting for 67, accounting for 29.65%. Secondly, enterprises with tax payment between 100000 yuan and 1 million yuan and 10-100 million yuan are more. There are 50 and 42 respectively. In addition, there are more enterprises with a tax payment of 0, accounting for 21.24%, with 48. Specifically, from the perspective of industry, we can see that the industry that contributes the most to the tax revenue of Shaanxi Province is the manufacturing industry, with a total tax amount of 82,729,900 yuan, accounting for 77.07% of the total tax amount. In contrast, the total amount of tax paid for scientific research, technical services and geological exploration, finance, culture, sports and entertainment, health, social security and social welfare is low, indicating that the operations of these four industries are not very optimism. From the perspective of the source country of investment, we found that from the perspective of total taxation, the total tax payment in Korea and Singapore was 577.45 million yuan and 49.94 million yuan respectively, accounting for 53.75% and 45.68% of the total tax amount respectively. Secondly, Indonesia and New Zealand also contribute a certain amount of taxation. In contrast, Oman, Bangladesh, Saudi Arabia, Thailand, Iran and India all have zero tax payments, which do not contribute to the total tax payment 3. The Performance Analysis of the Regional Enterprises in the Belt and Road in Shaanxi 3.1. Analysis of the Solvency of Regional Enterprises in the Belt and Road For the analysis of corporate solvency, we use the company's asset-liability ratio for research. First, we deal with the data. We exclude 13 companies with zero assets, two companies with negative liabilities, and 28 companies with asset-liability ratios greater than 150%. A total of 183 companies were analyzed. Through the analysis of the data, we can find that among the 183 enterprises invested by Shaanxi, the number of enterprises with asset-liability ratio between 0 and 0.5 is the largest, with a total of 91, indicating that the asset structure of most enterprises is reasonable and their solvency is relatively high. But the number of companies with asset-liability ratio between 0.5 and 1 is 66. These companies have higher asset-liability ratios, asset structure is not very reasonable, and the risk of debt repayment is high. Then there are 21 companies with asset-liability ratio greater than 1. There is a problem of insolvency.
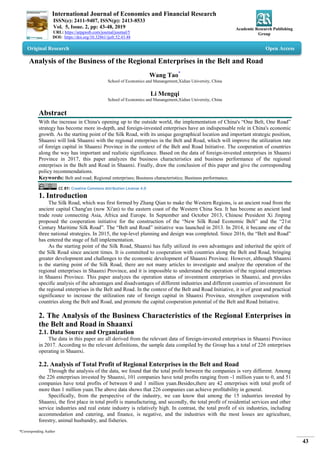
- 3. International Journal of Economics and Financial Research 45 Figure-3.1. Asset and liability ratio of various industries According to Figure 3.1, from the perspective of various industries, the highest asset-liability ratio is scientific research, technical services and geological exploration, which is 1.03, indicating that enterprises in this industry have become insolvent. In addition, the asset-liability ratios of the security and social welfare industries and the accommodation and catering industry were higher at 0.93 and 0.73 respectively, compared with the lower asset- liability ratios of the financial, cultural, sports and entertainment industries, which were 0.04 and 0.08 respectively. These companies have better solvency and low investment risks. Figure-3.2. Asset-liability ratio of each country of origin of investment According to Figure 3.2, we analyze from different investment source countries. It is not difficult to find that among the eight source countries of Shaanxi Investment, the asset-liability ratio of Oman enterprises has reached 1.03, and there are insolvency situations. Philippine, Indonesian, and New Zealand enterprises’s asset-liability ratio is higher than 0.5, indicating that the asset structure of these enterprises is not very good, and the solvency is not very strong. However, the asset-liability ratio of Korean companies and Singaporean companies is controlled at 0.49 and 0.48, and the asset structure is good. Therefore, the asset-liability ratio of 183 companies operating in Shaanxi is controlled at a good level. 3.2. Profitability Analysis of the Belt and Road Regional Enterprises For the analysis of corporate profitability, we use the company's equity net interest rate for research. First, the data is processed. We exclude 12 companies with a shareholder's equity of 0, and exclude 47 companies with negative net profit and owner's equity, 2 companies with ROE>1, and companies with ROE< -1 excluded. At home, a total of 151 companies were analyzed. 0.00 0.20 0.40 0.60 0.80 1.00 1.20 Financial industry Construction industry Agriculture, forestry, animal husbandry… Information transmission, computer… Real estate industry Transportation, warehousing and postal… Accommodation and catering industry Scientific research, technical services and… 0.04 0.08 0.29 0.32 0.34 0.39 0.43 0.43 0.46 0.47 0.51 0.53 0.73 0.93 1.03 Assets and liabilities 0 0.2 0.4 0.6 0.8 1 1.2 Malaysia India Singapore Korea new Zealand Indonesia Philippines Oman 0.16 0.19 0.48 0.49 0.54 0.78 0.83 1.03 Assets and liabilities
- 4. International Journal of Economics and Financial Research 46 Through the analysis of the data, we found that the number of enterprises with a net interest rate between -0.5- 0 and 0-0.5 is the highest, 66 and 64 respectively, and the number of enterprises with a net interest rate of 0.5-1 is 9. The number of companies with 1-0.5 is 12, indicating that more than half of the companies are in a state of loss. Specifically, from the perspective of various industries, the ROE of residential services and other service industries is relatively high, reaching 0.5, indicating that the industry has strong profitability. In addition, the ROE of the four industries of culture, sports and entertainment, wholesale and retail, electricity, gas and water production and supply, and construction is positive, and the ROE of the other seven industries is negative. Overall, the ROE is - 0.01, indicating that the overall business in the Belt and Road region of Shaanxi is a loss. Figure-3.3. Net interest rate of each country of origin of investment According to Figure 3.3, from the perspective of different countries of investment, it is not difficult to find that among the 7 countries of origin, only the ROE value of Singapore enterprises is too high, reaching 0.02, indicating that Singapore enterprises have better profitability and achieved profitability. In addition, the ROE values of companies in other countries are negative, indicating that these companies are in a state of loss. 3.3. Analysis of the Operational Capabilities of the Belt and Road Regional Enterprises For the analysis of the company's operational capabilities, we use the two indicators of total asset turnover rate and current asset turnover rate to conduct research. First, the data is processed. We exclude 13 companies whose total assets are 0. The next discussion on the total asset turnover rate is also treated the same. We excluded 14 companies with a current asset of 0, and the same discussion on the current turnover of liquid assets. Through the analysis of the data, we found that the total number of enterprises with a total asset turnover rate of 0-1 was 86, and the number of companies with a turnover rate of 0 was 43. In general, the total number of enterprises with a total asset turnover ratio of more than 1 is 84, indicating that the overall turnover rate of the total assets is at a relatively high level and the enterprises operating in Shaanxi have better operational capabilities. At the same time, the analysis of current assets turnover rate found that the number of enterprises with a turnover ratio of 0- 1 was the highest, at 71, and the number of enterprises with a turnover rate of 1-2 was 44. It shows that the asset turnover rate of the regional enterprises in the Belt and Road of Shaanxi Investment has indeed remained at a relatively high level, and the operational capacity of the enterprises is relatively good. -0.3 -0.25 -0.2 -0.15 -0.1 -0.05 0 0.05 Singapore Indonesia Korea Malaysia new Zealand India Philippines 0.02 0 0.01 -0.12 -0.12 -0.22 -0.26 ROE
- 5. International Journal of Economics and Financial Research 47 Figure-3.4. Asset turnover ratio of various industries Specifically, according to Figure 3.4, from the perspective of various industries, in terms of total asset turnover, the total asset turnover rate of scientific research, technical services and geological exploration is the highest, reaching 7.85. In addition, the total asset turnover ratio of the catering, information transmission, computer services and software industries, as well as leasing and business services, is greater than the overall average. It shows that the operation of these industries is better, and the operating income generated by the total assets of one yuan is higher, which also shows that the profitability of these industries is strong. At the same time, in terms of current assets turnover rate, the turnover ratio of current assets in each industry is slightly higher than the total asset turnover rate. Among them, the turnover rate of current assets in scientific research, technical services and geological exploration is still the highest, reaching 23.16. In addition, it can be seen from the comparison that in the industries with high total asset turnover, the turnover rate of current assets is also high, and the change between the two shows a high degree of consistency, indicating that the turnover of liquid assets plays a role in the turnover of total assets. The turnover rate of current assets determines the turnover rate of total assets, which plays a decisive role in the company's operational capability and profitability. Figure-3.5. Asset turnover of each country of origin of investment 0.03 0.05 0.11 0.16 0.16 0.26 0.49 0.89 1.32 1.64 1.93 2.59 3.05 4.64 7.85 0.06 0.07 0.11 0.36 0.49 0.64 0.98 1.36 1.55 2.18 2.52 3.41 4.55 4.83 23.16 0 5 10 15 20 25 Total asset turnover Current asset turnover 0 0 0.13 0.14 0.17 0.33 0.71 0.77 0.85 1.41 2.62 15.69 0 0 0.24 0.39 2.49 0.4 0.76 1.27 0.85 1.41 3.08 46.33 0 5 10 15 20 25 30 35 40 45 50 Total asset turnover Current asset turnover
- 6. International Journal of Economics and Financial Research 48 According to Figure 3.5, we further analyze from the perspective of different countries of investment. It is not difficult to find that from the perspective of total asset turnover, the total asset turnover rate of the company as a whole reaches 1.84, indicating that the overall operating level of the company is good. Among them, Oman's total asset turnover rate was the highest at 15.69. Secondly, the total asset turnover rate of Korean companies reached 2.62, indicating that the profitability of total assets of these two countries is relatively high, and the company's operational capacity is strong. From the perspective of current assets turnover rate, the turnover rate of the company's current assets reached 2.42, indicating that the overall operation level of the company is good. Among them, the current assets ratio of Oman enterprises is as high as 46.33. Secondly, the turnover rate of liquid assets of Korean and Philippine enterprises has reached 3.08 and 2.49, indicating that the turnover of liquid assets of these three countries is faster than that of other countries, and their profitability is strong. On the whole, except for the difference between the total asset turnover rate and the current asset turnover rate of Philippine companies, the asset turnover ratios of other countries are relatively consistent. Korean companies and Oman companies have stronger operational capabilities than other countries. Their asset turnover ratio is high and their assets are more profitable. 4. Summary and Policy Recommendations 4.1. Analysis Conclusion By analyzing the business characteristics of the company, we find that the enterprises operating in Shaanxi are generally profitable, but the number of loss-making enterprises is the majority, and the average net profit of the manufacturing industry is the highest, making a huge impact on the overall profit and loss. From the perspective of the source country of investment, the overall profitability of Korean and Singaporean companies is better. At the same time, the total amount of tax paid by enterprises operating in Shaanxi reached 107,348,560 yuan, of which the manufacturing industry contributed the most to tax payment. Besides,through the analysis of the performance of the company, we found that, on the whole, the asset structure of enterprises in Shaanxi Province is relatively reasonable, and the asset-liability ratio is controlled at a relatively reasonable level, but among them, scientific research, technical services and geological exploration’s asset-liability ratio is greater than 1, and there is also an insolvency situation. As far as the net interest rate of equity is concerned, most enterprises are in a state of loss, resulting in a lower net interest rate as a whole, indicating that the profitability of enterprises operating in Shaanxi is not very good, and the labor efficiency of enterprises is not very high. 4.2. Policy Suggestion First, The government should introduce more industries with strong profitability, such as manufacturing, wholesale and retail, construction, etc., while reducing the introduction of industries with poor profitability, such as agriculture, forestry, fisheries, animal husbandry, culture and sports,entertainment or health, social security and social welfare. Secondly, the government should vigorously support cooperation with Korean and Singaporean companies, and focus on introducing cooperation with countries along the Belt and Road, which have not cooperated with the five Central Asian countries, Central and Eastern Europe, and Southern Europe, to deepen the relationship between Shaanxi Province and foreign businessmen.and develop new cooperation areas. In addition, leading enterprises with better business performance and foreign-funded countries, while developing their own advantages, combined with the status quo, to promote the improvement and improvement of disadvantaged parts, such as electricity, gas and water production and supply. Last, the government should pay attention to the introduction of talents in Shaanxi Province and increase the proportion of high-education personnel in enterprises, increase the intensity of enterprises in culture, research and development, innovation, etc., and comprehensively enhance the cultural soft power of enterprises. Bibliography Chen, D., Xie, H. and Wang, B. (2017). The status quo of china's, One belt, One road. Strategy Research Based on CiteSpace Analysis[J].Journal of Hainan Normal University(Natural Science Edition, 30(1): 73-82. Kayalvizhi, P. N. and Thenmozhi, M. (2017). Does quality of innovation, culture and governance drive FDI? Evidence from emerging markets. Emerging Markets Review. Ling, L. and Tao, S. (2017). A review of the, One belt, one road. Strategy Research[J]. Reform and Strategy, 33(1): 49-52. Liu, H. (2017). The security challenges of the, One belt, one road” initiative and china’s choices. J. Croatian International Relations Review, 23(78). Wei, Y. and Liao, F. (2013). The embeddedness of transnational corporations in Chinese cities, Strategic coupling in global production networks? J . Habitat International, 40(3): 82-90.