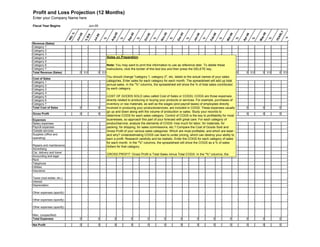
1. Profit and Loss Projection (12 Months)
Enter your Company Name here
Fiscal Year Begins Jun-05
LY
%
-05
6
-05
- 05
- 05
5
6
6
6
6
5
A
5
y-0
AR
n-0
b-0
r-0
n-0
r-0
t-0
l-0
D.
B/
g
v
c
p
%
%
%
%
%
%
%
%
%
%
%
%
Ma
Ma
Oc
Au
No
Ap
YE
IN
De
Se
Fe
Ju
Ju
Ja
%
Revenue (Sales)
Category 1 - - - - - - - - - - - - -
Category 2 - - - - - - - - - - - - -
Category 3 - - - - - - - - - - - - -
Category 4 - - Notes on Preparation-
- - - - - - - - - -
Category 5 - - - - - - - - - - - - -
Category 6 - - Note: You - may want to- print this information to -use as reference later. To delete these
- - - - - - - -
Category 7 - - instructions, click the border of this -text box and then press-the DELETE key.
- - - - - - - - -
Total Revenue (Sales) 0 0.0 0 0.0 0 0.0 0 0.0 0 0.0 0 0.0 0 0.0 0 0.0 0 0.0 0 0.0 0 0.0 0 0.0 0 0.0
You should change "category 1, category 2", etc. labels to the actual names of your sales
Cost of Sales
Category 1 - -
categories. Enter sales for each category for each month. The spreadsheet will add up total
- - - - - - - - - - -
Category 2 - - annual sales. In the "%" columns, the spreadsheet will show the % of total sales contributed
- - - - - - - - - - -
Category 3 - - by each category.
- - - - - - - - - - -
Category 4 - - - - - - - - - - - - -
Category 5 - - COST OF GOODS SOLD (also called Cost of Sales or COGS): COGS -are those expenses
- - - - - - - - - -
Category 6 - - directly related to producing or buying your products or services. For example, purchases of
- - - - - - - - - - -
Category 7 - - inventory or raw materials, as well as the wages (and payroll taxes) of employees directly
- - - - - - - - - - -
Total Cost of Sales 0 - 0 - involved in -producing your products/services, are included in COGS. These expenses usually
0 0 - 0 - 0 - 0 - 0 - 0 - 0 - 0 - 0 - 0 -
go up and down along with the volume of production or sales. Study your records to
Gross Profit 0 - 0 - 0 - 0 - 0 - 0 - 0 - 0 - 0 - 0 - 0 - 0 - 0 -
determine COGS for each sales category. Control of COGS is the key to profitability for most
Expenses businesses, so approach this part of your forecast with great care. For each category of
Salary expenses - - product/service, analyze the elements of COGS: how much for labor, for materials, -for
- - - - - - - - - -
Payroll expenses - - packing, for shipping, for sales commissions, etc.? Compare the Cost of Goods Sold and
- - - - - - - - - - -
Outside services - - Gross Profit of your various sales categories. Which are most profitable, and which -are least -
- - - - - - - - - -
Supplies (office and and why? Underestimating COGS can lead to under pricing, which can destroy your ability to
operating) - - earn a profit. Research- carefully and be realistic. Enter the -
- - - - -
COGS for each category of sales - - - -
for each month. In the "%" columns, the spreadsheet will show the COGS as a % of sales
Repairs and maintenance - - dollars for that category.
- - - - - - - - - - -
Advertising - - - - - - - - - - - - -
Car, delivery and travel - - - - - - - - - - - - -
GROSS PROFIT: Gross Profit is Total Sales minus Total COGS. In the "%" columns, the
Accounting and legal - - - - - - - - - - - - -
Rent - - - - - - - - - - - - -
Telephone - - - - - - - - - - - - -
Utilities - - - - - - - - - - - - -
Insurance - - - - - - - - - - - - -
Taxes (real estate, etc.) - - - - - - - - - - - - -
Interest - - - - - - - - - - - - -
Depreciation - - - - - - - - - - - - -
Other expenses (specify) - - - - - - - - - - - - -
Other expenses (specify) - - - - - - - - - - - - -
Other expenses (specify) - - - - - - - - - - - - -
Misc. (unspecified) - - - - - - - - - - - - -
Total Expenses 0 - 0 - 0 - 0 - 0 - 0 - 0 - 0 - 0 - 0 - 0 - 0 - 0 -
Net Profit 0 - 0 - 0 - 0 - 0 - 0 - 0 - 0 - 0 - 0 - 0 - 0 - 0 -