SlideShare a Scribd company logo
1 of 2
Download to read offline
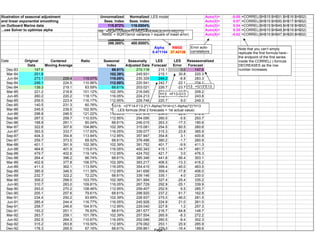
LES modelIllustration of seasonal adjustment Unnormalized Normalized Auto(1)= -0.05 =CORREL($H$15:$H$51,$H$16:$H$52)
and linear exponential smoothing Seas. Index Seas. Index Auto(2)= 0.07 =CORREL($H$15:$H$50,$H$17:$H$52)
on Outboard Marine data 115.872% 116.0504% Auto(3)= 0.04 =CORREL($H$15:$H$49,$H$18:$H$52)
...use Solver to optimize alpha 112.776% 112.9497% Auto(4)= 0.35 =CORREL($H$15:$H$48,$H$19:$H$52)
68.508% 68.6136% Auto(5)= -0.02 =CORREL($H$15:$H$47,$H$20:$H$52)
102.229% 102.3863%
399.385% 400.0000%
Alpha RMSE
0.471154 27.42136
Date Original Centered Ratio Seasonal Seasonally LES LES Reseasonalized
Data Moving Average Index Adjusted Data Forecast Error Forecast
Dec-83 147.6 68.61% 215.118 215.1 0.0 147.6
Mar-84 251.8 102.39% 245.931 215.1 30.8 220.3
Jun-84 273.1 229.4 119.07% 116.05% 235.329 244.2 -8.8 283.3
Sep-84 249.1 224.5 110.96% 112.95% 220.541 242.7 -22.1 274.1
Dec-84 139.3 219.1 63.59% 68.61% 203.021 226.7 -23.7 155.5
Mar-85 221.2 218.8 101.12% 102.39% 216.045 204.4 11.7 209.2
Jun-85 260.2 220.2 118.17% 116.05% 224.213 210.1 14.1 243.8
Sep-85 259.5 223.4 116.17% 112.95% 229.748 220.7 9.0 249.3
Dec-85 140.5 231.3 60.76% 68.61% 204.770 229.7 -24.9 157.6
Mar-86 245.5 239.5 102.50% 102.39% 239.778 208.7 31.1 213.6
Jun-86 298.8 246.5 121.22% 116.05% 257.474 234.9 22.6 272.6
Sep-86 287.0 259.7 110.53% 112.95% 254.095 260.0 -5.9 293.7
Dec-86 168.8 281.1 60.04% 68.61% 246.015 263.3 -17.3 180.6
Mar-87 322.6 307.6 104.86% 102.39% 315.081 254.5 60.5 260.6
Jun-87 393.5 333.7 117.93% 116.05% 339.077 315.3 23.8 365.9
Sep-87 404.3 354.8 113.94% 112.95% 357.947 354.8 3.1 400.8
Dec-87 259.7 373.5 69.52% 68.61% 378.496 380.2 -1.7 260.9
Mar-88 401.1 391.9 102.36% 102.39% 391.752 401.7 -9.9 411.3
Jun-88 464.6 401.9 115.61% 116.05% 400.343 415.1 -14.7 481.7
Sep-88 479.7 402.6 119.14% 112.95% 424.702 421.7 3.0 476.3
Dec-88 264.4 396.2 66.74% 68.61% 385.346 441.8 -56.4 303.1
Mar-89 402.6 377.8 106.57% 102.39% 393.217 406.5 -13.3 416.2
Jun-89 411.3 362.1 113.59% 116.05% 354.415 399.4 -45.0 463.5
Sep-89 385.9 346.5 111.39% 112.95% 341.656 359.4 -17.8 406.0
Dec-89 232.7 322.2 72.22% 68.61% 339.146 335.1 4.0 230.0
Mar-90 309.2 298.0 103.75% 102.39% 301.994 327.4 -25.4 335.2
Jun-90 310.7 283.0 109.81% 116.05% 267.729 292.9 -25.1 339.9
Sep-90 293.0 270.2 108.46% 112.95% 259.407 252.9 6.5 285.7
Dec-90 205.1 257.6 79.61% 68.61% 298.920 237.2 61.7 162.8
Mar-91 234.4 250.2 93.69% 102.39% 228.937 275.0 -46.0 281.5
Jun-91 285.4 244.4 116.77% 116.05% 245.928 224.9 21.0 261.0
Sep-91 258.7 246.6 104.91% 112.95% 229.040 227.8 1.2 257.3
Dec-91 193.2 251.1 76.93% 68.61% 281.577 216.7 64.8 148.7
Mar-92 263.7 259.1 101.78% 102.39% 257.554 265.9 -8.3 272.2
Jun-92 292.5 264.3 110.67% 116.05% 252.046 260.5 -8.4 302.3
Sep-92 315.2 263.8 119.50% 112.95% 279.062 253.1 25.9 285.9
Dec-92 178.3 265.5 67.16% 68.61% 259.861 276.3 -16.4 189.6
G15: =2*F14-F13-2*(1-Alpha)*H14+((1-Alpha)^2)*H13
....LES formula (first 2 forecasts = 1st actual value)
H13: =F13-G13
I13: =G13*E13
Error auto-
correlations
Note that you can't simply
replicate the first formula here--
the endpoint of the first series
inside the CORREL( ) formula
DECREASES as the row
number increases
H9: =SQRT(VAR(H15:H52)+AVERAGE(H15:H52)^2)
…RMSE = SQRT(error variance + square of mean error)
Page 1
LES modelMar-93 274.5 265.4 103.42% 102.39% 268.102 265.3 2.8 271.6
Jun-93 295.4 116.05% 254.545 268.8 -14.2 311.9
Sep-93 311.8 112.95% 276.052 256.8 19.2 290.1
Dec-93 68.61% 273.2 273.2 0.0 187.5
Mar-94 102.39% 275.8 275.8 0.0 282.4
Jun-94 116.05% 278.4 278.4 0.0 323.1
Sep-94 112.95% 280.9 280.9 0.0 317.3
Dec-94 68.61% 283.5 283.5 0.0 194.5
Mar-95 102.39% 286.1 286.1 0.0 292.9
Jun-95 116.05% 288.6 288.6 0.0 335.0
Sep-95 112.95% 291.2 291.2 0.0 328.9
F53: =G53
Bootstrapping begins here:
forecasts substituted for data
Page 2
More Related Content

Viewers also liked

Copy of seasadj.pdf4
Copy of seasadj.pdf4Copy of seasadj.pdf4
Copy of seasadj.pdf4hurt3303
 
ethics plan.pptx v 2.0
ethics plan.pptx v 2.0ethics plan.pptx v 2.0
ethics plan.pptx v 2.0hurt3303
 
bsa aml quantity of risk spreadsheet
bsa aml quantity of risk spreadsheetbsa aml quantity of risk spreadsheet
bsa aml quantity of risk spreadsheethurt3303
 
Outsourcing the Internal Audit Function
Outsourcing the Internal Audit FunctionOutsourcing the Internal Audit Function
Outsourcing the Internal Audit Functionhurt3303
 
healthcare auditing and monitoring tools
healthcare auditing and monitoring toolshealthcare auditing and monitoring tools
healthcare auditing and monitoring toolshurt3303
 
State of the Word 2011
State of the Word 2011State of the Word 2011
State of the Word 2011photomatt
 

Viewers also liked (6)

Copy of seasadj.pdf4
Copy of seasadj.pdf4Copy of seasadj.pdf4
Copy of seasadj.pdf4
 
ethics plan.pptx v 2.0
ethics plan.pptx v 2.0ethics plan.pptx v 2.0
ethics plan.pptx v 2.0
 
bsa aml quantity of risk spreadsheet
bsa aml quantity of risk spreadsheetbsa aml quantity of risk spreadsheet
bsa aml quantity of risk spreadsheet
 
Outsourcing the Internal Audit Function
Outsourcing the Internal Audit FunctionOutsourcing the Internal Audit Function
Outsourcing the Internal Audit Function
 
healthcare auditing and monitoring tools
healthcare auditing and monitoring toolshealthcare auditing and monitoring tools
healthcare auditing and monitoring tools
 
State of the Word 2011
State of the Word 2011State of the Word 2011
State of the Word 2011
 

Similar to Copy of seasadj.pdf3

Okanagan Real Estate Statistics Package - September 2021
Okanagan Real Estate Statistics Package - September 2021Okanagan Real Estate Statistics Package - September 2021
Okanagan Real Estate Statistics Package - September 2021VickyAulakh1
 
Problem 1 (50 points) All Financial Data should only be obtained from.pdf
Problem 1 (50 points) All Financial Data should only be obtained from.pdfProblem 1 (50 points) All Financial Data should only be obtained from.pdf
Problem 1 (50 points) All Financial Data should only be obtained from.pdfarrowcomputers8700
 
10.3 2016 investor presentation pea
10.3 2016 investor presentation   pea10.3 2016 investor presentation   pea
10.3 2016 investor presentation peaFalcoCorporate
 
April 2023 Okanagan Statistics Graphs.pdf
April 2023 Okanagan Statistics Graphs.pdfApril 2023 Okanagan Statistics Graphs.pdf
April 2023 Okanagan Statistics Graphs.pdfVickyAulakh1
 
Okanagan Statistics Reports March 2023
Okanagan Statistics Reports March 2023Okanagan Statistics Reports March 2023
Okanagan Statistics Reports March 2023VickyAulakh1
 
Okanagan Real Estate June 2021 Statistics
Okanagan Real Estate June 2021 Statistics Okanagan Real Estate June 2021 Statistics
Okanagan Real Estate June 2021 Statistics Vicky Aulakh
 
July 2021 Okanagan Statistics
July 2021 Okanagan StatisticsJuly 2021 Okanagan Statistics
July 2021 Okanagan StatisticsVicky Aulakh
 
109年指考各科成績人數百分比累計表
109年指考各科成績人數百分比累計表109年指考各科成績人數百分比累計表
109年指考各科成績人數百分比累計表中 央社
 
106成績人數累計
106成績人數累計106成績人數累計
106成績人數累計中 央社
 
SPX (1990-2012) - Long Straddle, Strangle & Deep OTM
SPX (1990-2012) - Long Straddle, Strangle & Deep OTMSPX (1990-2012) - Long Straddle, Strangle & Deep OTM
SPX (1990-2012) - Long Straddle, Strangle & Deep OTMStefan Bolta
 
The Okanagan Real Estate April 2022 Statistics
The Okanagan Real Estate April 2022 StatisticsThe Okanagan Real Estate April 2022 Statistics
The Okanagan Real Estate April 2022 StatisticsVicky Aulakh
 
Central Okangan Monthly Statistics - February 2023.pdf
Central Okangan Monthly Statistics - February 2023.pdfCentral Okangan Monthly Statistics - February 2023.pdf
Central Okangan Monthly Statistics - February 2023.pdfVickyAulakh1
 
DATA MINING WITH WEKA
DATA MINING WITH WEKADATA MINING WITH WEKA
DATA MINING WITH WEKAShubham Gupta
 
The Okanagan Valley Real Estate Statistics Package September 2021
The Okanagan Valley Real Estate Statistics Package September 2021 The Okanagan Valley Real Estate Statistics Package September 2021
The Okanagan Valley Real Estate Statistics Package September 2021 VickyAulakh1
 
105指考成績人數累計
105指考成績人數累計105指考成績人數累計
105指考成績人數累計中 央社
 
December 2021 The Okanagan Real Estate Statistics Package
December 2021 The Okanagan Real Estate Statistics Package December 2021 The Okanagan Real Estate Statistics Package
December 2021 The Okanagan Real Estate Statistics Package VickyAulakh1
 

Similar to Copy of seasadj.pdf3 (20)

Educational Attainment by Age
Educational Attainment by AgeEducational Attainment by Age
Educational Attainment by Age
 
Amtrust metrics
Amtrust metricsAmtrust metrics
Amtrust metrics
 
Okanagan Real Estate Statistics Package - September 2021
Okanagan Real Estate Statistics Package - September 2021Okanagan Real Estate Statistics Package - September 2021
Okanagan Real Estate Statistics Package - September 2021
 
Problem 1 (50 points) All Financial Data should only be obtained from.pdf
Problem 1 (50 points) All Financial Data should only be obtained from.pdfProblem 1 (50 points) All Financial Data should only be obtained from.pdf
Problem 1 (50 points) All Financial Data should only be obtained from.pdf
 
10.3 2016 investor presentation pea
10.3 2016 investor presentation   pea10.3 2016 investor presentation   pea
10.3 2016 investor presentation pea
 
April 2023 Okanagan Statistics Graphs.pdf
April 2023 Okanagan Statistics Graphs.pdfApril 2023 Okanagan Statistics Graphs.pdf
April 2023 Okanagan Statistics Graphs.pdf
 
Okanagan Statistics Reports March 2023
Okanagan Statistics Reports March 2023Okanagan Statistics Reports March 2023
Okanagan Statistics Reports March 2023
 
Okanagan Real Estate June 2021 Statistics
Okanagan Real Estate June 2021 Statistics Okanagan Real Estate June 2021 Statistics
Okanagan Real Estate June 2021 Statistics
 
July 2021 Okanagan Statistics
July 2021 Okanagan StatisticsJuly 2021 Okanagan Statistics
July 2021 Okanagan Statistics
 
109年指考各科成績人數百分比累計表
109年指考各科成績人數百分比累計表109年指考各科成績人數百分比累計表
109年指考各科成績人數百分比累計表
 
106成績人數累計
106成績人數累計106成績人數累計
106成績人數累計
 
SPX (1990-2012) - Long Straddle, Strangle & Deep OTM
SPX (1990-2012) - Long Straddle, Strangle & Deep OTMSPX (1990-2012) - Long Straddle, Strangle & Deep OTM
SPX (1990-2012) - Long Straddle, Strangle & Deep OTM
 
The Okanagan Real Estate April 2022 Statistics
The Okanagan Real Estate April 2022 StatisticsThe Okanagan Real Estate April 2022 Statistics
The Okanagan Real Estate April 2022 Statistics
 
Central Okangan Monthly Statistics - February 2023.pdf
Central Okangan Monthly Statistics - February 2023.pdfCentral Okangan Monthly Statistics - February 2023.pdf
Central Okangan Monthly Statistics - February 2023.pdf
 
DATA MINING WITH WEKA
DATA MINING WITH WEKADATA MINING WITH WEKA
DATA MINING WITH WEKA
 
NAG_Math
NAG_MathNAG_Math
NAG_Math
 
The Okanagan Valley Real Estate Statistics Package September 2021
The Okanagan Valley Real Estate Statistics Package September 2021 The Okanagan Valley Real Estate Statistics Package September 2021
The Okanagan Valley Real Estate Statistics Package September 2021
 
105指考成績人數累計
105指考成績人數累計105指考成績人數累計
105指考成績人數累計
 
December 2021 The Okanagan Real Estate Statistics Package
December 2021 The Okanagan Real Estate Statistics Package December 2021 The Okanagan Real Estate Statistics Package
December 2021 The Okanagan Real Estate Statistics Package
 
Occupancy Stats
Occupancy StatsOccupancy Stats
Occupancy Stats
 

Copy of seasadj.pdf3

  • 1. LES modelIllustration of seasonal adjustment Unnormalized Normalized Auto(1)= -0.05 =CORREL($H$15:$H$51,$H$16:$H$52) and linear exponential smoothing Seas. Index Seas. Index Auto(2)= 0.07 =CORREL($H$15:$H$50,$H$17:$H$52) on Outboard Marine data 115.872% 116.0504% Auto(3)= 0.04 =CORREL($H$15:$H$49,$H$18:$H$52) ...use Solver to optimize alpha 112.776% 112.9497% Auto(4)= 0.35 =CORREL($H$15:$H$48,$H$19:$H$52) 68.508% 68.6136% Auto(5)= -0.02 =CORREL($H$15:$H$47,$H$20:$H$52) 102.229% 102.3863% 399.385% 400.0000% Alpha RMSE 0.471154 27.42136 Date Original Centered Ratio Seasonal Seasonally LES LES Reseasonalized Data Moving Average Index Adjusted Data Forecast Error Forecast Dec-83 147.6 68.61% 215.118 215.1 0.0 147.6 Mar-84 251.8 102.39% 245.931 215.1 30.8 220.3 Jun-84 273.1 229.4 119.07% 116.05% 235.329 244.2 -8.8 283.3 Sep-84 249.1 224.5 110.96% 112.95% 220.541 242.7 -22.1 274.1 Dec-84 139.3 219.1 63.59% 68.61% 203.021 226.7 -23.7 155.5 Mar-85 221.2 218.8 101.12% 102.39% 216.045 204.4 11.7 209.2 Jun-85 260.2 220.2 118.17% 116.05% 224.213 210.1 14.1 243.8 Sep-85 259.5 223.4 116.17% 112.95% 229.748 220.7 9.0 249.3 Dec-85 140.5 231.3 60.76% 68.61% 204.770 229.7 -24.9 157.6 Mar-86 245.5 239.5 102.50% 102.39% 239.778 208.7 31.1 213.6 Jun-86 298.8 246.5 121.22% 116.05% 257.474 234.9 22.6 272.6 Sep-86 287.0 259.7 110.53% 112.95% 254.095 260.0 -5.9 293.7 Dec-86 168.8 281.1 60.04% 68.61% 246.015 263.3 -17.3 180.6 Mar-87 322.6 307.6 104.86% 102.39% 315.081 254.5 60.5 260.6 Jun-87 393.5 333.7 117.93% 116.05% 339.077 315.3 23.8 365.9 Sep-87 404.3 354.8 113.94% 112.95% 357.947 354.8 3.1 400.8 Dec-87 259.7 373.5 69.52% 68.61% 378.496 380.2 -1.7 260.9 Mar-88 401.1 391.9 102.36% 102.39% 391.752 401.7 -9.9 411.3 Jun-88 464.6 401.9 115.61% 116.05% 400.343 415.1 -14.7 481.7 Sep-88 479.7 402.6 119.14% 112.95% 424.702 421.7 3.0 476.3 Dec-88 264.4 396.2 66.74% 68.61% 385.346 441.8 -56.4 303.1 Mar-89 402.6 377.8 106.57% 102.39% 393.217 406.5 -13.3 416.2 Jun-89 411.3 362.1 113.59% 116.05% 354.415 399.4 -45.0 463.5 Sep-89 385.9 346.5 111.39% 112.95% 341.656 359.4 -17.8 406.0 Dec-89 232.7 322.2 72.22% 68.61% 339.146 335.1 4.0 230.0 Mar-90 309.2 298.0 103.75% 102.39% 301.994 327.4 -25.4 335.2 Jun-90 310.7 283.0 109.81% 116.05% 267.729 292.9 -25.1 339.9 Sep-90 293.0 270.2 108.46% 112.95% 259.407 252.9 6.5 285.7 Dec-90 205.1 257.6 79.61% 68.61% 298.920 237.2 61.7 162.8 Mar-91 234.4 250.2 93.69% 102.39% 228.937 275.0 -46.0 281.5 Jun-91 285.4 244.4 116.77% 116.05% 245.928 224.9 21.0 261.0 Sep-91 258.7 246.6 104.91% 112.95% 229.040 227.8 1.2 257.3 Dec-91 193.2 251.1 76.93% 68.61% 281.577 216.7 64.8 148.7 Mar-92 263.7 259.1 101.78% 102.39% 257.554 265.9 -8.3 272.2 Jun-92 292.5 264.3 110.67% 116.05% 252.046 260.5 -8.4 302.3 Sep-92 315.2 263.8 119.50% 112.95% 279.062 253.1 25.9 285.9 Dec-92 178.3 265.5 67.16% 68.61% 259.861 276.3 -16.4 189.6 G15: =2*F14-F13-2*(1-Alpha)*H14+((1-Alpha)^2)*H13 ....LES formula (first 2 forecasts = 1st actual value) H13: =F13-G13 I13: =G13*E13 Error auto- correlations Note that you can't simply replicate the first formula here-- the endpoint of the first series inside the CORREL( ) formula DECREASES as the row number increases H9: =SQRT(VAR(H15:H52)+AVERAGE(H15:H52)^2) …RMSE = SQRT(error variance + square of mean error) Page 1
  • 2. LES modelMar-93 274.5 265.4 103.42% 102.39% 268.102 265.3 2.8 271.6 Jun-93 295.4 116.05% 254.545 268.8 -14.2 311.9 Sep-93 311.8 112.95% 276.052 256.8 19.2 290.1 Dec-93 68.61% 273.2 273.2 0.0 187.5 Mar-94 102.39% 275.8 275.8 0.0 282.4 Jun-94 116.05% 278.4 278.4 0.0 323.1 Sep-94 112.95% 280.9 280.9 0.0 317.3 Dec-94 68.61% 283.5 283.5 0.0 194.5 Mar-95 102.39% 286.1 286.1 0.0 292.9 Jun-95 116.05% 288.6 288.6 0.0 335.0 Sep-95 112.95% 291.2 291.2 0.0 328.9 F53: =G53 Bootstrapping begins here: forecasts substituted for data Page 2