1. ALN Apartment Data, Inc. www.alndata.com (Continued on next page)
OVERALL MARKET
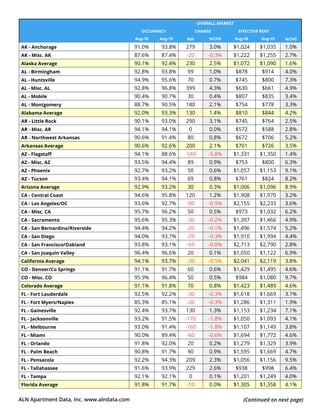
OCCUPANCY CHANGE EFFECTIVE RENT
%CHGAug-18 Aug-19 bps %CHG Aug-18 Aug-19
AK - Anchorage 91.0% 93.8% 279 3.0% $1,024 $1,035 1.0%
AK - Misc. AK 87.6% 87.4% -20 -0.3% $1,222 $1,255 2.7%
Alaska Average 90.1% 92.4% 230 2.5% $1,072 $1,090 1.6%
AL - Birmingham 92.8% 93.8% 99 1.0% $878 $914 4.0%
AL - Huntsville 94.9% 95.6% 70 0.7% $745 $800 7.3%
AL - Misc. AL 92.8% 96.8% 399 4.3% $630 $661 4.9%
AL - Mobile 90.4% 90.7% 30 0.4% $807 $835 3.4%
AL - Montgomery 88.7% 90.5% 180 2.1% $754 $778 3.3%
Alabama Average 92.0% 93.3% 130 1.4% $810 $844 4.2%
AR - Little Rock 90.1% 93.0% 290 3.1% $745 $764 2.5%
AR - Misc. AR 94.1% 94.1% 0 0.0% $572 $588 2.8%
AR - Northwest Arkansas 90.6% 91.4% 80 0.8% $672 $706 5.2%
Arkansas Average 90.6% 92.6% 200 2.1% $701 $726 3.5%
AZ - Flagstaff 94.1% 88.6% -549 -5.8% $1,331 $1,350 1.4%
AZ - Misc. AZ 93.5% 94.4% 89 0.9% $753 $800 6.3%
AZ - Phoenix 92.7% 93.2% 50 0.6% $1,057 $1,153 9.1%
AZ - Tucson 93.4% 94.1% 69 0.8% $761 $824 8.2%
Arizona Average 92.9% 93.2% 30 0.3% $1,006 $1,096 8.9%
CA - Central Coast 94.6% 95.8% 120 1.2% $1,908 $1,970 3.2%
CA - Los Angeles/OC 93.6% 92.7% -90 -0.9% $2,155 $2,233 3.6%
CA - Misc. CA 95.7% 96.2% 50 0.5% $973 $1,032 6.2%
CA - Sacramento 95.6% 95.3% -30 -0.2% $1,397 $1,466 4.9%
CA - San Bernardino/Riverside 94.4% 94.2% -20 -0.1% $1,496 $1,574 5.2%
CA - San Diego 94.0% 93.7% -29 -0.3% $1,910 $1,994 4.4%
CA - San Francisco/Oakland 93.8% 93.1% -69 -0.8% $2,713 $2,790 2.8%
CA - San Joaquin Valley 96.4% 96.6% 20 0.1% $1,050 $1,122 6.9%
California Average 94.1% 93.7% -39 -0.5% $2,041 $2,119 3.8%
CO - Denver/Co Springs 91.1% 91.7% 60 0.6% $1,429 $1,495 4.6%
CO - Misc. CO 95.9% 96.4% 50 0.5% $984 $1,080 9.7%
Colorado Average 91.1% 91.8% 70 0.8% $1,423 $1,489 4.6%
FL - Fort Lauderdale 92.5% 92.2% -30 -0.3% $1,618 $1,669 3.1%
FL - Fort Myers/Naples 85.3% 85.1% -20 -0.3% $1,286 $1,311 1.9%
FL - Gainesville 92.4% 93.7% 130 1.3% $1,153 $1,234 7.1%
FL - Jacksonville 93.2% 91.5% -170 -1.8% $1,050 $1,093 4.1%
FL - Melbourne 93.0% 91.4% -160 -1.8% $1,107 $1,149 3.8%
FL - Miami 90.0% 89.4% -60 -0.6% $1,694 $1,772 4.6%
FL - Orlando 91.8% 92.0% 20 0.2% $1,279 $1,329 3.9%
FL - Palm Beach 90.8% 91.7% 90 0.9% $1,595 $1,669 4.7%
FL - Pensacola 92.2% 94.3% 209 2.3% $1,056 $1,156 9.5%
FL - Tallahassee 91.6% 93.9% 229 2.6% $938 $998 6.4%
FL - Tampa 92.1% 92.1% 0 0.1% $1,201 $1,249 4.0%
Florida Average 91.8% 91.7% -10 0.0% $1,305 $1,358 4.1%
2. ALN Apartment Data, Inc. www.alndata.com(Continued on next page)
OVERALL MARKET
OCCUPANCY CHANGE EFFECTIVE RENT
%CHGAug-18 Aug-19 bps %CHG Aug-18 Aug-19
GA - Albany 92.5% 91.3% -120 -1.3% $674 $707 4.9%
GA - Atlanta 92.0% 92.1% 10 0.1% $1,192 $1,264 6.1%
GA - Augusta 90.2% 91.6% 140 1.5% $826 $877 6.2%
GA - Columbus 94.0% 95.0% 100 1.1% $825 $855 3.7%
GA - Macon 94.3% 93.4% -89 -1.0% $801 $836 4.3%
GA - Savannah 91.0% 92.6% 160 1.8% $1,057 $1,085 2.6%
Georgia Average 92.1% 92.2% 10 0.1% $1,133 $1,197 5.6%
HI - Honolulu 92.4% 95.2% 279 3.0% $1,764 $1,815 2.9%
Hawaii Average 92.4% 95.2% 279 3.0% $1,764 $1,815 2.9%
IA - Des Moines 88.6% 93.2% 460 5.3% $896 $912 1.8%
IA - Misc. IA 98.1% 91.7% -639 -6.5% $779 $809 3.9%
Iowa Average 89.0% 93.1% 410 4.6% $887 $904 2.0%
ID - Boise 95.7% 94.1% -160 -1.7% $1,023 $1,128 10.3%
ID - Misc. ID 93.3% 95.0% 169 1.7% $746 $788 5.7%
Idaho Average 95.6% 94.1% -150 -1.5% $1,006 $1,109 10.3%
IL - Chicago 91.3% 90.5% -80 -0.8% $1,537 $1,602 4.3%
IL - Misc. IL 82.6% 70.5% -1210 -14.7% $643 $628 -2.3%
IL - Moline 95.7% 90.7% -499 -5.2% $745 $785 5.4%
IL - Springfield 90.9% 93.3% 240 2.6% $734 $754 2.7%
Illinois Average 91.0% 90.4% -60 -0.6% $1,439 $1,499 4.2%
IN - Evansville 94.8% 94.6% -20 -0.1% $729 $748 2.5%
IN - Fort Wayne 92.3% 94.9% 259 2.8% $729 $761 4.3%
IN - Indianapolis 92.2% 92.9% 70 0.7% $867 $903 4.2%
IN - Misc. IN 96.9% 97.9% 100 1.0% $751 $757 0.9%
IN - South Bend 93.0% 90.7% -230 -2.4% $833 $866 3.9%
Indiana Average 92.4% 93.0% 60 0.6% $841 $875 4.0%
KS - Misc. KS 93.4% 95.5% 209 2.3% $546 $606 10.9%
KS - Topeka/Manhattan/Lawrence 92.7% 90.8% -190 -2.0% $747 $766 2.5%
KS - Wichita 90.6% 93.1% 250 2.7% $655 $674 2.9%
Kansas Average 91.5% 92.2% 70 0.8% $691 $711 2.9%
KY - Lexington 92.7% 92.8% 10 0.1% $813 $831 2.2%
KY - Louisville 92.6% 89.7% -290 -3.1% $884 $924 4.6%
KY - Misc. KY 95.1% 95.7% 60 0.7% $601 $622 3.5%
Kentucky Average 92.7% 90.8% -190 -2.0% $855 $888 3.9%
LA - Baton Rouge 85.4% 86.8% 140 1.7% $913 $917 0.5%
LA - Lake Charles 90.8% 90.2% -60 -0.6% $1,063 $964 -9.2%
LA - Misc. LA 86.7% 92.4% 570 6.5% $744 $790 6.2%
LA - Monroe 89.2% 90.5% 130 1.5% $748 $758 1.3%
LA - New Orleans 92.9% 91.5% -140 -1.5% $973 $1,022 5.1%
LA - Shreveport 90.6% 90.5% -10 -0.1% $800 $820 2.4%
Louisiana Average 89.1% 89.5% 40 0.5% $918 $936 2.0%
MA - Boston 91.8% 92.8% 100 1.2% $2,200 $2,288 4.0%
3. Preparing for budgets?
When you start diving into
numbers, you’re going to
want a company with the
right methodology, coverage,
depth, pricing options, and
client support.
Nationwide Multifamily Data
www.alndata.com
800-643-6416 ext. 3
Click Here to Learn More
(Continue on for Market Stats)
4. ALN Apartment Data, Inc. www.alndata.com (Continued on next page)
OVERALL MARKET
OCCUPANCY CHANGE EFFECTIVE RENT
%CHGAug-18 Aug-19 bps %CHG Aug-18 Aug-19
MA - Springfield 97.7% 96.7% -100 -1.1% $1,163 $1,191 2.3%
Massachusetts Average 92.0% 93.0% 100 1.1% $2,145 $2,233 4.1%
MD - Baltimore 92.5% 93.6% 110 1.2% $1,324 $1,364 3.1%
MD - Misc. MD 95.7% 96.2% 50 0.4% $1,052 $1,096 4.2%
Maryland Average 92.6% 93.7% 110 1.2% $1,317 $1,359 3.1%
ME - Augusta/Portland 87.2% 89.9% 270 3.2% $1,330 $1,419 6.7%
ME - Misc. ME 97.0% 96.9% -10 -0.1% $759 $820 8.1%
Maine Average 88.1% 90.6% 250 2.9% $1,274 $1,356 6.4%
MI - Detroit 95.5% 94.8% -70 -0.7% $974 $1,019 4.6%
MI - Grand Rapids/Kalamazoo/Battle Creek 94.8% 95.4% 60 0.5% $865 $908 5.0%
MI - Misc. MI 92.5% 92.9% 40 0.4% $803 $851 6.0%
Michigan Average 95.1% 94.7% -40 -0.4% $946 $991 4.8%
MN - Minneapolis - St. Paul 95.3% 95.6% 30 0.4% $1,258 $1,311 4.2%
MN - Misc. MN 94.6% 96.8% 220 2.2% $1,012 $1,017 0.5%
Minnesota Average 95.3% 95.6% 30 0.4% $1,251 $1,303 4.1%
MO - Columbia 93.9% 94.6% 70 0.8% $678 $686 1.1%
MO - Kansas City 91.5% 92.3% 80 0.9% $973 $1,009 3.7%
MO - Misc. MO 92.9% 95.5% 259 2.8% $695 $655 -5.8%
MO - Springfield 93.8% 95.8% 200 2.1% $702 $694 -1.1%
MO - St. Louis 91.5% 91.3% -20 -0.2% $935 $970 3.8%
Missouri Average 91.6% 92.2% 60 0.6% $931 $962 3.4%
MS - Gulfport/Biloxi 93.0% 93.7% 70 0.8% $744 $779 4.7%
MS - Jackson/Central MS 92.7% 93.2% 50 0.5% $823 $855 3.9%
MS - Misc. MS 88.4% 91.0% 260 3.0% $802 $808 0.8%
Mississippi Average 91.7% 92.8% 110 1.2% $797 $824 3.3%
NC - Asheville 90.7% 91.8% 110 1.1% $1,168 $1,186 1.6%
NC - Charlotte 90.5% 91.9% 140 1.5% $1,102 $1,168 6.0%
NC - Fayetteville 92.6% 93.3% 70 0.8% $814 $848 4.2%
NC - Greensboro/Winston-Salem 92.8% 93.3% 50 0.5% $805 $861 7.0%
NC - Misc. NC 83.9% 86.4% 250 2.9% $1,013 $1,090 7.5%
NC - Raleigh-Durham 91.5% 92.4% 90 1.0% $1,085 $1,148 5.8%
NC - Wilmington 91.8% 94.5% 269 2.9% $931 $1,010 8.4%
North Carolina Average 91.3% 92.4% 110 1.3% $1,028 $1,091 6.1%
ND - Bismarck 94.8% 95.4% 60 0.6% $932 $963 3.3%
ND - Fargo 89.3% 96.4% 709 8.0% $783 $794 1.4%
ND - Misc. ND 92.9% 92.9% 0 0.0% $969 $1,068 10.3%
North Dakota Average 91.7% 94.7% 299 3.3% $873 $918 5.1%
NE - Lincoln 96.6% 94.7% -190 -1.9% $846 $863 2.0%
NE - Misc. NE 88.6% 99.0% 1039 11.8% $722 $722 0.1%
NE - Omaha 93.6% 92.7% -90 -0.9% $916 $941 2.8%
Nebraska Average 92.6% 93.2% 60 0.6% $896 $920 2.7%
NM - Albuquerque 93.7% 95.1% 139 1.5% $848 $907 7.0%
5. ALN Apartment Data, Inc. www.alndata.com (Continued on next page)
OVERALL MARKET
OCCUPANCY CHANGE EFFECTIVE RENT
%CHGAug-18 Aug-19 bps %CHG Aug-18 Aug-19
NM - Misc. NM 93.7% 89.0% -470 -5.0% $948 $1,075 13.4%
New Mexico Average 93.7% 94.7% 99 1.0% $856 $922 7.7%
NV - Las Vegas 93.4% 93.8% 39 0.5% $1,018 $1,111 9.1%
NV - Misc. NV 95.3% 96.9% 160 1.7% $957 $964 0.8%
NV - Reno 92.7% 93.4% 70 0.7% $1,246 $1,307 4.9%
Nevada Average 93.3% 93.7% 40 0.5% $1,053 $1,141 8.3%
NY - Albany 92.9% 95.2% 229 2.4% $1,193 $1,198 0.5%
NY - Buffalo/Rochester/Syracuse 95.0% 95.2% 20 0.2% $975 $1,005 3.1%
NY - Misc. NY 89.3% 90.8% 150 1.7% $1,014 $1,022 0.8%
NY - New York City 92.3% 94.6% 229 2.4% $2,580 $2,650 2.7%
New York Average 91.7% 93.8% 209 2.2% $2,270 $2,331 2.7%
OH - Cincinnati/Dayton 93.5% 95.4% 189 2.0% $892 $937 5.0%
OH - Cleveland/Akron 93.0% 93.0% 0 -0.1% $854 $883 3.5%
OH - Columbus 92.8% 92.5% -30 -0.3% $948 $982 3.6%
OH - Misc. OH 97.8% 96.8% -100 -1.1% $670 $688 2.6%
OH - Toledo 94.2% 95.2% 100 1.0% $712 $730 2.6%
Ohio Average 93.1% 93.6% 50 0.5% $888 $924 4.0%
OK - Misc. OK 91.1% 88.7% -240 -2.6% $646 $652 1.0%
OK - Oklahoma City 88.7% 89.5% 80 0.9% $736 $762 3.6%
OK - Tulsa 91.6% 92.1% 50 0.5% $686 $707 3.1%
Oklahoma Average 89.9% 90.5% 60 0.7% $714 $738 3.4%
OR - Misc. OR 95.9% 88.7% -719 -7.6% $943 $1,060 12.3%
OR - Portland 93.9% 93.9% 0 -0.1% $1,355 $1,398 3.2%
Oregon Average 93.8% 93.7% -9 -0.1% $1,351 $1,394 3.2%
PA - Harrisburg/Lancaster 96.4% 96.6% 20 0.2% $1,058 $1,104 4.4%
PA - Misc. PA 95.5% 93.3% -219 -2.2% $987 $991 0.5%
PA - Philadelphia 94.5% 94.6% 10 0.0% $1,316 $1,366 3.8%
PA - Pittsburgh 91.8% 94.4% 259 2.9% $1,111 $1,145 3.1%
PA - State College/Altoona 94.4% 94.7% 30 0.3% $1,182 $1,200 1.6%
Pennsylvania Average 94.3% 94.7% 40 0.4% $1,250 $1,296 3.7%
RI - Providence 96.2% 97.4% 120 1.2% $1,446 $1,489 3.0%
Rhode Island Average 96.3% 97.4% 110 1.2% $1,450 $1,489 2.7%
SC - Charleston 87.3% 88.4% 110 1.3% $1,188 $1,245 4.8%
SC - Columbia 90.7% 92.9% 220 2.4% $912 $944 3.5%
SC - Greenville-Spartanburg 91.7% 92.4% 70 0.7% $923 $975 5.7%
SC - Misc. SC 96.1% 95.7% -40 -0.5% $727 $721 -0.9%
SC - Myrtle Beach 88.3% 91.9% 360 4.0% $1,007 $1,025 1.8%
South Carolina Average 89.8% 91.1% 130 1.5% $1,009 $1,057 4.8%
SD - Misc. SD 97.4% 93.8% -360 -3.8% $836 $844 0.9%
SD - Rapid City 97.2% 96.9% -30 -0.3% $901 $927 2.8%
SD - Sioux Falls 88.9% 91.2% 230 2.6% $797 $843 5.8%
South Dakota Average 91.7% 92.7% 100 1.0% $825 $861 4.3%
7. ALN Apartment Data, Inc. www.alndata.com
Jackie James
Regional Account Executive
1.800.643.6416 x 253
Jackie@alndata.com
Paige Kitchens, CAS
Regional Account Executive
1.800.643.6416 x 251
Paige@alndata.com
On a monthly basis, ALN surveys all apartment communities in each of the markets that we cover and an average of 92% of these surveys
are successfully completed. The above statistics reflect only Conventional, Midrise, and High-Rise apartment communities. In addition, unless
otherwise noted, these statistics do not include Income Restricted, Student Housing, or Senior Independent Housing. In-depth, property level
research and data is available for all property types (including Senior and Income Restricted) through ALN OnLine, which includes Market and
Effective Rents, Occupancy, Floor Plan & Unit Mix information, Market & Submarket statistics, Market Surveys, Historical Trends & Customizable
Reports. By using ALN OnLine, you are able to see monthly fluctuations in any submarket you need which will greatly enhance your ability to
respond to changes quickly and efficiently.
Laura Reese-Williams, CAS
Executive Vice President
1.800.643.6416 x 205
Laura@alndata.com
Karen Nelsen
Regional Account Executive
1.800.643.6416 x 259
KNelsen@alndata.com
Mark Pennings
Regional Account Executive
1.800.643.6416 x 232
Mark@alndata.com
Susan Stroud, CAS
Vice President of Sales
1.800.643.6416 x 207
SStroud@alndata.com
Disclaimer: All content and information within this review is for informational purposes only. ALN Apartment Data, Inc. makes no representation as to
the accuracy or completeness of any information in this or any other materia posted on its site or found by following any link on its site. The owner will
not be held liable for any losses, injuries, or damages from the display or use of this information. All content and information in this review may be shared
provided a link to the article or page on the ALN website this review originated is included in the shared content.
OVERALL MARKET
OCCUPANCY CHANGE EFFECTIVE RENT
%CHGAug-18 Aug-19 bps %CHG Aug-18 Aug-19
Washington Average 93.0% 94.0% 99 1.0% $1,635 $1,711 4.6%
WI - Green Bay/Appleton/Oshkosh 96.5% 95.6% -90 -0.9% $729 $757 3.8%
WI - Madison 92.6% 95.7% 309 3.3% $1,068 $1,098 2.9%
WI - Milwaukee 93.0% 93.6% 60 0.7% $1,071 $1,115 4.1%
WI - Misc. WI 95.4% 95.8% 40 0.4% $737 $757 2.7%
Wisconsin Average 93.4% 94.6% 119 1.3% $998 $1,035 3.7%
WV - Charleston 97.4% 93.7% -369 -3.8% $883 $909 2.9%
WV - Miscellaneous 95.4% 95.7% 30 0.3% $779 $770 -1.1%
West Virginia Average 96.8% 94.1% -270 -2.8% $861 $879 2.1%
CT - Hartford 94.1% 93.9% -20 -0.2% $1,313 $1,354 3.1%
DC - Washington 93.8% 93.9% 10 0.1% $1,781 $1,846 3.7%
DE - Miscellaneous 96.1% 95.7% -40 -0.4% $1,101 $1,135 3.1%
MT - All of Montana 96.2% 96.8% 60 0.7% $891 $932 4.6%
NH - Concord 98.6% 92.5% -609 -6.2% $1,244 $1,326 6.6%
VT - All of Vermont 99.3% 97.7% -160 -1.7% $1,543 $1,570 1.7%
WY - All of Wyoming 91.4% 94.8% 339 3.7% $874 $951 8.8%
National Average 92.2% 92.7% 50 0.5% $1,301 $1,354 4.1%