crime risk map based on big data
•
1 like•134 views

crime risk analysis by sectors, heat map..

Recommended
Recommended
More Related Content
More from YoungTae (Henry) Huh
More from YoungTae (Henry) Huh (20)
crime risk map based on big data
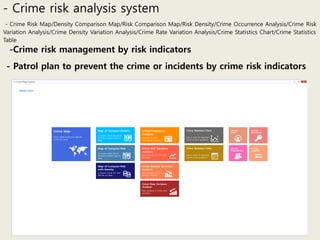
- 1. - Crime risk analysis system - Crime Risk Map/Density Comparison Map/Risk Comparison Map/Risk Density/Crime Occurrence Analysis/Crime Risk Variation Analysis/Crime Density Variation Analysis/Crime Rate Variation Analysis/Crime Statistics Chart/Crime Statistics Table -Crime risk management by risk indicators - Patrol plan to prevent the crime or incidents by crime risk indicators
- 2. Monthly Risk comparison the previous month 1. Crime Risk Map-Risk indicators - Depending on the Crime map risk type, The indicators will change in right-hand site of windows Risk of current time Yearly Risk comparison the previous year
- 3. Comparison Type : 1. Current risk 2. Risk comparison the previous month 3. Risk comparison the previous year Crime or Incident type Average risk Risk Level 0 ~ 10 : 5 levels Current risk of Quadrant Quadrant Name Indicator of Quadrant Current risk level Indicator of current risk comparison average risk Risk trends of 6 month 1. Crime Risk Map – Current risk level - Display current crime risk on the map by Quadrant - Choose a Quadrant of Quadrant List or a Quadrant on map to see the detailed risk Quadrant List Crime map Type 1. Crime risk 2. Crime Density 3. Crime Rate Indicators of risk change comparison the previous month Indicators of risk change comparison the previous year
- 4. Risk change comparison the previous month Indicator of the monthly risk of Quadrant Risk indicators of Quadrant comparison the average risk of month Average risk level by month Indicator of risk level change comparison the previous month Indicator of risk level change comparison the previous year 6 month trends graph Indicator of Monthly risk change Preview & Save Map 1. Crime Risk Map – Risk change comparison the previous month - Display the monthly risk level by Quadrant - Monthly Quadrant Crime risk by the currently, monthly, yearly
- 5. Risk change level comparison the previous year by Quadrant Risk level of the yearly 3 Year risk trends Risk detailed information when you clicks on map 1. Crime Risk Map – Yearly risk level change - Displaying the yearly risk level on Quadrant - Display the detailed crime risk information by selecting the Quadrant on the map
- 6. 2. Crime Density – Crime Density Detailed - 년 / 월 별 특정 Quadrant의 인구수 대비 범죄 발생률 표시 검색 할 최근 년도 수 Crime or Incident type 년 간 범죄 발생 률 월 간 범죄 발생 률
- 7. 2. Crime Density and Risk Comparison – By crimes, incidents type - 범죄 유형 별 Quadrant의 범죄 Density 비교 - 범죄 유형 별 Quadrant의 Risk 비교 Crime Density Comparison Risk Comparison 범죄 카테고리 범죄 유형 별 Current risk of Quadrant Quadrant List
- 8. 3. Crime Frequency Analysis – by time - 시간대 별 범죄 발생 건수 및 발생 비율(%) 표시 검색 년도 선택 Crime or Incident type 하루 / 시간 당 평균 범죄 발생 건수 년 간 범죄 발생 건수 시간 대 별 범죄 발생 비율(%) 범죄 건 수가 가장 많은 시간대와 가장 적은 시간대 시간 별 범죄 발생 건수
- 9. 3. Crime Frequency Analysis – by month, quarter - 월 / 분기 별 범죄 발생 건수 표시 월 별 범죄 발생 건수 Red : 범죄가 가장 많은 Month Blue : 범죄가 가장 적은 Month 분기 별 범죄 발생 비율(%) 및 건수
- 10. 4. Crime Risk and Crime Density Variation Analysis – by sector - 특정 Quadrant의 위험도 변화 률 상세 조회 - 특정 Quadrant의 Density 변화 률 상세 조회 Crime Density Variation Risk Variation Crime or Incident type Current density of Quadrant Quadrant 별 범죄 발생 증감 건수 Quadrant Information Crime density 증감 분석 Red : 범죄가 가장 많이 발생 한 Month Blue : 범죄가 가장 적게 발생 한 Month
- 11. 4. Crime Rate Variation – by population - 특정 Quadrant의 인구 수 대비 범죄 발생률 표시 기간 별 인구수 대비 범죄 발생 변화 률