

Recommended
More Related Content
More from Harshvardhan Pal
Recently uploaded
Recently uploaded (20)
Maruti Suzuki
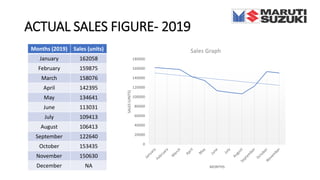
- 1. ACTUAL SALES FIGURE- 2019 Months (2019) Sales (units) January 162058 February 159875 March 158076 April 142395 May 134641 June 113031 July 109413 August 106413 September 122640 October 153435 November 150630 December NA 0 20000 40000 60000 80000 100000 120000 140000 160000 180000 SALES(UNITS) MONTHS Sales Graph
- 2. DEMAND FORECASTING Demand Forecasting is the process in which historical sales data is used to estimate of an expected forecast of customer demand. SIMPLE MOVING AVERAGE METHOD: It is a discrete averaging method where periods in past beyond a certain number are considered irrelevant for the analysis.Months (2019) Sales (units) Demand Forecasting January 162058 NA February 159875 NA March 158076 NA April 142395 160003 May 134641 153449 June 113031 145037 July 109413 130022 August 106413 119028 September 122640 109619 October 153435 112822 November 150630 127496 December NA 142235 0 20000 40000 60000 80000 100000 120000 140000 160000 180000 SALES(UNITS) MONTHS Comparison 3 months average is used to forecast the next months demand