

Recommended
More Related Content
What's hot
What's hot (20)
Viewers also liked
Viewers also liked (9)
Similar to Fuller et al-2015-head_&_neck
Similar to Fuller et al-2015-head_&_neck (20)
Recently uploaded
Recently uploaded (20)
Fuller et al-2015-head_&_neck
- 1. CLINICAL REVIEW David W. Eisele, MD, Section Editor Adjunctive diagnostic techniques for oral lesions of unknown malignant potential: Systematic review with meta-analysis Colin Fuller, MD, MS,1* Ryan Camilon, BA,1 Shaun Nguyen, MD, MA,1 Jon Jennings, MD,2 Terry Day, MD,1 M. Boyd Gillespie, MD, MSc,1 1 Department of Otolaryngology–Head and Neck Surgery, Medical University of South Carolina, Charleston, South Carolina, 2 Department of Emergency Medicine, Medical University of South Carolina, Charleston, South Carolina. Accepted 1 March 2014 Published online 5 May 2014 in Wiley Online Library (wileyonlinelibrary.com). DOI 10.1002/hed.23667 ABSTRACT: Background. The purpose of this study was to critically review the published evidence concerning adjunctive diagnostic techni- ques in the diagnosis of oral lesions of unknown malignant potential. Methods. We conducted a systematic literature review with meta- analysis using PubMed to search for articles published from June 1993 through June 2013 to identify prospective studies evaluating any diagnostic method, with tissue biopsy confirmation, in clinically evident oral lesions of unknown malignant potential. Aggregate weighted totals and SEs for true, false-positive, false-negative, and inadequate results were calculated and compared among subgroups. Results. Forty-eight articles satisfying inclusion criteria were identified. Twenty-five were included in quantitative synthesis. Conclusion. Oral cytology holds higher diagnostic value than specialist’s oral examination, which holds higher value than in vivo toluidine blue stain- ing. This study does not support the use of computer-aided or liquid-based cytology. Future studies should be designed to test multiple methods in the same patient population to allow direct comparison among various techni- ques. VC 2014 Wiley Periodicals, Inc. Head Neck 37: 755–762, 2015 KEY WORDS: oral cancer, oral lesion, oral premalignancy, oral screening, oral cancer, early detection INTRODUCTION Oral cancer is the eighth most common cancer world- wide.1 In the United States alone, there were an estimated 27,450 new cases of oral cancer in 2013, and it caused an estimated 5,490 deaths.2 Although not among the most common cancers in the United States, oral cancer is asso- ciated with a high degree of morbidity and mortality, which varies widely with staging. It has been demon- strated that early detection is crucial to optimal outcomes. As of 2009, pooled five-year relative survival for stage III and IV disease for oral and oropharyngeal cancer was estimated at 59.2%, whereas that of stage I and II disease was 82.7%.3 In certain parts of the world, oral cancer incidence is much higher. In south-central Asia, cancer of the oral cavity is among the three most common types of cancer.1 Despite the need for earlier diagnosis of oral can- cer, in the United States, only 33% of oral and oropharyn- geal cancer was diagnosed at an early, “localized” stage from 2006 to 2010.4 Because of the deadly nature of oral cancer and the accessibility of the oral cavity for testing, early detection is an active field of research. Diagnosis of oral cancer begins with a thorough history, followed by conventional oral examination (COE). When a suspicious lesion is identified, a full-thickness tissue biopsy, such as punch biopsy, incisional biopsy, or exci- sional biopsy, is often performed as the “gold standard” test for diagnosing oral cancer. However, these tests are not without limitations. Biopsy usually requires a special- ist and access to a pathologist familiar with oral cancer. Many techniques have been advocated over the past sev- eral decades as aids or adjuncts in identifying which lesions are suspicious enough to require biopsy. Unfortu- nately, there remains some confusion and controversy in the literature about which, if any, of these “adjunctive techniques” are most reliable. In a 2008 review, Lingen et al5 made the important dis- tinction between the “screening” and “case-finding” steps in mucosal diagnostics. Screening is defined as an attempt to detect unknown lesions, whereas case-finding is an attempt to diagnose known lesions. This study is restricted to determining the utility of case-finding techni- ques for oral cancer and dysplasia. Case-finding techniques may have great benefit to pri- mary care providers who must determine which patients need referral to a specialist for definitive biopsy. This systematic review and meta-analysis aims to elucidate the utility and accuracy of adjunctive diagnostic techniques for oral potentially malignant lesions. This article was published online on 5 May 2014. The affiliations were incorrect. This notice is included in the online and print versions to indicate that both have been corrected 22 May 2014. *Corresponding author: C. Fuller, Department of Otolaryngology–Head and Neck Surgery, Medical University of South Carolina, MSC 550, 135 Rutledge Ave, Charleston, SC 29403. E-mail: cwfull@gmail.com Additional Supporting Information may be found in the online version of this article. HEAD & NECK—DOI 10.1002/HED MAY 2015 755
- 2. METHODS Literature search Inclusion criteria for this systematic review were devel- oped in two phases. Before conducting a literature search, the first set of inclusion criteria were agreed upon (Table 1). The literature search strategy can be found in the Pre- ferred Reporting Items for Systematic reviews and Meta- Analyses-compliant literature review diagram (Figure 1). A PubMed search was performed by one author (C. F.) for articles published between June 1993 and June 2013 using the predetermined search terms (Appendix, online only; Figure i). This search yielded a total of 2,488 references when English-language and human subject constraints were used. Eighty-eight additional articles were identified by examining the reference lists of captured articles. A Cochrane Library search (April 2008 to June 2013) was also performed using the search term “oral neoplasm,” which returned six references. References were screened manually according to their titles and then based on abstracts. 144 unique articles were identified that poten- tially satisfied the first five inclusion criteria. After assessing the volume of articles pending further review, additional inclusion criteria were established, which are listed in Table 1. Additional articles obtained from reference lists that were older than June 1993 would be included in the systematic review, but not the meta- analysis. Data extraction Data from all articles included in the quantitative analy- sis were abstracted by 2 authors independently (C. F. and R. C.). Data were only collected if a 2 3 2 contingency table (test result vs presence of disease according to biopsy) could be constructed from the data presented. These data were double-checked against any stated sum- mary statistics in each article, such as sensitivity, specific- ity, positive predictive value (PPV), negative predictive value (NPV), and accuracy. In certain cases, the raw data were reconstituted from these summary statistics by deter- mining the whole number ratios that produced them. Data reconstitution could be precisely achieved by solving five equations for five unknown variables if sample size, sen- sitivity, specificity, PPV, and NPV were reported (Appen- dix, online only; Figure ii). When discrepancies arose, the original article’s authors were contacted for comment if the article had been published in the last ten years. Fail- ing this, consensus was reached among all authors regard- ing the validity of data inclusion. Some inclusion criteria pertained to overall study design, whereas others pertained to the characteristics of the patients or their lesions (Table 1). When only some of the patients satisfied these latter inclusion criteria, efforts were made to extract only the data that described qualify- ing lesions or patients. When this was not possible, con- tact with the original authors was attempted if the article was ten years old or less, and consensus was reached among all authors. When diagnostic test results were qualitative, we con- sidered the presence of any level of concern for dysplasia or cancer to be positive, including “atypical,” “equivocal,” or any other result that implied the presence of malignancy/premalignancy; results such as “inflammation” or “hyperplasia” were considered nega- tive, along with “benign” and “normal” results. Gold standard results positive for cancer or any amount of dys- plasia were also considered positive. In cases in which articles used a different cutoff for defining positive and negative test/biopsy results, contact with the original authors was attempted if the article was ten years old or less. If raw data could not be recovered, the authors’ defi- nitions of positive and negative results were accepted. This was only true of two of the included articles,6,7 both of which reported the same study. This study defined the cutoff between negative and positive to be between “oral intraepithelial neoplasia I” and “oral intraepithelial neo- plasia II.” When test results were expressed quantitatively, the authors’ cutoff for test results indicating dysplasia was accepted as the cutoff for positivity, although the algo- rithm used to generate the cutoff was noted. When multi- ple algorithms were assessed, the dataset using the algorithm with the highest accuracy was used to represent the study in the analysis. Where available, data on the results of COE were also tabulated. Again, these data were only included when the entire group of patients evaluated also underwent biopsy. COE data was captured only when a benign versus not benign lesion delineation was obvious. COE data was excluded when the COE or visual impression declared an area of mucosa to be “normal,” because this meta-analysis evaluates the quality of adjuncts and COE in determining the malignant potential of lesions, rather than normal mucosa. The cytology methods are prone to generating “inadequate” or “unreadable” results. For these studies, an additional analysis was performed to examine differences in inadequacy rate between cytology methods. Only studies that specifically reported the number of qualifying TABLE 1. List of inclusion criteria. First phase inclusion criteria la. Oral cancer adjunct tested against gold standard tissue biopsy 2a. 10 or more patients studied 3a. English language publications only 4a. Published in peer-reviewed journal 5a. Adult population only Second phase inclusion criteria lb. Gold standard used for definitive diagnosis in all patients or in all patients within a prospectively-determined subgroup 2b. Adjunct attempts to diagnose dysplasia, rather than simply indicating a correlation 3b. Quantitative data presented that allows for the abstraction of 232 contingency table (disease vs. test result) 4b. If multiple tests evaluated, clinical characteristics could not be used to determine which adjunct was used 5b. Adjunct used prospectively on lesions without histologically confirmed diagnosis 6b. Patients have no history of cancer 7b. No history or anticancer treatment for the lesion in question FULLER ET AL. 756 HEAD & NECK—DOI 10.1002/HED MAY 2015
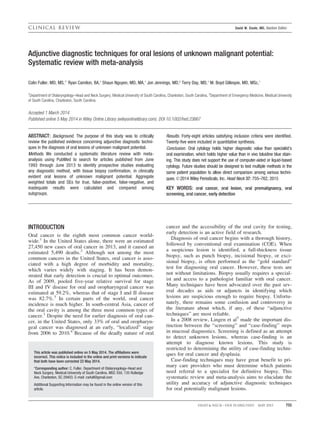
- 3. inadequate samples would be included for this part of the analysis. Statistical analysis Once all contingency tables for each included study were constructed, true and false-positive, true and false- negative, and inadequate results were summed for each group of datasets. For sensitivity calculations, the total with dysplasia or cancer according to gold standard was considered the sample size, whereas the “proportion” was each study’s sensitivity, to generate overall sensitivity and 95% confidence intervals (CIs). Similarly, for specificity and accuracy, the sample size was the number of benign lesions or total lesions (minus inadequate results), respec- tively, in each dataset, whereas the specificity or accu- racy, respectively, was the “proportion.” A meta-analysis of proportions was then conducted on the sensitivity, specificity, and accuracy of each group and subgroup, using MedCalc 12.7.0 (MedCalc Software bvba, Belgium). Analysis of pooled proportions was performed where appropriate. MedCalc used a Freeman–Tukey trans- formation8 (arcsine square root transformation) to calculate the weighted summary proportion under the fixed and FIGURE 1. Preferred Reporting Items for Systematic Reviews and Meta-Analyses literature search flow diagram from origi- nal search through eventual inclusion of qualifying data. FIGURE 2. Conventional oral examination results. Forest plot for sensitivity, specificity, and accuracy of conventional oral examination datasets. For explanation of random versus fixed effects models, see “Statistical Analysis” subsection in Methods section. [Color fig- ure can be viewed in the online issue, which is available at wileyonlinelibrary.com.] DIAGNOSTIC TECHNIQUES FOR ORAL LESIONS OF UNKNOWN MALIGNANT POTENTIAL HEAD & NECK—DOI 10.1002/HED MAY 2015 757
- 4. random effects models.9 Data were presented as weighted proportions with corresponding 95% CIs. Both the fixed effects model and the random effects model were used in this study. Under the fixed effects model, it is assumed that all studies come from a common population, and that the effect size (the proportion) is not significantly different among the different trials. This assumption is tested by the “heterogeneity test” or I2 statistic. If this test yields a low p value < .05, then the fixed effects model may be invalid. In this case, the random effects model may be more appro- priate, in which both the random variation within the stud- ies and the variation between the different studies is incorporated. In addition, a chi-square test with Yates’ correction for continuity was applied with two-sided (or two-tailed) p values for the comparison of two proportions from inde- pendent samples expressed as a percentage, as calculated from the aforementioned aggregations. For each aggrega- tion, the random effects result was used when the I2 test for heterogeneity yielded a p value < .05; otherwise, the fixed effects result was used. Each group was weighted according to the number of patients with dysplastic/malig- nant lesions, benign lesions, or total lesions with adequate results, respectively. When the calculated p value was <.05, the conclusion was that the two proportions were significantly different. RESULTS A total of 48 articles were identified as eligible for qualitative analysis,6,7,10–56 37 of which were “modern era” articles and, thus, eligible for inclusion in the aggre- gated quantitative analysis.6,7,10–32,45–56 One pair of articles6,7 reported data from the same study, but, in this case, the “duplicate” aided in the reconstitution of raw data. The 37 modern articles reported 43 inclusion criteria-satisfying datasets because many studies evaluated multiple techniques, including all studies that reported qualifying results of COE. Data were included in the quantitative analysis and aggregated for comparison for any techniques that had at least three includable datasets. This left 25 articles across five different adjuncts.6,7,10–32 These techniques were COE (three datasets), cytology (12 datasets), toluidine blue vital staining (eight datasets), laser-induced autofluorescence (LIAF) spectroscopy (four datasets) and diffuse reflectance spectroscopy (DRS; three datasets). A total of 2,184 quali- fying measurements were conducted in these studies on a TABLE 3. Overall technique comparisons. Sensitivity Technique D1C Sen TB COE Cytology LIAF DRS 101 98.6 vs <0.001 0.014 0.007 0.990 LIAF 117 97.7 vs <0.001 0.026 0.010 - Cytology 477 89.7 vs 0.006 0.965 - - COE 69 88.7 vs 0.263 - - - TB 240 82.1 vs - - - - Specificity Technique Ben Spe TB COE DRS LIAF Cytology 670 89.8 vs <0.001 <0.001 0.540 0.626 LIAF 23 84.4 vs 0.006 0.064 0.763 - DRS 21 83.2 vs 0.013 0.098 - - COE 80 60.9 vs 0.235 - - - TB 349 52.8 vs - - - - Accuracy Technique N Acc TB COE Cytology LIAF DRS 122 96.5 vs <0.001 <0.001 0.001 0.944 LIAF 140 95.9 vs <0.001 <0.001 0.001 - Cytology 1147 85.7 vs <0.001 0.014 - - COE 149 77.6 vs 0.014 - - - TB 589 66.7 - - - - - Abbreviations: D1C, number of dysplasias and cancers by gold standard; Sen, sensitivity; COE, conventional oral exam; TB, toluidine blue; LIAF, laser-induced autofluorescence; DRS, diffuse reflec- tance spectroscopy; Ben, number of benign lesions by gold standard; N, overall sample size (minus inadequate test results); Acc, accuracy). Overall comparisons proportion using calculated values of sensitivity, specificity and accuracy from fixed or random effects models (see Appendix) and number of dysplastic/cancerous, benign and total lesions, respectively. Techniques are ordered in descending quality. Statistically significant values are bolded and italicized, favoring the technique in the left-hand column. TABLE 2. Diagnostic methods analyzed. Conventional Oral Examination—examination conducted under normal, clinical fluorescent white lighting, without the use of stains, light filters or magnification Oral Cytology—the microscopic examination of superficial oral tissue harvested by non-invasive means (including brush, spatula, curette, etc.) Toluidine Blue Staining—the use of toluidine blue (i.e. tolonium chloride) dye to stain lesions in vivo, under conventional, white fluorescent lighting Laser-induced Autofluorescence Spectroscopy—the use of specific excitation wavelengths to illicit detectable fluorescence spectra in native oral lesions, without the use of “photosensitizers” such as 5-aminolevulinic acid, by any excitation wavelength or spectroscopic analysis algorithm Diffuse Reflectance Spectroscopy—the use of photodetection to analyze the diffuse reflectance spectra of oral lesions, by any spectroscopic anal- ysis algorithm FULLER ET AL. 758 HEAD NECK—DOI 10.1002/HED MAY 2015
- 5. total of 1,887 unique qualifying lesions. Appendix Tables i to v, online only, summarize these studies. A brief explana- tion of each of the techniques evaluated by articles included in our quantitative synthesis can be found in Table 2. Fur- ther basic science discussions of these techniques are included in Appendix section A, online only. The remaining 24 articles analyzed the value of many additional techniques, or were published before 1993 and, thus, not considered “modern era.” However, the findings from these articles, including sensitivity, specificity, and accuracy are summarized in Appendix Table vi, online only. Direct comparisons between each of the 5 techniques are found in Table 3. A set of sample Forest plots for COE is found in Figure 2. The remaining Forest plots are presented in Appendix Figures iii to vi, online only. A more detailed discussion of the results of the meta- analysis can be found in Appendix section C, online only. The most sensitive technique was DRS (98.6%), fol- lowed closely by LIAF (97.7%; Table 3). These techni- ques each demonstrated significantly better sensitivity than the remaining three techniques (COE, cytology, and toluidine blue staining). The least sensitive technique was toluidine blue (82.1%), which was significantly worse than DRS, LIAF, and cytology. The most specific technique was cytology (89.8%), whereas the least specific technique was toluidine blue (52.8%). Toluidine blue was less specific than any other technique except COE. The most accurate tests were DRS and LIAF (96.5% and 95.9%, respectively). They were each more accurate than any of the remaining three techniques. Toluidine blue was the least accurate test (66.7%) and was signifi- cantly outperformed in this category by the four other tests. Within each technique category, subgroups were established to investigate comparisons between variations in technique (Table 4). The single cytology dataset presenting results for wooden spatula harvesting demonstrated significantly higher specificity and accuracy compared to brush biopsy. Conventionally read brush biopsy outperformed computer-assisted brush biopsy based on specificity only. The older, corporate-sponsored OralCDx trial demon- strated significantly higher sensitivity, specificity, and accuracy than the two newer OralCDx datasets collec- tively. No other subgroup comparisons demonstrated stat- istically significant differences. DISCUSSION In discussing the implications of this analysis, the authors first wish to address its limitations. The most important limitation of this meta-analysis is the variability in the patient population between studies. This is not only impor- tant with regard to patient demographics, but also the lesions they present. Lesions that seem to be frankly can- cerous should be referred immediately to a surgeon and biopsied or excised, whereas lesions that have obviously nonmalignant etiologies instead warrant observation and close follow-up; diagnostic adjuncts are most valuable in assessing the lesions that fall in the wide gap between these two categories, and the less experienced the examiner, gen- erally the wider the gap. Although the inclusion criteria were intended to limit data only to lesions that had not been definitively diagnosed by biopsy, this still leaves a TABLE 4. Subgroup comparisons. Technique p-value Technique Wooden spatula cytology (A) vs. Brush cytology (B) Sen, D1C 77.8%, 9 0.489 90.4%, 468 Spe, Ben 100%, 71 0.004 88.0%, 599 Acc, N 97.5%, 80 0.003 84.4%, 1067 OralCDx (C) vs. Conventional brush cytology (D) Sen, D1C 94.3%, 160 0.067 88.6%, 308 Spe, Ben 83.4, 286 0.026 89.9%, 313 Acc, N 84.9%, 446 0.859 84.1%, 621 Sciubba (OralCDx) (E) vs. Recent OralCDx (F) Sen, D1C 100%, 102 0.001 87.8%, 58 Spe, Ben 92.9%, 196 0.001 76.8%, 90 Acc, N 95.3%, 298 0.001 77.6%, 148 Toluidine blue application (G) vs. Toluidine blue rinse (H) Sen, D1C 84.8%, 171 0.109 75%, 69 Spe, Ben 53.9%, 53.9 0.611 50.6%, 181 Acc, N 69.0%, 339 0.226 63.9%, 250 Toluidine blue Mashberg (I) vs. Toluidine blue non-Mashberg (J) Sen, D1C 82.9%, 26 0.935 81.4%, 214 Spe, Ben 54.5%, 67 0.816 52.0%, 282 Acc, N 63.2%, 93 0.444 67.9%, 496 LIAF (dorsal/ventral tongue) (K) vs. LIAF (other locations) (L) Sen, D1C 98.3%, 26 0.643 97.2%, 57 Spe, Ben 50.0%, 2 0.706 87.7%, 20 Acc, N 94.3%, 28 0.870 96.1%, 64 Abbreviations: Sen, sensitivity; D1C, number of dysplasias and cancers by gold standard; Spe, specificity; Ben, number of benign lesions by gold standard; Acc, Accuracy; N, sample size; LIAF, laser-induced autofluorescence). Direct comparison of proportions between dataset subgroups, using the overall sensitivity, specificity and accuracy calculated from fixed or random effects models (see figures). P-values indicating significant differences are listed in bold print, with the better technique also listed in bold print. (Studies composing these subgroups are listed in Appendix Tables i-v). DIAGNOSTIC TECHNIQUES FOR ORAL LESIONS OF UNKNOWN MALIGNANT POTENTIAL HEAD NECK—DOI 10.1002/HED MAY 2015 759
- 6. vast range of clinical possibilities, for some of whom a diagnostic adjunct may be inappropriate. Because it is very likely that the research studies were conducted more often by specialists with an interest in oral cavity cancer than by general clinicians, the exam- iners that determined subject inclusion were also likely to have excellent clinical judgment in determining poten- tially dysplastic lesions. This may limit the applicability of this data to general medical settings. Early detection of oral cancer is rightfully an important focus of research. The impact of earlier diagnosis for all cancers is obvious, but is of particular value with regard to the oral cavity because of reduced survival and quality of life that occurs with later diagnosis. This persists despite the accessibility of the oral cavity to direct examination. Yet there still remains considerable debate as to the clinical value of various oral cancer diagnostic adjuncts for clini- cians at various levels of specialization. There are two main clinical questions at issue; (1) What resources should a general dentist or general medical practitioner bring to bear when confronted by a lesion of uncertain malignant potential; and (2) What resources are valuable for a cancer specialist who may have the same question? The former question is critical from a broad epidemio- logic standpoint, especially in the third world or even among rural general clinicians in developed nations. The ideal test for the general practitioner would be one that is inexpensive, noninvasive, sensitive, and expedient. How- ever, even the judgment of specialists may be aided by the use of these adjunctive tools, because the higher vol- ume of potentially malignant lesions in their practice would allow an adjunct to potentially save a larger num- ber of patients from unnecessary biopsy. The merits and drawbacks of each of the included tech- niques are discussed below, considering the data pre- sented in the meta-analysis. Conventional oral examination To the authors’ knowledge, this is the first meta- analysis evaluating prospective clinical oral examinations made by experts in oral cancer against the gold standard of tissue biopsy. One limitation of the COE data specifically is the observer effect (or so-called “Hawthorn effect”) upon the clinical examination. However, in addition to the behav- ioral changes that occurred simply because of the knowl- edge that one is being observed, there may have been some semiconscious change to the evaluation. Because the eval- uator knew that all of the lesions would receive a biopsy anyway, the risk of a missed cancer diagnosis because of an examiner’s error was completely ameliorated by each patients’ inclusion in the prospective studies. There is a chance that this changed the subjective cutoff for each assessment to one that may not be used by that evaluator clinically. Cytology and noninvasive tissue sampling Based on the meta-analytic data alone, it seems that noninvasive cytology is quite useful. We demonstrate a statistically significantly improved specificity and accu- racy of cytology over a COE by a cancer specialist. Despite this diagnostic improvement, in rural or under- served areas, the use of this technique could delay more definitive diagnosis by a week or more while the speci- men is in transit and in process. Furthermore, of the two main clinically available adjuncts analyzed here (the other being vital staining), cytology is considerably more expensive. Out-of-pocket cost charged by CDx Diagnos- tics for OralCDx sample analysis is $225. According to the authors’ institution chargemaster, the out-of-pocket cost for conventionally read oral smear cytology is $186, whereas the out-of-pocket cost for conventionally read liquid-based cytology is $300. Meanwhile, a 100-mL bot- tle of 1% toluidine blue can be purchased at retail for about $15. This study demonstrated a significantly better specific- ity by conventional cytology compared to the proprietary computer-based OralCDx system. The data also demon- strate significant differences in the sensitivity, specificity, and accuracy of the initial corporate-sponsored trial14 and the pooled sensitivity of older trials (Table 4).20,21 Clinicians must interpret the preceding data with cau- tion. An important limitation of the comparison between OralCDx and conventional cytology is the nature of the inclusion criteria. Disease progression affects sensitivity and specificity (typically later-stage disease is easier to diagnose) even if prevalence does not. The two more recent Oral CDx articles specifically excluded any patients who were diagnosed on examination with frankly cancerous lesions, and one of them also excluded clini- cally diagnosed dysplasias. This likely contributed to the statistically significant difference in sensitivity between this dataset and the dataset published by Sciubba et al,14 in which biopsies were performed only on patients pro- spectively determined likely to have cancer. This under- lines the limitation stated above regarding population heterogeneity. In addition, spatula sampling of oral lesions was demonstrated valuable by this meta-analysis. Only one article evaluated non-Papanicolaou/hematoxy- lin-eosin staining methods,22 and only one article evaluated liquid-based cytology.19 The small sets of data presented by these studies (N 5 20 and 26, respectively) were not of sufficient statistical power to demonstrate statistical signifi- cance, even if such a difference exists (data not shown). We consider acridine orange staining and liquid-based cytology to offer promise as a future research topic, but this meta-analysis does not support their routine use. This meta- analysis could not demonstrate any statistically significant difference in inadequacy rate among cytology methods. Vital staining techniques Despite its affordability, according to this analysis and review, toluidine blue staining does not improve on an oral examination by a cancer specialist once a lesion has been identified. In fact, its use seems to obscure the examination results because the COE accuracy was signif- icantly better than the accuracy of toluidine blue. Tolui- dine blue was also outperformed based on accuracy by every other technique in the quantitative synthesis. However, this does not mean that the stain has no value at all. The value of the dye as an oral cancer screening tool was not evaluated in this study. There were also no data on the accuracy of a clinical examination performed FULLER ET AL. 760 HEAD NECK—DOI 10.1002/HED MAY 2015
- 7. by a general medical or dental practitioner, and there may be a use for the dye in the hands of a generalist. How- ever, the staining pattern in each of the studies was also likely interpreted by an expert in oral cancer rather than a generalist who may also be a poorer judge of staining results. Laser-induced autofluorescence and diffuse reflectance spectroscopy This meta-analysis identified a total of five studies using the LIAF and/or DRS. Four of these studies shared one author, and three of them had the same primary author. The homogeneity of authorship for these techni- ques severely limits the generalizability of the meta- analytic data. The primary author for three of these stud- ies29,30,32 confirmed the lack of patient overlap between studies evaluating the same adjunct. Perhaps the biggest caveat for interpreting the spectro- scopic data is the retrospective nature of model construc- tion inherent to the development of any new diagnostic test. Only a single study29 validated their constructed model prospectively on a second set of undiagnosed lesions. We strongly encourage future researchers to adopt this method of model validation, as it is the best way to demonstrate the applicability of the adjunct to actual patients. Nonetheless, the data from these techniques were impres- sive. By sensitivity and overall accuracy, they outper- formed all other techniques here presented (Table 3). Accuracy data should also be interpreted with caution. The apparent accuracy of a test (defined as “true results/total results”) can be affected by the prevalence of disease, espe- cially when a test’s sensitivity and specificity are appreci- ably different from one another. For example, a highly sensitive but poorly specific test would look more accurate when used on a patient population with high prevalence of disease. This would have a greater effect on the accuracy of the spectroscopic studies, because their prevalence of disease was very high, and these techniques seem to be more sensitive than they are specific. Before declaring that these techniques are the “wave of the future” for oral cancer diagnosis, further study verify- ing these models prospectively is needed. However, the success of the spectroscopic diagnostic strategies is encouraging compared to the remaining three methods. Spectroscopy has the potential to offer a noninvasive instantaneous answer to the clinical question of whether a lesion is benign, dysplastic, or cancerous. The question of whether these can be successfully brought to bear in a clinical setting may rest on the system’s financial accessi- bility to the clinicians that would benefit most from using them: rural and general clinician. It is commonly noted that LIAF has limited use in lesions of the lateral and dorsal tongue and vermillion border of the lip because normal mucosa in these areas generates a fluorescence spectrum analogous to that of cancer. Although this was demonstrated in one of the included articles,30 the diagnostic errors were almost completely confined to normal, lesion-free mucosa. We note that because these spectroscopic techniques are under develop- ment for use in evaluating known lesions, rather than scan- ning to screen for unknown lesions, this drawback may not significantly impact its clinical value. This analysis shows no significant difference between the diagnostic accuracy of LIAF for lesions in the dorsal and lateral tongue and its accuracy for lesions elsewhere. Avenues for future research Considering the lower incidence rate of oral cancer compared to other forms of malignancy, further study in the area of known lesion diagnostics may hold the key to reducing the mortality of this disease. Future research should facilitate the evaluation of diagnostic adjuncts against one another in the same patient population, with confirmation in all patients by tissue biopsy. In addition, the reporting of CIs or SEs alongside descriptive statis- tics, such as sensitivity, specificity, PPV, NPV, accuracy, and inadequacy rate is strongly encouraged. Without these measures of confidence, comparisons between diagnostic modalities hold far less value. Future meta-analyses on this topic may continue to prove quite valuable, as the sample sizes required to achieve sta- tistical significance may outstrip the resources of any one researcher or research group. Publication of raw data or its inclusion in appendices for meta-analytic purposes is important. Researchers need to consider the examination skills of the clinicians that are most likely to benefit from these adjuncts. To evaluate whether any of these adjuncts are useful to general dentists and medical doctors, the baseline general practitioner COE must be studied against gold standard biopsy. Future research methods should consider defining their examination-based inclusion criteria by the generalist’s examination, if these clinicians are the ones who will most benefit from the use of the adjunct. CONCLUSION This meta-analysis demonstrates a statistically significant improvement in diagnostic quality of oral cytology meth- ods over COE based on superior specificity and overall accuracy. This analysis does not support the use of more costly versions of oral cytology, such as OralCDx computer-assisted cytology or liquid-based cytology based on diagnostic accuracy or inadequacy of the sample. Other sampling techniques for cytology may hold promise, but further study is needed to assess their diagnostic value. For visible lesions, toluidine blue seems to hold little value. Few head-to-head trials have been published evaluating dif- ferent techniques in the same population. Both LIAF and DRS had a significantly higher accuracy than COE and toluidine blue staining, and significantly bet- ter sensitivity than toluidine blue staining. DRS also dem- onstrated significant improvement in sensitivity compared to cytology. These diagnostic adjuncts are promising and we encourage further research prospectively evaluating these methods using established diagnostic algorithms. Acknowledgments The authors thank Drs. Hohlweg–Majert,18 Kaczmarzyk and Mojsa,31 Narayanan and Mallia,29,30,32 and Joseph Califano and David Sirois for their assistance with inter- preting and clarifying data. DIAGNOSTIC TECHNIQUES FOR ORAL LESIONS OF UNKNOWN MALIGNANT POTENTIAL HEAD NECK—DOI 10.1002/HED MAY 2015 761
- 8. REFERENCES 1. Petersen PE. Strengthening the prevention of oral cancer: the WHO per- spective. Community Dent Oral Epidemiol 2005;33:397–399. 2. American Cancer Society. Cancer Facts and Figures 2013. Available at: http:// www.cancer.org/acs/groups/content/@epidemiologysurveilance/documents/ document/acspc-036845.pdf. Accessed August 1, 2013. 3. Surveillance, Epidemiology, and End Results (SEER) Program (www.seer. cancer.gov) SEER*Stat Database: Mortality – All COD, Aggregated With State, Total U.S. (1969–2010) Katrina/Rita Population Adjustment, National Cancer Institute, DCCPS, Surveillance Research Program, Sur- veillance Systems Branch, released April 2013. Underlying mortality data provided by NCHS (www.cdc.gov/nchs). 4. Surveillance, Epidemiology, and End Results (SEER) Program (www.seer. cancer.gov) Research Data (1973–2010), National Cancer Institute, DCCPS, Surveillance Research Program, Surveillance Systems Branch, released April 2013, based on the November 2012 submission. 5. Lingen MW, Kalmar JR, Karrison T, Speight PM. Critical evaluation of diagnostic aids for the detection of oral cancer. Oral Oncol 2008;44:10–22. 6. Navone R, Burlo P, Pich A, et al. The impact of liquid-based oral cytology on the diagnosis of oral squamous dysplasia and carcinoma. Cytopathology 2007;18:356–360. 7. Navone R. Cytology of the oral cavity: a re-evaluation. Pathologica 2009; 101:6–8. 8. Freeman MF, Tukey JW. Transformations related to the angular and the square root. Ann Math Stat 1950;21:607–611. 9. DerSimonian R, Laird N. Meta-analysis in clinical trials. Control Clin Tri- als 1986;7:177–188. 10. G€uneri P, Epstein JB, Kaya A, Veral A, Kazandi A, Boyacioglu H. The utility of toluidine blue staining and brush cytology as adjuncts in clinical examination of suspicious oral mucosal lesions. Int J Oral Maxillofac Surg 2011;40:155–161. 11. Gillenwater A, Jacob R, Ganeshappa R, et al. Noninvasive diagnosis of oral neoplasia based on fluorescence spectroscopy and native tissue auto- fluorescence. Arch Otolaryngol Head Neck Surg 1998;124:1251–1258. 12. Koch FP, Kaemmerer PW, Biesterfeld S, Kunkel M, Wagner W. Effective- ness of autofluorescence to identify suspicious oral lesions—a prospective, blinded clinical trial. Clin Oral Investig 2011;15:975–982. 13. Erenmemisoglu A, Ustun H, Kartal M. Carcinoma of buccal mucosa in smokeless tobacco users: a preliminary study of the use of cytology for early detection. Cytopathology 1995;6:403–408. 14. Sciubba JJ. Improving detection of precancerous and cancerous oral lesions. Computer-assisted analysis of the oral brush biopsy. U.S. Collabo- rative OralCDx Study Group. J Am Dent Assoc 1999;130:1445–1457. 15. Maraki D, Becker J, Boecking A. Cytologic and DNA-cytometric very early diagnosis of oral cancer. J Oral Pathol Med 2004;33:398–404. 16. Gupta A, Singh M, Ibrahim R, Mehrotra R. Utility of toluidine blue stain- ing and brush biopsy in precancerous and cancerous oral lesions. Acta Cytol 2007;51:788–794. 17. Mehrotra R, Singh MK, Pandya S, Singh M. The use of an oral brush biopsy without computer-assisted analysis in the evaluation of oral lesions: a study of 94 patients. Oral Surg Oral Med Oral Pathol Oral Radiol Endod 2008;106:246–253. 18. Hohlweg–Majert B, Depp H, Metzger MC, et al. Sensitivity and specificity of oral brush biopsy. Cancer Invest 2009;27:293–297. 19. Delavarian Z, Mohtasham N, Mosannen–Mozafari P, Pakfetrat A, Shakeri MT, Ghafoorian–Maddah R. Evaluation of the diagnostic value of a modi- fied liquid-based cytology using OralCDx brush in early detection of oral potentially malignant lesions and oral cancer. Med Oral Patol Oral Cir Bucal 2010;15:e671–e676. 20. Koch FP, Kunkel M, Biesterfeld S, Wagner W. Diagnostic efficiency of differentiating small cancerous and precancerous lesions using mucosal brush smears of the oral cavity—a prospective and blinded study. Clin Oral Investig 2011;15:763–769. 21. Mehrotra R, Mishra S, Singh M, Singh M. The efficacy of oral brush biopsy with computer-assisted analysis in identifying precancerous and cancerous lesions. Head Neck Oncol 2011;3:39. 22. Prakash N, Sharada P, Pradeep GL, Soundarya N. Reliability of acridine orange fluorescence microscopy in oral cytodiagnosis. Indian J Dent Res 2011;22:649–653. 23. Onofre MA, Sposto MR, Navarro CM. Reliability of toluidine blue applica- tion in the detection of oral epithelial dysplasia and in situ and invasive squamous cell carcinomas. Oral Surg Oral Med Oral Pathol Oral Radiol Endod 2001;91:535–540. 24. Nagaraju K, Prasad S, Ashok L. Diagnostic efficiency of toluidine blue with Lugol’s iodine in oral premalignant and malignant lesions. Indian J Dent Res 2010;21:218–223. 25. Upadhyay J, Rao NN, Upadhyay RB, Agarwal P. Reliability of toluidine blue vital staining in detection of potentially malignant oral lesions—time to reconsider. Asian Pac J Cancer Prev 2011;12:1757–1760. 26. Cancela–Rodrıguez P, Cerero–Lapiedra R, Esparza–Gomez G, Llamas– Martınez S, Warnakulasuriya S. The use of toluidine blue in the detection of pre- malignant and malignant oral lesions. J Oral Pathol Med 2011;40:300–304. 27. Awan KH, Yang Y, Morgan P, Warnakulasuriya S. Utility of toluidine blue as a diagnostic adjunct in the detection of potentially malignant disorders of the oral cavity—a clinical and histological assessment. Oral Dis 2012; 18:728–733. 28. Mojsa I, Kaczmarzyk T, Zaleska M, Stypulkowska J, Zapala–Pospiech A, Sadecki D. Value of the ViziLite Plus System as a diagnostic aid in the early detection of oral cancer/premalignant epithelial lesions. J Craniofac Surg 2012;23:e162–e164. 29. Mallia RJ, Thomas SS, Mathews A, et al. Laser-induced autofluorescence spectral ratio reference standard for early discrimination of oral cancer. Cancer 2008;112:1503–1512. 30. Mallia RJ, Narayanan S, Madhavan J, et al. Diffuse reflection spectros- copy: an alternative to autofluorescence spectroscopy in tongue cancer detection. Appl Spectrosc 2010;64:409–418. 31. Jayanthi JL, Subhash N, Stephen M, Philip EK, Beena VT. Comparative evalu- ation of the diagnostic performance of autofluorescence and diffuse reflectance in oral cancer detection: a clinical study. J Biophotonics 2011;4:696–706. 32. Mallia R, Thomas SS, Mathews A, et al. Oxygenated hemoglobin diffuse reflectance ratio for in vivo detection of oral pre-cancer. J Biomed Opt 2008;13:041306. 33. Silverman S Jr, Becks H, Farber SM. The diagnostic value of intraoral cytology. J Dent Res 1958;37:195–205. 34. Tiecke RW, Kendrick FJ, Calandra JC. Smear techniques in the diagnosis of intra-oral carcinoma. Dental Prog (Chic) 1961;1:192–198. 35. Hellinger MJ, Karpas CM, Sellers W Jr. A clinicopathologic correlation of oral white lesions. Study of forty-five cases. Oral Surg Oral Med Oral Pathol 1963;16:1356–1376. 36. Gardner AF. An investigation of the use of exfoliative cytology in the diag- nosis of malignant lesions of the oral cavity. The cytologic diagnosis of oral carcinoma. Acta Cytol 1964;8:436–445. 37. Caulder SL. Fluorescence microscopy utilizing acridine orange in oral cytodiagnosis. Oral Surg Oral Med Oral Pathol 1967;23:343–350. 38. Gaither WD. Comparison of exfoliative cytodiagnosis and histodiagnosis of oral lesions: review of the literature and report of 75 cases. J Oral Surg 1967;25:446–454. 39. Reddy CR, Ramulu C, Sundareshwar B, Raju MV, Gopal R, Sarma R. Toluidine blue staining of oral cancer and precancerous lesions. Indian J Med Res 1973;61:1161–1164. 40. Mashberg A. Reevaluation of toluidine blue application as a diagnostic adjunct in the detection of asymptomatic oral squamous carcinoma: a con- tinuing prospective study of oral cancer Ill. Cancer 1980;46:758–763. 41. Mashberg A. Final evaluation of tolonium chloride rinse for screening of high-risk patients with asymptomatic squamous carcinoma. J Am Dent Assoc 1983;106:319–323. 42. Mashberg A. Tolonium (toluidine blue) rinse—a screening method for rec- ognition of squamous carcinoma. Continuing study of oral cancer IV. JAMA 1981;245:2408–2410. 43. Silverman S Jr, Migliorati C, Barbosa J. Toluidine blue staining in the detection of oral precancerous and malignant lesions. Oral Surg Oral Med Oral Pathol 1984;57:379–382. 44. Silverman S Jr, Migliorati C. Toluidine blue staining and early detection of oral precancerous and malignant lesions. Iowa Dent J 1992;78:15–16. 45. Chen YW, Lin JS, Wu CH, Lui MT, Kao SY, Fong Y. Application of in vivo stain of methylene blue as a diagnostic aid in the early detection and screening of oral squamous cell carcinoma and precancer lesions. J Chin Med Assoc 2007;70:497–503. 46. Kulapaditharom B, Boonkitticharoen V. Performance characteristics of flu- orescence endoscope in detection of head and neck cancers. Ann Otol Rhi- nol Laryngol 2001;110:45–52. 47. Seetharam SS, Ramachandran CR. Fine needle aspiration cytology as a diagnostic test for oral squamous cell carcinoma. Oral Dis 1998;4:180–186. 48. Sharwani A, Jerjes W, Salih V, et al. Fluorescence spectroscopy combined with 5-aminolevulinic acid-induced protoporphyrin IX fluorescence in detecting oral premalignancy. J Photochem Photobiol B 2006;83:27–33. 49. Sharwani A, Jerjes W, Salih V, et al. Assessment of oral premalignancy using elastic scattering spectroscopy. Oral Oncol 2006;42:343–349. 50. Farah CS, McCullough MJ. A pilot case control study on the efficacy of acetic acid wash and chemiluminescent illumination (ViziLite) in the visu- alisation of oral mucosal white lesions. Oral Oncol 2007;43:820–824. 51. Nieman LT, Kan CW, Gillenwater A, Markey MK, Sokolov K. Probing local tissue changes in the oral cavity for early detection of cancer using oblique polarized reflectance spectroscopy: a pilot clinical trial. J Biomed Opt 2008;13:024011. 52. Tsai MT, Lee HC, Lee CK, et al. Effective indicators for diagnosis of oral cancer using optical coherence tomography. Opt Express 2008;16: 15847–15862. 53. Bremmer JF, Graveland AP, Brink A, et al. Screening for oral precancer with noninvasive genetic cytology. Cancer Prev Res (Phila) 2009;2:128–133. 54. Pentenero M, Gieretti W, Navone R, et al. DNA aneuploidy and dysplasia in oral potentially malignant disorders: association with cigarette smoking and site. Oral Oncol 2009;45:887–890. 55. Amelink A, Sterenborg HJ, Roodenburg JL, Witjes MJ. Non-invasive mea- surement of the microvascular properties of non-dysplastic and dysplastic oral leukoplakias by use of optical spectroscopy. Oral Oncol 2011;47:1165–1170. 56. Saeki N, Tsuzuki K, Negoro A, et al. Utility of real-time diagnosis using contact endoscopy for oral and lingual diseases. Auris Nasus Larynx 2011; 38:233–239. FULLER ET AL. 762 HEAD NECK—DOI 10.1002/HED MAY 2015