SlideShare a Scribd company logo
1 of 3
Download to read offline
Date : 03/05/2010

                                              Market Summary
                   Indices               Top 5 Gainers           Top 5 Losers               Sectoral Watch
                  Nifty     Sensex      Stocks   % Gain      Stocks    % Loss            Sector          %G/L
Open                5254      17503     BPCL      5.84       AMBUJACEM   3.18            REALTY            1.77
High                5295      17647     HEROHONDA 4.17       WIPRO       2.69            AUTO              1.51
Low                 5254      17503     TATAMOTOR 3.73       TATASTEEL   2.16            HC                1.12
Close               5278      17559     UNITECH   3.02       ABB         1.25            CD                1.02
% Chg                  0.45      0.32   NTPC      2.85       SAIL        1.08            METAL            (0.41)


Source : Falcon                                                                                     NIFTY DLY CHART
Broadly speaking we expect markets to trade in the range of 17345 / 5200 on the downside and 18050 / 5400 on
the upside. On the daily charts, the crucial support levels remains at 17276 / 5160 levels .Any closing below
17276 / 5160 level would indicate reversal of trend and indices could test lower levels of 16888 – 16730 / 5050 –
5000.

Traders are advised to trade with positive bias in the selective Mid- cap counters as they are expected to out-
perform the Sensex going forward.


                      Stocks +ve Bias                                             Stocks -ve Bias
                           CIPLA
                          ROLTA


       For Private Circulation Only.
PIVOTS
      Stocks              Close         S2             S1          Pivot         R1          R2
SENSEX                      17559.00    17426.00       17493.00     17570.00     17636.00    17713.00
NIFTY                        5278.00     5235.00        5257.00       5276.00     5297.00     5316.00
ABB                           792.00       757.00         775.00       792.00       810.00      828.00
ACC                           905.00       871.00         888.00       899.00       916.00      927.00
AMBUJACEM                     121.00       117.00         119.00       121.00       123.00      126.00
AXISBANK                     1270.00     1250.00        1260.00       1273.00     1283.00     1296.00
BHARTIARTL                    299.00       292.00         295.00       299.00       302.00      306.00
BHEL                         2492.00     2448.00        2470.00       2503.00     2526.00     2559.00
BPCL                          518.00       481.00         499.00       510.00       529.00      540.00
CAIRN                         316.00       309.00         312.00       315.00       319.00      321.00
CIPLA                         343.00       331.00         337.00       341.00       347.00      351.00
DLF                           311.00       305.00         308.00       312.00       315.00      319.00
GAIL                          429.00       412.00         421.00       426.00       434.00      439.00
HCLTECH                       394.00       375.00         385.00       391.00       401.00      408.00
HDFC                         2814.00     2762.00        2788.00       2823.00     2849.00     2884.00
HDFCBANK                     2000.00     1971.00        1986.00       1998.00     2013.00     2025.00
HEROHONDA                    1915.00     1799.00        1857.00       1898.00     1956.00     1997.00
HINDALCO                      179.00       176.00         177.00       179.00       181.00      183.00
HINDUNILVR                    240.00       234.00         237.00       239.00       242.00      244.00
ICICIBANK                     952.00       937.00         945.00       955.00       962.00      972.00
IDEA                            61.00       60.00          60.00         61.00       62.00       63.00
IDFC                          171.00       166.00         168.00       170.00       172.00      174.00
INFOSYSTCH                   2738.00     2643.00        2691.00       2725.00     2772.00     2806.00
ITC                           266.00       263.00         264.00       267.00       268.00      270.00
JINDALSTEL                    743.00       729.00         736.00       744.00       751.00      758.00
JPASSOCIAT                    148.00       145.00         147.00       148.00       149.00      151.00
KOTAKBANK                     739.00       723.00         731.00       738.00       745.00      752.00
LT                           1615.00     1591.00        1603.00       1614.00     1626.00     1637.00
M&M                           526.00       513.00         520.00       526.00       532.00      538.00
MARUTI                       1280.00     1260.00        1270.00       1285.00     1295.00     1310.00
NTPC                          208.00       201.00         204.00       207.00       210.00      212.00
ONGC                         1055.00     1023.00        1039.00       1050.00     1066.00     1077.00
PNB                          1040.00     1015.00        1027.00       1037.00     1050.00     1060.00
POWERGRID                     110.00       109.00         109.00       110.00       111.00      112.00
RANBAXY                       443.00       436.00         440.00       444.00       448.00      452.00
RCOM                          164.00       160.00         162.00       165.00       167.00      171.00
RELCAPITAL                    739.00       725.00         732.00       741.00       749.00      758.00
RELIANCE                     1034.00     1020.00        1027.00       1037.00     1044.00     1054.00
RELINFRA                     1137.00     1108.00        1123.00       1141.00     1155.00     1173.00
RPOWER                        163.00       160.00         162.00       164.00       165.00      167.00
SAIL                          218.00       212.00         215.00       220.00       223.00      227.00
SBIN                         2301.00     2261.00        2281.00       2300.00     2320.00     2339.00
SIEMENS                       712.00       694.00         703.00       710.00       719.00      726.00
STER                          828.00       814.00         821.00       830.00       837.00      846.00
SUNPHARMA                    1571.00     1468.00        1520.00       1562.00     1614.00     1656.00
SUZLON                          69.00       67.00          68.00         69.00       70.00       70.00
TATAMOTORS                    873.00       832.00         852.00       865.00       886.00      899.00
TATAPOWER                    1358.00     1333.00        1346.00       1360.00     1373.00     1387.00
TATASTEEL                     619.00       597.00         608.00       626.00       637.00      655.00
TCS                           765.00       757.00         761.00       767.00       771.00      777.00
UNITECH                         85.00       83.00          84.00         85.00       86.00       87.00
WIPRO                         672.00       653.00         662.00       679.00       688.00      705.00


     For Private Circulation Only.
RESEARCH TEAM

Shardul Kulkarni                                    Head - Technicals
Ajit Joshi                                          AVP - TAS
Brijesh Ail                                         Manager - TAS
Mileen Vasudeo                                      Technical Analyst


For any Queries, Suggestions and Feedback kindly mail to vasudeo.kamalakant@angeltrade.com

Research Team: 022-3952 6600                                                                            Website: www.angelbroking.com
DISCLAIMER: This document is not for public distribution and has been furnished to you solely for your information and must not be reproduced or
redistributed to any other person. Persons into whose possession this document may come are required to observe these restrictions.

Opinion expressed is our current opinion as of the date appearing on this material only. While we endeavor to update on a reasonable basis the
information discussed in this material, there may be regulatory, compliance, or other reasons that prevent us from doing so. Prospective investors and
others are cautioned that any forward-looking statements are not predictions and may be subject to change without notice. Our proprietary trading and
investment businesses may make investment decisions that are inconsistent with the recommendations expressed herein.

The information in this document has been printed on the basis of publicly available information, internal data and other reliable sources believed to be
true and are for general guidance only. While every effort is made to ensure the accuracy and completeness of information contained, the company
takes no guarantee and assumes no liability for any errors or omissions of the information. No one can use the information as the basis for any claim,
demand or cause of action.

Recipients of this material should rely on their own investigations and take their own professional advice. Each recipient of this document should make
such investigations as it deems necessary to arrive at an independent evaluation of an investment in the securities of companies referred to in this
document (including the merits and risks involved), and should consult their own advisors to determine the merits and risks of such an investment. Price
and value of the investments referred to in this material may go up or down. Past performance is not a guide for future performance. Certain
transactions - futures, options and other derivatives as well as non-investment grade securities - involve substantial risks and are not suitable for all
investors. Reports based on technical analysis centers on studying charts of a stock's price movement and trading volume, as opposed to focusing on a
company's fundamentals and as such, may not match with a report on a company's fundamentals.


We do not undertake to advise you as to any change of our views expressed in this document. While we would endeavor to update the information
herein on a reasonable basis, Angel Broking, its subsidiaries and associated companies, their directors and employees are under no obligation to
update or keep the information current. Also there may be regulatory, compliance, or other reasons that may prevent Angel Broking and affiliates from
doing so. Prospective investors and others are cautioned that any forward-looking statements are not predictions and may be subject to change without
notice.


Angel Broking Limited and affiliates, including the analyst who has issued this report, may, on the date of this report, and from time to time, have long or
short positions in, and buy or sell the securities of the companies mentioned herein or engage in any other transaction involving such securities and earn
brokerage or compensation or act as advisor or have other potential conflict of interest with respect to company/ies mentioned herein or inconsistent
with any recommendation and related information and opinions.

Angel Broking Limited and affiliates may seek to provide or have engaged in providing corporate finance, investment banking or other advisory services
in a merger or specific transaction to the companies referred to in this report, as on the date of this report or in the past.

Sebi Registration No : INB 010996539


             For Private Circulation Only.

More Related Content

What's hot

Tech Report 23.04.2010
Tech Report 23.04.2010Tech Report 23.04.2010
Tech Report 23.04.2010Angel Broking
 
Tech report 15.06.2010
Tech report 15.06.2010Tech report 15.06.2010
Tech report 15.06.2010Angel Broking
 
Tech Report - August 19, 2010
Tech Report - August 19, 2010Tech Report - August 19, 2010
Tech Report - August 19, 2010Angel Broking
 
Technical Report - August 18, 2010
Technical Report - August 18, 2010Technical Report - August 18, 2010
Technical Report - August 18, 2010Angel Broking
 
Tech report 21.04.2010
Tech report 21.04.2010Tech report 21.04.2010
Tech report 21.04.2010Angel Broking
 
Tech report 28.05.2010
Tech report 28.05.2010Tech report 28.05.2010
Tech report 28.05.2010Angel Broking
 
Tech report 14.05.2010
Tech report 14.05.2010Tech report 14.05.2010
Tech report 14.05.2010Angel Broking
 
Tech report 10.06.2010
Tech report 10.06.2010Tech report 10.06.2010
Tech report 10.06.2010Angel Broking
 
Tech report 24 06 2010
Tech report 24 06 2010Tech report 24 06 2010
Tech report 24 06 2010Angel Broking
 
Technical Report- June 22, 2010
Technical Report- June 22, 2010Technical Report- June 22, 2010
Technical Report- June 22, 2010Angel Broking
 
Techical Report - June 30, 2010
Techical Report - June 30, 2010Techical Report - June 30, 2010
Techical Report - June 30, 2010Angel Broking
 
Tech Report 19 07 2010
Tech Report 19 07 2010Tech Report 19 07 2010
Tech Report 19 07 2010Angel Broking
 
Tech Report 25 03 2010
Tech Report 25 03 2010Tech Report 25 03 2010
Tech Report 25 03 2010Angel Broking
 
Tech report 25.05.2010
Tech report 25.05.2010Tech report 25.05.2010
Tech report 25.05.2010Angel Broking
 
Technical Report - September 8, 2010
Technical Report - September 8, 2010Technical Report - September 8, 2010
Technical Report - September 8, 2010Angel Broking
 
Tech report 11.05.2010
Tech report 11.05.2010Tech report 11.05.2010
Tech report 11.05.2010guest45ce0f1
 
Tech report 05.05.2010
Tech report 05.05.2010Tech report 05.05.2010
Tech report 05.05.2010Angel Broking
 

What's hot (18)

Tech Report 23.04.2010
Tech Report 23.04.2010Tech Report 23.04.2010
Tech Report 23.04.2010
 
Tech report 15.06.2010
Tech report 15.06.2010Tech report 15.06.2010
Tech report 15.06.2010
 
Tech Report - August 19, 2010
Tech Report - August 19, 2010Tech Report - August 19, 2010
Tech Report - August 19, 2010
 
Technical Report - August 18, 2010
Technical Report - August 18, 2010Technical Report - August 18, 2010
Technical Report - August 18, 2010
 
Tech report 21.04.2010
Tech report 21.04.2010Tech report 21.04.2010
Tech report 21.04.2010
 
Tech report 28.05.2010
Tech report 28.05.2010Tech report 28.05.2010
Tech report 28.05.2010
 
Tech report 14.05.2010
Tech report 14.05.2010Tech report 14.05.2010
Tech report 14.05.2010
 
Tech report 10.06.2010
Tech report 10.06.2010Tech report 10.06.2010
Tech report 10.06.2010
 
Tech report 24 06 2010
Tech report 24 06 2010Tech report 24 06 2010
Tech report 24 06 2010
 
Technical Report- June 22, 2010
Technical Report- June 22, 2010Technical Report- June 22, 2010
Technical Report- June 22, 2010
 
Techical Report - June 30, 2010
Techical Report - June 30, 2010Techical Report - June 30, 2010
Techical Report - June 30, 2010
 
Tech Report 19 07 2010
Tech Report 19 07 2010Tech Report 19 07 2010
Tech Report 19 07 2010
 
Tech Report 25 03 2010
Tech Report 25 03 2010Tech Report 25 03 2010
Tech Report 25 03 2010
 
Tech report 25.05.2010
Tech report 25.05.2010Tech report 25.05.2010
Tech report 25.05.2010
 
Technical Report - September 8, 2010
Technical Report - September 8, 2010Technical Report - September 8, 2010
Technical Report - September 8, 2010
 
Tech report 11.05.2010
Tech report 11.05.2010Tech report 11.05.2010
Tech report 11.05.2010
 
Tech Report 31 Mar
Tech Report 31 MarTech Report 31 Mar
Tech Report 31 Mar
 
Tech report 05.05.2010
Tech report 05.05.2010Tech report 05.05.2010
Tech report 05.05.2010
 

Viewers also liked

Viewers also liked (6)

MCA certificate
MCA certificateMCA certificate
MCA certificate
 
Analysis of the Risk Acceptable Level - A case of China
Analysis of the Risk Acceptable Level - A case of ChinaAnalysis of the Risk Acceptable Level - A case of China
Analysis of the Risk Acceptable Level - A case of China
 
Risk governance deficits and emerging risks
Risk governance deficits and emerging risksRisk governance deficits and emerging risks
Risk governance deficits and emerging risks
 
Additional Media Highlights
Additional Media HighlightsAdditional Media Highlights
Additional Media Highlights
 
20150817133705645
2015081713370564520150817133705645
20150817133705645
 
HospCorpDev 060210
HospCorpDev 060210HospCorpDev 060210
HospCorpDev 060210
 

Similar to Market Summary and Stocks to Watch

Techical Report June 28, 2010
Techical Report June 28, 2010Techical Report June 28, 2010
Techical Report June 28, 2010Angel Broking
 
Tech report 30.04.2010
Tech report 30.04.2010Tech report 30.04.2010
Tech report 30.04.2010Angel Broking
 
Tech Report - 9 Apr 2010
Tech Report - 9 Apr 2010Tech Report - 9 Apr 2010
Tech Report - 9 Apr 2010Angel Broking
 
Tech report 14.06.2010
Tech report 14.06.2010Tech report 14.06.2010
Tech report 14.06.2010Angel Broking
 
Technical Report - August 17, 2010
Technical Report - August 17, 2010Technical Report - August 17, 2010
Technical Report - August 17, 2010Angel Broking
 
Techical Report - June 30, 2010
Techical Report - June 30, 2010Techical Report - June 30, 2010
Techical Report - June 30, 2010Angel Broking
 
Tech Report, 13 Apr 2010
Tech Report, 13 Apr 2010Tech Report, 13 Apr 2010
Tech Report, 13 Apr 2010Angel Broking
 
Technical Report - June 23, 2010
Technical Report - June 23, 2010Technical Report - June 23, 2010
Technical Report - June 23, 2010Angel Broking
 
Tech report 23 06 2010
Tech report 23 06 2010Tech report 23 06 2010
Tech report 23 06 2010Angel Broking
 
Techical Report - July 9, 2010
Techical Report - July 9, 2010Techical Report - July 9, 2010
Techical Report - July 9, 2010Angel Broking
 
Tech report 26.05.2010
Tech report 26.05.2010Tech report 26.05.2010
Tech report 26.05.2010Angel Broking
 
Technical Report - July 5, 2010
Technical Report - July 5, 2010Technical Report - July 5, 2010
Technical Report - July 5, 2010Angel Broking
 
Technical Report - September 15, 2010
Technical Report - September 15, 2010Technical Report - September 15, 2010
Technical Report - September 15, 2010Angel Broking
 
Technical Report- June 21, 2010
Technical Report- June 21, 2010Technical Report- June 21, 2010
Technical Report- June 21, 2010Angel Broking
 
Tech report 26.04.2010
Tech report 26.04.2010Tech report 26.04.2010
Tech report 26.04.2010Angel Broking
 
Tech report - 16 Apr 2010
Tech report - 16 Apr 2010Tech report - 16 Apr 2010
Tech report - 16 Apr 2010Angel Broking
 
Tech report 07.10.2010
Tech report 07.10.2010Tech report 07.10.2010
Tech report 07.10.2010Angel Broking
 

Similar to Market Summary and Stocks to Watch (18)

Techical Report June 28, 2010
Techical Report June 28, 2010Techical Report June 28, 2010
Techical Report June 28, 2010
 
Tech report 30.04.2010
Tech report 30.04.2010Tech report 30.04.2010
Tech report 30.04.2010
 
Tech Report - 9 Apr 2010
Tech Report - 9 Apr 2010Tech Report - 9 Apr 2010
Tech Report - 9 Apr 2010
 
Tech report 14.06.2010
Tech report 14.06.2010Tech report 14.06.2010
Tech report 14.06.2010
 
Technical Report - August 17, 2010
Technical Report - August 17, 2010Technical Report - August 17, 2010
Technical Report - August 17, 2010
 
Techical Report - June 30, 2010
Techical Report - June 30, 2010Techical Report - June 30, 2010
Techical Report - June 30, 2010
 
Tech Report, 13 Apr 2010
Tech Report, 13 Apr 2010Tech Report, 13 Apr 2010
Tech Report, 13 Apr 2010
 
Technical Report - June 23, 2010
Technical Report - June 23, 2010Technical Report - June 23, 2010
Technical Report - June 23, 2010
 
Tech report 23 06 2010
Tech report 23 06 2010Tech report 23 06 2010
Tech report 23 06 2010
 
Techical Report - July 9, 2010
Techical Report - July 9, 2010Techical Report - July 9, 2010
Techical Report - July 9, 2010
 
Tech report 26.05.2010
Tech report 26.05.2010Tech report 26.05.2010
Tech report 26.05.2010
 
Technical Report - July 5, 2010
Technical Report - July 5, 2010Technical Report - July 5, 2010
Technical Report - July 5, 2010
 
Technical Report - September 15, 2010
Technical Report - September 15, 2010Technical Report - September 15, 2010
Technical Report - September 15, 2010
 
Technical Report- June 21, 2010
Technical Report- June 21, 2010Technical Report- June 21, 2010
Technical Report- June 21, 2010
 
Tech report 26.04.2010
Tech report 26.04.2010Tech report 26.04.2010
Tech report 26.04.2010
 
Tech Report, 1 Apr
Tech Report, 1 AprTech Report, 1 Apr
Tech Report, 1 Apr
 
Tech report - 16 Apr 2010
Tech report - 16 Apr 2010Tech report - 16 Apr 2010
Tech report - 16 Apr 2010
 
Tech report 07.10.2010
Tech report 07.10.2010Tech report 07.10.2010
Tech report 07.10.2010
 

Market Summary and Stocks to Watch

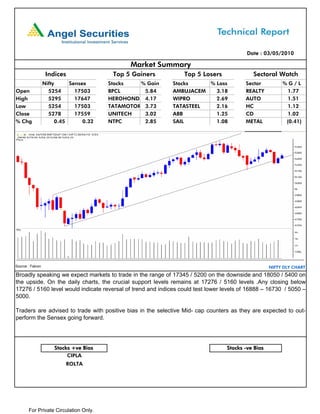
  • 1. Date : 03/05/2010 Market Summary Indices Top 5 Gainers Top 5 Losers Sectoral Watch Nifty Sensex Stocks % Gain Stocks % Loss Sector %G/L Open 5254 17503 BPCL 5.84 AMBUJACEM 3.18 REALTY 1.77 High 5295 17647 HEROHONDA 4.17 WIPRO 2.69 AUTO 1.51 Low 5254 17503 TATAMOTOR 3.73 TATASTEEL 2.16 HC 1.12 Close 5278 17559 UNITECH 3.02 ABB 1.25 CD 1.02 % Chg 0.45 0.32 NTPC 2.85 SAIL 1.08 METAL (0.41) Source : Falcon NIFTY DLY CHART Broadly speaking we expect markets to trade in the range of 17345 / 5200 on the downside and 18050 / 5400 on the upside. On the daily charts, the crucial support levels remains at 17276 / 5160 levels .Any closing below 17276 / 5160 level would indicate reversal of trend and indices could test lower levels of 16888 – 16730 / 5050 – 5000. Traders are advised to trade with positive bias in the selective Mid- cap counters as they are expected to out- perform the Sensex going forward. Stocks +ve Bias Stocks -ve Bias CIPLA ROLTA For Private Circulation Only.
  • 2. PIVOTS Stocks Close S2 S1 Pivot R1 R2 SENSEX 17559.00 17426.00 17493.00 17570.00 17636.00 17713.00 NIFTY 5278.00 5235.00 5257.00 5276.00 5297.00 5316.00 ABB 792.00 757.00 775.00 792.00 810.00 828.00 ACC 905.00 871.00 888.00 899.00 916.00 927.00 AMBUJACEM 121.00 117.00 119.00 121.00 123.00 126.00 AXISBANK 1270.00 1250.00 1260.00 1273.00 1283.00 1296.00 BHARTIARTL 299.00 292.00 295.00 299.00 302.00 306.00 BHEL 2492.00 2448.00 2470.00 2503.00 2526.00 2559.00 BPCL 518.00 481.00 499.00 510.00 529.00 540.00 CAIRN 316.00 309.00 312.00 315.00 319.00 321.00 CIPLA 343.00 331.00 337.00 341.00 347.00 351.00 DLF 311.00 305.00 308.00 312.00 315.00 319.00 GAIL 429.00 412.00 421.00 426.00 434.00 439.00 HCLTECH 394.00 375.00 385.00 391.00 401.00 408.00 HDFC 2814.00 2762.00 2788.00 2823.00 2849.00 2884.00 HDFCBANK 2000.00 1971.00 1986.00 1998.00 2013.00 2025.00 HEROHONDA 1915.00 1799.00 1857.00 1898.00 1956.00 1997.00 HINDALCO 179.00 176.00 177.00 179.00 181.00 183.00 HINDUNILVR 240.00 234.00 237.00 239.00 242.00 244.00 ICICIBANK 952.00 937.00 945.00 955.00 962.00 972.00 IDEA 61.00 60.00 60.00 61.00 62.00 63.00 IDFC 171.00 166.00 168.00 170.00 172.00 174.00 INFOSYSTCH 2738.00 2643.00 2691.00 2725.00 2772.00 2806.00 ITC 266.00 263.00 264.00 267.00 268.00 270.00 JINDALSTEL 743.00 729.00 736.00 744.00 751.00 758.00 JPASSOCIAT 148.00 145.00 147.00 148.00 149.00 151.00 KOTAKBANK 739.00 723.00 731.00 738.00 745.00 752.00 LT 1615.00 1591.00 1603.00 1614.00 1626.00 1637.00 M&M 526.00 513.00 520.00 526.00 532.00 538.00 MARUTI 1280.00 1260.00 1270.00 1285.00 1295.00 1310.00 NTPC 208.00 201.00 204.00 207.00 210.00 212.00 ONGC 1055.00 1023.00 1039.00 1050.00 1066.00 1077.00 PNB 1040.00 1015.00 1027.00 1037.00 1050.00 1060.00 POWERGRID 110.00 109.00 109.00 110.00 111.00 112.00 RANBAXY 443.00 436.00 440.00 444.00 448.00 452.00 RCOM 164.00 160.00 162.00 165.00 167.00 171.00 RELCAPITAL 739.00 725.00 732.00 741.00 749.00 758.00 RELIANCE 1034.00 1020.00 1027.00 1037.00 1044.00 1054.00 RELINFRA 1137.00 1108.00 1123.00 1141.00 1155.00 1173.00 RPOWER 163.00 160.00 162.00 164.00 165.00 167.00 SAIL 218.00 212.00 215.00 220.00 223.00 227.00 SBIN 2301.00 2261.00 2281.00 2300.00 2320.00 2339.00 SIEMENS 712.00 694.00 703.00 710.00 719.00 726.00 STER 828.00 814.00 821.00 830.00 837.00 846.00 SUNPHARMA 1571.00 1468.00 1520.00 1562.00 1614.00 1656.00 SUZLON 69.00 67.00 68.00 69.00 70.00 70.00 TATAMOTORS 873.00 832.00 852.00 865.00 886.00 899.00 TATAPOWER 1358.00 1333.00 1346.00 1360.00 1373.00 1387.00 TATASTEEL 619.00 597.00 608.00 626.00 637.00 655.00 TCS 765.00 757.00 761.00 767.00 771.00 777.00 UNITECH 85.00 83.00 84.00 85.00 86.00 87.00 WIPRO 672.00 653.00 662.00 679.00 688.00 705.00 For Private Circulation Only.
  • 3. RESEARCH TEAM Shardul Kulkarni Head - Technicals Ajit Joshi AVP - TAS Brijesh Ail Manager - TAS Mileen Vasudeo Technical Analyst For any Queries, Suggestions and Feedback kindly mail to vasudeo.kamalakant@angeltrade.com Research Team: 022-3952 6600 Website: www.angelbroking.com DISCLAIMER: This document is not for public distribution and has been furnished to you solely for your information and must not be reproduced or redistributed to any other person. Persons into whose possession this document may come are required to observe these restrictions. Opinion expressed is our current opinion as of the date appearing on this material only. While we endeavor to update on a reasonable basis the information discussed in this material, there may be regulatory, compliance, or other reasons that prevent us from doing so. Prospective investors and others are cautioned that any forward-looking statements are not predictions and may be subject to change without notice. Our proprietary trading and investment businesses may make investment decisions that are inconsistent with the recommendations expressed herein. The information in this document has been printed on the basis of publicly available information, internal data and other reliable sources believed to be true and are for general guidance only. While every effort is made to ensure the accuracy and completeness of information contained, the company takes no guarantee and assumes no liability for any errors or omissions of the information. No one can use the information as the basis for any claim, demand or cause of action. Recipients of this material should rely on their own investigations and take their own professional advice. Each recipient of this document should make such investigations as it deems necessary to arrive at an independent evaluation of an investment in the securities of companies referred to in this document (including the merits and risks involved), and should consult their own advisors to determine the merits and risks of such an investment. Price and value of the investments referred to in this material may go up or down. Past performance is not a guide for future performance. Certain transactions - futures, options and other derivatives as well as non-investment grade securities - involve substantial risks and are not suitable for all investors. Reports based on technical analysis centers on studying charts of a stock's price movement and trading volume, as opposed to focusing on a company's fundamentals and as such, may not match with a report on a company's fundamentals. We do not undertake to advise you as to any change of our views expressed in this document. While we would endeavor to update the information herein on a reasonable basis, Angel Broking, its subsidiaries and associated companies, their directors and employees are under no obligation to update or keep the information current. Also there may be regulatory, compliance, or other reasons that may prevent Angel Broking and affiliates from doing so. Prospective investors and others are cautioned that any forward-looking statements are not predictions and may be subject to change without notice. Angel Broking Limited and affiliates, including the analyst who has issued this report, may, on the date of this report, and from time to time, have long or short positions in, and buy or sell the securities of the companies mentioned herein or engage in any other transaction involving such securities and earn brokerage or compensation or act as advisor or have other potential conflict of interest with respect to company/ies mentioned herein or inconsistent with any recommendation and related information and opinions. Angel Broking Limited and affiliates may seek to provide or have engaged in providing corporate finance, investment banking or other advisory services in a merger or specific transaction to the companies referred to in this report, as on the date of this report or in the past. Sebi Registration No : INB 010996539 For Private Circulation Only.