1. Page 1 of 1
Water Conservation
Order No. 577.100-5
Revised October 2001
Agdex 561
CROP COEFFICIENTS FOR USE IN
IRRIGATION SCHEDULING
Crop water use information can be used to schedule irrigation systems. Crop water use is directly related to
evapotranspiration (ET). The ET information must be adjusted to correspond to the crop and climate. This
factsheet provides information on selecting the crop coefficient that should be used.
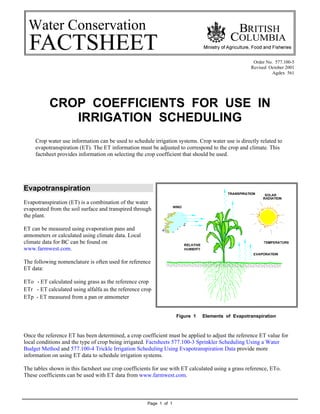
Evapotranspiration
Evapotranspiration (ET) is a combination of the water
evaporated from the soil surface and transpired through
the plant.
ET can be measured using evaporation pans and
atmometers or calculated using climate data. Local
climate data for BC can be found on
www.farmwest.com.
The following nomenclature is often used for reference
ET data:
ETo - ET calculated using grass as the reference crop
ETr - ET calculated using alfalfa as the reference crop
ETp - ET measured from a pan or atmometer
Figure 1 Elements of Evapotranspiration
Once the reference ET has been determined, a crop coefficient must be applied to adjust the reference ET value for
local conditions and the type of crop being irrigated. Factsheets 577.100-3 Sprinkler Scheduling Using a Water
Budget Method and 577.100-4 Trickle Irrigation Scheduling Using Evapotranspiration Data provide more
information on using ET data to schedule irrigation systems.
The tables shown in this factsheet use crop coefficients for use with ET calculated using a grass reference, ETo.
These coefficients can be used with ET data from www.farmwest.com.
2. Page 2 of 2
Crop Water Use
Crop water use is directly related to ET. The crop’s water use can be determined by multiplying the reference ETo by
a crop coefficient (Kc). The crop coefficient adjusts the calculated reference ETo to obtain the crop
evapotranspiration ETc. Different crops will have a different crop coefficient and resulting water use.
ETc = ETo x Kc (Equation 1)
Where ETo = calculated reference ET for grass (mm)
available from www.farmwest.com
Kc = crop coefficient
ETc = crop evapotranspiration or crop water use (mm)
Crop Coefficients
The reference ET is a measurement of the water use for that reference crop. In the case of ETo grass is used as the
reference. However other crops may not use the same amount of water as grass due to changes in rooting depth, crop
growth stages and plant physiology. The crop coefficient (Kc) takes into account the crop type and crop development
to adjust the ETo for that specific crop. There may be several crop coefficients used for a single crop throughout an
irrigation season depending on the crop’s stage of development.
Crop coefficients may also vary depending on how the evapotranspiration data has been calculated or obtained.
Reference ET
Reference ET is calculated using climatic data obtained from a weather station.
ETo is calculated to simulate a grass reference crop. Alfalfa may also be used as a
reference crop in some areas and may be referred to as ETr. As a result there are different
types of crop coefficients that may be used in the literature. Crop coefficients developed
using grass as the reference crops will be larger than those using alfalfa, because ET from
alfalfa is greater. The reference ETo obtained from www.farmwest.com is calculated for
a grass reference crop.
If using crop coefficients or reference ET values from other sources make sure the Kc
value and ET have been developed for use with the same reference crop.
Pan Evaporation
Atmometers and evaporation pans also provide ET data.
If the ET data used is obtained from a pan or atmometer
a pan crop coefficient will have to be applied to convert
the pan evaporation ETp to a crop water use ETc.
Figure 2 Weather Station
from Davis Instruments
Figure 3 Evaporation Pan and Atmometer
3. Page 3 of 3
Converting Crop Coefficients
Crop coefficients based on an alfalfa reference or pan reference can be converted for use with a grass reference by
using the factors shown in Table 1.
The factors shown are for semi arid, moderately windy conditions. For humid, calm conditions the values will be 10%
less and for arid windy conditions the values will be 10% more. For most British Columbia summer conditions the
factors in the table can be used.
Table 1 Guide to Converting Crop Coefficients
Based on Reference ET Used
Crop Coefficient Conversion Multiply by:
Kc - grass (ETo) to Kc alfalfa (ETr) 0.83
Kc - grass (ETo) to Kc - pan (ETp) 0.80
Kc - pan (ETp) to Kc – alfalfa (ETr) 1.04
EXAMPLE The Kc value for raspberries in mid
season is 1.2 if using a reference ETo for grass. See
Table 3.
To convert this Kc value for use with an alfalfa
reference ETr multiply the value by 0.83. The crop
coefficient for use with an alfalfa reference ETo is:
Kc (ETr) = 1.2 x 0.83 = 1.0
Crop Water Use and Stages of Growth
Crop growth periods can be divided into four
distinct growth stages; initial, crop development,
mid season and late season. See Figure 4. The
length of each of these stages depends on the
climate, latitude, elevation and planting date.
Local observations are best for determining the
growth stage of the crop and which Kc values to
use.
For annual crops, during the crop’s germination
and establishment, most of the ET occurs as
evaporation from the soil surface. As the foliage
develops evaporation from the soil surface
decreases and transpiration increases. For
perennial crops a similar pattern may occur as
the plant starts to leaf out, grow new shoots and
develop fruit. The percentage of canopy cover
will determine the rate of evapotranspiration
(ET). Maximum ET occurs when the canopy
cover is about 60-70% for tree crops and 70-
80% for field and row crops. The maximum canopy cover often coincides with the time of year that sun radiation and
air temperature are at their greatest. The maximum ET therefore occurs during mid season.
During the crop development stage there are no set Kc values. If irrigating during this period choose a Kc value that is
between Kcini and Kcmid. A similar approach should be taken for the time period between Kcmid and Kcend. However
this time period may be much shorter and a jump directly from Kcmid to Kcend could be taken.
Table 2 provides a description of the various plant growth stages. These stages can be used to select an appropriate
crop coefficient from the following Tables.
Figure 4 Crop Coefficients and Crop Development Stages
4. Page 4 of 4
Table 2 Crop Stage of Development
Stage Indicators Crop Coefficient
Initial
Planting date (or the start of new leaves for perennials) to 10% ground
cover.
Kcini
Crop
development
10% ground cover to effective full cover, about 60-70% coverage for
tree crops and 70-80% for field and row crops.
Kcini - Kcmid
Mid season
Effective full cover to maturity, indicated by yellowing of leave, leaf
drop, browning of fruit.
This stage is long for perennials but relatively short for vegetables crops
that are harvested for their fresh fruit.
Kcmid
Late Season
Maturity to harvest: the Kc value could be high if the crop is irrigated
frequently until fresh harvest or low if the crop is allowed to dry out in
the field before harvest.
Kcmid - Kcend
Select a Crop Coefficient
The crop coefficients in Tables 3 and 4 can be used as a general guideline for British Columbia. The crop coefficients
are to be used for a grass reference ETo. The crops should be of average height, well watered and well managed.
Vegetable and Berry Crops
Table 3 provides crop coefficients for various
vegetable and berry crops for different stages of the
growing season.
Crop coefficients for many vegetables may not be
available. It is possible to estimate the crop coefficient
at the peak time of year for some crops using the ratio
of bed width to canopy cover. Comparing crop
coefficients of other crops that are similar in nature
may also be useful.
Kc = Wp/Wb (Equation 2)
Where Kc = crop coefficient
Wp = width of plant canopy
Wb = bed spacing
Figure 5 Vegetable Canopy Measurement
5. Page 5 of 5
Table 3 Crop Coefficients for Forage, Vegetables and Berries
Crop Kcini Kcmid Kcend
alfalfa 0.4 1.2 1.15
asparagus 0.3 0.95 0.3
beans, green 0.5 1.05 0.9
beets 0.5 1.05 0.95
blueberries 0.4 1.0 0.75
broccoli 0.7 1.05 0.95
cabbage 0.7 1.05 0.95
cabbage -local 0.7 1.05 0.95
carrots 0.7 1.05 0.95
cauliflower 0.7 1.05 0.95
cranberries 0.4 0.9 0.50
celery 0.7 1.05 0.95
cereal 0.3 1.15 0.25
corn 0.3 1.15 0.4
cucumber 0.6 1 0.75
green onions 0.7 1.05 0.95
lettuce 0.7 1 0.95
Crop Kcini Kcmid Kcend
onions 0.7 1.05 0.95
pasture (grass) 0.4 1.0 0.85
peas 0.5 1.15 1.1
potato 0.5 1.15 0.75
pumpkin 0.5 1 0.8
radish 0.7 0.9 0.85
raspberries 0.4 1.2 0.75
small vegetables 0.70 1.05 0.95
spinach 0.7 1.05 0.95
strawberries 0.4 1.05 0.7
squash 0.5 0.95 0.75
sweet corn 0.3 1.15 0.4
sweet peppers 0.7 1.05 0.85
tomato 0.7 1.05 0.8
tubers 0.5 1.05 0.95
watermelon 0.4 1 0.75
Alfalfa and Other Forage Crops
Many forage or hay crops are harvested several times
during the growing season. These crops will
therefore have a new growth stage cycle for each cut.
Instead of one Kc curve for the entire season as in
Figure 4, these crops would have a series of curves to
make up the entire growing season. See Figure 6.
Immediately after a cutting the crop coefficient
would revert to Kcini, 0.3 and the Kcend would end at
the next harvest date.
The growth stages for the second and third cuts may
be shorter than the first cut or the fourth cut. This is
because the heat units that are available during the
warmer summer months would speed up the growth.
Growth during the early spring and fall would be shorter.
The crop coefficient for forage crops are shown in Table 3.
Figure 6 – Growth cycle for forage crops with more
than one cut
6. FOR FURTHER INFORMATION CONTACT RESOURCE MANAGEMENT BRANCH
Ted Van der Gulik, Senior Engineer Janine Nyvall, Water Management Engineer Ministry of Agriculture, Food and Fisheries
Phone: (604) 556-3112 Phone: (604) 556-3113 1767 Angus Campbell Road
Email: Ted.vanderGulik@gems8.gov.bc.ca Janine.Nyvall@gems5.gov.bc.ca Abbotsford, BC CANADA V3G 2M3
Page 6 of 6
Apples and Grapes
Crop coefficients for tree fruits and grapes have been segregated into months as shown in Table 4. The absence of a
cover crop will lower the crop coefficients shown. The cover crop draws water from the soil storage reservoir and
therefore increases water use. If there is no cover crop or grass between the tree or plant rows the crop coefficients
will be about 10% lower in May, September and October and 20% lower in June, July and August.
Table 4 Crop Coefficients for Tree Fruit and Grapes
Crop May June July Aug Sept. Oct.
Apples Cherries and Pears with cover crops*
Lower Mainland / Vancouver Isl. 0.7 0.9 1.00 1.00 0.95 0.75
Okanagan / Thompson 0.85 1.15 1.25 1.25 1.2 .95
Kootenays 0.8 1.10 1.20 1.20 1.15 0.7
Apricots, Peaches and other Stone Fruit with cover crops*
Lower mainland / Vancouver Isl. 0.9 1.0 1.0 1.0 0.95 0.8
Okanagan / Thompson 0.80 1.10 1.20 1.20 1.15 0.9
Kootenays 0.70 1.00 1.05 1.10 1.00 0.8
Grapes
Lower mainland / Vancouver Isl. 0.55 0.65 0.65 0.65 0.65 0.50
Okanagan / Thompson 0.50 0.70 0.80 0.85 0.80 0.70
Kootenays 0.45 0.70 0.85 0.90 0.80 0.70
* No Cover crop – reduce values by 10% 20% 20% 20% 10% 10%
Soil moisture monitoring devices can be used to adjust crop coefficients to match local conditions. See Factsheet
577.100-2 Irrigation Scheduling with Tensiometers for additional information.