2. cationic or polar species, and is expressed by cation exchange capacity
(CEC) parameter. It is generally known, that the CEC value significantly
influences the way how the organic species are distributed in the
interlayer space (Bujdák, 2006). Relationship between the value of CEC
and the distribution of methylene blue at the surface of montmorillo-
nites with reduced layer charge was shown by Bujdák and Komadel
(1997). This study confirmed that high CEC value promotes the
formation of methylene blue aggregates, while low CEC value rather
maintain the dye in monomeric form. This behavior can be explained in
terms of different intermolecular distances, which are shorter for high
CEC values, and longer for lower CEC values. It was shown that the
ratio between monomeric and aggregated form of methylene blue can
be controlled by the CEC, and thus the methylene blue was later used as
a probe with the ability to determine the CEC values of clay minerals
(Czímerova et al., 2006).
The orientational behavior of dicationic porphyrins at the surface of
Sumecton SA (Sap) in various solvents has been studied by Eguchi et al.
(2013). Within this study, it was found that the porphyrin molecule is
oriented in parallel fashion with respect to surface of clay mineral, if the
used solvent is protic, and in tilted fashion, if the solvent is aprotic. The
main parameter responsible for different orientational behavior is the
ability of the solvents to form H-bonds. This statement was proved by
the thermodynamic study which showed that the hydrophobic interac-
tion between porphyrin hydrophobic moiety and the clay mineral
surface is more effective in protic and not effective in aprotic solvent.
We believe that in terms of orientational change the PIC molecule
behaves in similar fashion like previously described porphyrin mole-
cule. The switching between PIC monomers and PIC J-aggregates
intercalated in the interlayer space of Sap has been already realized
in our previous study (Matejdes et al., 2017). Switching strategy is
based on simple adding and removing the DMSO molecules from the
interlayer space. Presence of DMSO molecules in the interlayer space
increases the height of the interlayer space and also induces orienta-
tional change of PIC molecules which may result in effective excitonic
coupling, or in other words, in the formation of J-aggregates. In this
work, two different smectite type clay minerals were used, Ste and Mt.
They differ not only in their particle size and CEC, but also in their
structure. Ste has trioctahedral structure and the isomorphic substitu-
tions are located in the tetrahedral sheet, whereas Mt has dioctahedral
structure with the isomorphic substitutions located in the octahedral
sheet (Brigatti et al., 2013). The objective of this work is to demonstrate
the effect of negative charge density on the formation of PIC J-
aggregates after swelling with DMSO, and to compare these results
with results obtained for Sap in our previous study. We assume that the
presented results will be a good basis for the future development of
practical systems with controllable properties.
2. Experimental details
PIC, DMSO, hexane and ethyl alcohol (EtOH) were purchased from
Tokyo Chemical Industry Company and used as received. The de-
ionized water was purified with a Milli-Q system (Millipore). For the
construction of the thin films were used Ste and Mt. These layered
silicates (LS) were obtained from Kunimine Industries, Tokyo, Japan,
and were used as received without any further purification. According
to the product characterization data sheet the average particle diameter
of Ste is about 40 nm. The diameter of the Mt particles is larger and fell
in the range 300–1000 nm. The cation exchange CEC of Ste and Mt are
0.40 and 1.15 meq/g, respectively (Kunimine Industries Co. Ltd.;
Kakegawa et al., 2003). The hybrid films were prepared with PIC
loading levels 10%, 30%, 50% and 70% of PIC amount vs. the CEC of
used LS. In the first step, an appropriate volume of DMSO solution of
PIC (5 × 10− 5
M) was gradually added to LS dispersion prepared by
20 min ultra-sonication. The amounts of used LS and PIC in the final
dispersion volume (100 mL) are listed in Table 1. In the second step, the
resulting PIC/LS dispersion was subsequently filtered through a PTFE
membrane filter with 0.1 μm pore size. In every loading level the
filtrate was colorless, and thus we assume that due to the high affinity
of PIC toward LS surface, the ion exchange reaction was 100%
completed. In the third step after filtration, the prepared thin film
was transferred from membrane onto the surface of UV–Vis transparent
quartz glass slide. The quartz glass was cleaned prior to use by
sonication in water for 1 h, then cleaned with 1 M sulphuric acid
solution and finally washed with large amount of deionized water to
remove the excess of SO4
2−
. Prepared thin films samples were after-
wards dried at 70 °C for 20 min. The swelling step was carried out by
dropping 10 μl of DMSO onto the surface of prepared hybrid film.
DMSO was removed from the interlayer space of prepared hybrid film
by washing the sample with 500 μl of EtOH. Remaining EtOH was
subsequently removed by drying at 70 °C for 2 min.
Absorption spectra were recorded using a V-670 UV–Vis-NIR double
beam absorption spectrophotometer (Jasco Co., Ltd.). UV–Vis spectrum
of the prepared sample was measured in three steps: (i) right after the
sample was prepared, (ii) after swelling with DMSO while the sample
was immersed in hexane and (iii) after the sample was washed with
EtOH and dried. The basal reflection of the sample (before and after
swelling with DMSO) was measured using a multipurpose X-ray
diffractometer Ultima IV (Rigaku Co., Ltd.) in the in-plane mode. For
this purpose a 2θ range from 2° to 10°, using a step of 0.05° 2θ operating
at 40 kV and 40 mA with CuKα radiation was used. The UV–Vis
absorption and XRD measurements were performed at room tempera-
ture.
In order to compare the effect of layered silicate on the J-aggregates
formation, the negative layer charge has been calculated. Details of the
calculation method are reported elsewhere (Bujdák and Iyi, 2008). The
ratio between monomeric and J-aggregated PIC molecules in Mt films
has been evaluated with SVD-ALS algorithm by analyzing data obtained
from UV–Vis measurements (Maeder, 2007).
3. Results and discussion
3.1. PIC J-aggregates
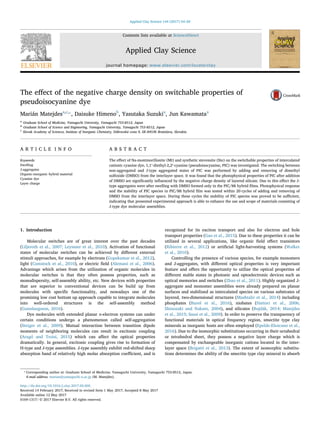
The photograph of prepared PIC/Ste and PIC/Mt hybrid films is
shown in Fig. 1 and indicates relatively high transparency of the film
suitable for absorption measurements in the UV–Vis region.
Table 1
Composition of the final suspensions.
Ste Mt
CEC loading level (%) 10, 30 50, 70 10, 30 50, 70
weight of LS (mg) 0.690 0.345 0.240 0.120
amount of PIC
(10−5
mmol)
2.76a
/
8.28b
6.90c
/
9.66d
2.76a
/
8.28b
6.90c
/
9.66d
a
10% CEC loading level.
b
30% CEC loading level.
c
50% CEC loading level.
d
70% CEC loading level.
Fig. 1. Photograph of (A) PIC/Ste and (B) PIC/Mt thin films prepared at 70% CEC loading
level.
M. Matejdes et al. Applied Clay Science 144 (2017) 54–59
55
3. The molar absorption coefficients of PIC/Mt hybrid film in air
(before and after swelling with DMSO) at the PIC loading level 10% of
CEC compared with solution of PIC in DMSO are shown in Fig. 2. The
spectral integral values reached comparable levels (PIC/Mt film before
swelling = 0.60 L mol− 1
, PIC/Mt after swelling = 0.59 L mol−1
and
PIC solution = 0.53 L mol− 1
). The two highest molar absorption
coefficients of PIC in DMSO solution were located at 530 nm
(ε = 83,800 L mol−1
cm−1
) and 498 nm (ε = 55,000 L mol−1
cm−1
),
accompanied by vibronic shoulder in shorter wavelength region. These
transitions are assigned to PIC monomeric molecules (Würthner et al.,
2011), and in the case of PIC/Mt hybrid film these monomer bands are
slightly shifted to shorter wavelengths, specifically to 529 nm and
491 nm. Observed spectral shifts are related to the adsorption of PIC
onto the Mt particles. It is known, that the surface of LS is less polar
than DMSO (Schoonheydt and Johnston, 2013), and thus the observed
shift can be explained by a change in the polarity of the surroundings.
The molar absorption coefficients of PIC/Mt hybrid film, prepared at
10% CEC loading level, before swelling with DMSO revealed an
emerging shoulder in the 560–580 nm region, which according to
Bujdák and Iyi (2008) corresponds to PIC J-aggregate. The PIC J-
aggregate band located at 575 nm (ε = 168,000 L mol−1
cm−1
) be-
came sharper and more intense after the PIC/Mt hybrid film was
swollen with DMSO.
The phenomenon of PIC J-aggregates formation was already
observed in aqueous solution with high PIC concentration indepen-
dently by Jelley (1936) and Scheibe et al. (1937) 80 years ago. They
came to the conclusion that this considerable spectral change is a result
of the vicinity effect of the adjacent PIC molecules and as such can be
effectively mimicked in the interlayer space of LS.
3.2. Effect of the LS and CEC loading level on the formation of PIC J-
aggregates
The molar absorption coefficients of PIC/Ste and PIC/Mt hybrid
films at various CEC loading levels were measured in time, and they are
shown in Figs. 3 and 4. The inclusion of time parameter in these
measurements is important because this parameter is able to reveal any
ongoing changes occurring in studied samples. In our previous study
(Matejdes et al., 2017) it was found that the immersion of the sample
into hexane was essential because the formation of PIC J-aggregates
without hexane was only temporary in the order of few tens of minutes.
It was found, that after swelling with DMSO the molar absorption
coefficients of PIC/Ste samples retain comparable spectral response
over all tested CEC loading levels (Fig. 3a and b). As compared to
UV–Vis measurements obtained for PIC/Sap, the formation of PIC J-
aggregates for the case of PIC/Ste thin films wasn't observed. To
estimate the organization of PIC molecules in the interlayer space, an
X-ray diffraction (XRD) measurement was performed to obtain informa-
tion about changes in the first basal reflection. The thickness of the
interlayer space occupied with PIC cations was calculated as the
difference between the measured basal spacing and the known thick-
ness of the LS layer (0.96 nm). The results of this calculation with
respect to the CEC loading level are shown in Fig. 5. Considering the
thickness of the PIC molecule (approx. 0.51 nm) the orientation of the
PIC in the Ste interlayer space before swelling with DMSO is almost
parallel to the Ste layers as uniform monolayer at all CEC loading levels,
without any overlap between adjacent PIC molecules. The experimental
results obtained from UV–Vis measurements of PIC/Ste samples after
swelling with DMSO didn't prove the existence of PIC J-aggregates,
even if the interlayer space increased to about 0.95 nm (Fig. 5a).
Compared to our previous study (Matejdes et al., 2017), significant PIC
J-aggregate formation was observed by UV–Vis measurements in PIC/
Sap films at 569 nm, whereas the absence of J-aggregates in PIC/Ste
films can be explained in terms of different negative charge densities.
Based on the calculated negative charge density in Ste and Sap, which
are 0.31 and 0.55 e/nm2
, respectively, can be assumed that the
formation of PIC J-aggregates in PIC/Sap films is a consequence of
shorter distance between adjacent PIC molecules, enabling their
effective excitonic coupling.
The molar absorption coefficients of PIC/Mt at various CEC loading
levels are shown in Fig. 4a and b. Interestingly, the PIC J-aggregates
were already stable in PIC/Mt samples prepared at 30%, 50% and 70%
CEC loading before swelling with DMSO. With increasing CEC loading
level the band located at 575 nm belonging to PIC J-aggregate became
more intense. Compared to our previous results obtained from PIC/Sap
films is the band in PIC/Mt samples prepared at higher CEC loading
levels relatively broad. The thickness of the interlayer space of PIC/Mt
samples before swelling with DMSO (Fig. 5b) obtained from XRD
measurements revealed that the overlap of adjacent PIC molecules is
more significant, than in the case of PIC/Sap samples. This observation
is in accordance with the calculated negative charge density, which is
for Mt 0.89 e/nm2
.
In order to describe the changes caused by the presence and absence
of DMSO molecules in the interlayer space of PIC/Mt films in more
detail, the ratio between monomeric and J-aggregated PIC molecules
(Fig. 6) in these films has been evaluated from UV–Vis measurements
by using SVD-ALS algorithm (Maeder, 2007). The results of this analysis
show that the ratio between PIC molecules in monomeric and J-
aggregated state prior to swelling is with increasing CEC loading level
gradually decreasing, indicating the tendency of PIC molecules to
become a part of J-aggregate structure. The observed tendency is
consistent with J-aggregate maxima shift from 564 nm (10% CEC) to
575 nm (70% CEC), and thus, according to theory proposed by
Czikklely et al. (1970), we assume, that the J-aggregate structure in
PIC/Mt samples prior to swelling with DMSO is increasing in size with
respect to increasing CEC loading level. The size effect of J-aggregates is
also noticeable in the XRD measurements. At 10% CEC loading level the
thickness of the interlayer space is about 0.55 nm. This value is slightly
higher than the thickness of PIC molecule (0.51 nm) implying the
presence of J-aggregated structures consisting from small amount of
PIC molecules, most probably J-dimers.
Until this point we haven't discussed the effect of the Mt particle size
on the properties of PIC J-aggregates. Miyamoto et al. (2000) assumed
that the particle size of LS could play an important role in the formation
of the PIC J-aggregates. The larger the diameter of LS layers, the bigger
the size of the J-aggregates can be theoretically achieved. The size of Mt
particles is non-uniform, with diameters ranging from 300 nm up to
1000 nm. The particle size distribution of Sap is compared to Mt much
more narrow, and therefore the PIC J-aggregates in PIC/Sap films
consists of approximately the same number of PIC molecules, while the
Fig. 2. Molar absorption coefficients of the PIC/Mt hybrid film at 10% loading vs CEC
before swelling (black solid line), after swelling with DMSO (red dashed line) and PIC
solution in DMSO (blue dash-dotted line). (For interpretation of the references to colour
in this figure legend, the reader is referred to the web version of this article.)
M. Matejdes et al. Applied Clay Science 144 (2017) 54–59
56
4. PIC J-aggregates in PIC/Mt films could be composed from different
number of PIC molecules reflecting the size of the Mt particle. At this
point we assume that broad band in PIC/Mt samples prepared at higher
CEC loading levels is a result of the large particle size distribution of Mt
which enables the presence of PIC J-aggregates with different optical
properties. After swelling with DMSO a significant formation of PIC J-
aggregates was observed for PIC/Mt samples with 10% and 30% CEC
loading levels (Fig. 6) and the interlayer space increased to about
0.97 nm (Fig. 5b). In the case of PIC/Sap samples an increase to
1.32 nm was observed indicating higher DMSO accumulation ability.
The highest molar absorption coefficient of the PIC J-aggregate was
located at 575 nm and compared to PIC/Sap samples it was shifted to
longer wavelength by 6 nm. We assume that the difference between
molar absorption coefficient maxima of PIC J-aggregates in Mt and Sap
films can be explained on the basis of extended dipole model theory
proposed by Czikklely et al. (1970) According to the theory, it is
possible to analyze two-dimensional closely-arranged structures such as
brickwork model (Würthner et al., 2011), and also to predict absorption
maximum of aggregation structures on the basis of transition dipole
moment interaction energies between individual molecules located in
the aggregation structure. This theory is also able to deliver information
about the size of the aggregation structure, or in other words, it is able
to estimate the number of molecules in this structure. The absorption
maximum and the size of the aggregation structure are proportionally
dependent, and therefore we suppose that the observed difference
between absorption maxima of PIC J-aggregates in Mt and Sap films
Fig. 3. Molar absorption coefficients of PIC/Ste hybrid films (CEC loading levels are indicated in figures). (A) Spectra taken before swelling (black solid line, t = 0 min), after swelling
(red dashed line, t = 180 min) and after DMSO removal by washing and drying process (blue dash-dotted line, t = 290 min). (B) Molar absorption coefficients obtained from time UV–Vis
absorption measurements (Δt = 10 min). The colour coded z-axis represents the molar absorption coefficient (L mol−1
cm− 1
). Times when DMSO was applied and removed by washing
and drying process are indicated by vertical black lines, which divide the data matrices into 3 sections. First section contains measurements which were obtained prior to swelling with
DMSO. The measurements in the second section were obtained after swelling with DMSO, while the sample was immersed in hexane. The third section contains measurements which were
taken after the sample was washed with EtOH and dried at 70 °C for 5 min. (For interpretation of the references to colour in this figure legend, the reader is referred to the web version of
this article.)
Fig. 4. Molar absorption coefficients of PIC/Mt hybrid films (CEC loading levels are indicated in figures). (A) Spectra taken before swelling (black solid line, t = 0 min), after swelling
(red dashed line, t = 180 min) and after DMSO removal by washing and drying process (blue dash-dotted line, t = 290 min). (B) Molar absorption coefficients obtained from time UV–Vis
absorption measurements (Δt = 10 min). The colour coded z-axis represents the molar absorption coefficient (L mol− 1
cm− 1
). White area represents a cutoff plane which was applied at
100.000 L mol−1
cm− 1
. Times when DMSO was applied and removed by washing and drying process are indicated by vertical black lines, which divide the data matrices into 3 sections.
First section contains measurements which were obtained prior to swelling with DMSO. The measurements in the second section were obtained after swelling with DMSO, while the
sample was immersed in hexane. The third section contains measurements which were taken after the sample was washed with EtOH and dried at 70 °C for 5 min. (For interpretation of
the references to colour in this figure legend, the reader is referred to the web version of this article.)
M. Matejdes et al. Applied Clay Science 144 (2017) 54–59
57
5. after swelling with DMSO might be attributed to the J-aggregate size
effect. On the other hand, the broad J-aggregate band can be also
explained in the terms of Davydov splitting (1964), which results from
the presence of the J-aggregate with oblique structure. The reason for
the formation of J-aggregates with oblique structure is at this stage
unknown to us, but we assume that it may be caused by the layer charge
location, which is in the case of Mt localized in octahedral sheet, or by
the presence of dioctahedral vacancies. In the case of PIC/Mt samples
prepared at higher CEC loadings an increase of the interlayer space
after swelling with DMSO was observed only for the sample with 50%
CEC loading level (Fig. 5b). The sample with 70% CEC loading level
didn't swell at all, and it might suggest that the interlayer space became
too hydrophobic with the increase of CEC loading, and thus the change
in the thickness of the interlayer space wasn't due to absence of the
DMSO molecules in the interlayer space observed. From Fig. 4a can be
seen that after swelling the molar absorption coefficients of PIC/Mt
sample prepared at 70% CEC loading retain the same shape as before
swelling indicating that the composition and arrangement of the PIC
molecules after swelling didn't change, which is in agreement with the
results obtained from XRD measurement. The absence of DMSO
molecules has been also proved by the SVD-ALS analysis (Fig. 6)
showing no significant difference between the PIC molecule ratios
before and after swelling. Interesting feature of PIC/Mt films prepared
at 10% and 30% CEC loading levels was that the formation of PIC J-
aggregates was significantly enhanced after swelling with DMSO. After
removing the DMSO molecules with EtOH and drying their molar
absorption coefficients retain similar shape as to that which was
observed prior to application of DMSO (Fig. 4a). This behavior indicates
swelling reversibility, because removal of DMSO molecules from the
interlayer space results in the return of PIC species to their initial state.
3.3. Switching properties of PIC/Mt film
In the previous subsection was shown that the presence of the PIC
species, specifically PIC J-aggregates and PIC monomers, in the
interlayer space of Mt can be controlled by adding and removing of
DMSO. The most suitable sample for the demonstration purposes of
switching properties is the PIC/Mt sample prepared at 10% CEC loading
level. Fig. 7 shows the variation in the absorbance recorded at 575 nm.
The observed variation is a consequence of repeating steps during
which the sample was swollen with DMSO, washed with EtOH and
dried. After swelling with DMSO the absorbance at 575 nm reached
values around 0.9 indicating presence of PIC J-aggregates. The absor-
bance decreased to values about 0.1 after the PIC molecules rearranged
to monomers as a consequence of the removal of the DMSO molecules
from the interlayer space of Mt by application of EtOH washing with
consequent drying. These results proved that the prepared hybrid films
can be switched between two stable states by an external stimuli, and
can be further utilized as a molecular switch.
4. Conclusion
In this study the effect of Mt and Ste LS on the PIC J-aggregate
species formation after swelling with DMSO was examined. Results
obtained in this study were compared with results reported in our
Fig. 5. Interlayer space height of (A) PIC/Ste and (B) PIC/Mt hybrid films prepared at different CEC loading levels before (black squares) and after swelling with DMSO (red circles). (For
interpretation of the references to colour in this figure legend, the reader is referred to the web version of this article.)
Fig. 6. Ratio between PIC molecules in monomeric (black) and J-aggregated (red) form in
PIC/Mt films at different CEC loading levels before and after swelling with DMSO. (For
interpretation of the references to colour in this figure legend, the reader is referred to the
web version of this article.)
M. Matejdes et al. Applied Clay Science 144 (2017) 54–59
58
6. previous study dealing with PIC/Sap films. It was found that not only
the negative charge density has significant influence on arrangement
and interaction of PIC molecules, but also the CEC loading level needs
to be considered as an important parameter. As a result of low negative
charge density the formation of PIC J-aggregates in PIC/Ste films after
swelling with DMSO was not observed. On the other hand, after
swelling with DMSO, higher negative charge density resulted in
significant PIC J-aggregates formation in PIC/Mt films prepared at
10% and 30% CEC loading levels. At 30%, 50% and 70% CEC loading
levels the PIC J-aggregates were already observed prior to swelling with
DMSO. We assume, that the presence of the broad J-aggregate band
located in 560–580 nm region can be explained in terms of PIC J-
aggregates composed from different number of PIC molecules, but at
the same time the resulting broadness caused by the presence of J-
aggregates with oblique structure needs to be also considered. After
adding DMSO to the PIC/Mt sample prepared at 70% CEC loading level
the sample with 70% CEC loading level didn't swell, and also based on
the UV–Vis measurement we assume that the interlayer space became
in this case too hydrophobic.
As it was mentioned earlier the PIC J-aggregates formation was
significantly increased after swelling with DMSO in PIC/Mt samples
prepared at 10% and 30% CEC loading levels. After the DMSO
molecules have been removed from these samples the interlayer space
of the PIC species arrangements returned to state which was observed
prior to application of DMSO. The reversible switching phenomenon
has been demonstrated at the PIC/Mt hybrid film prepared at 10% CEC
loading. Within 20 repetition cycles the sample after swelling step has
not shown systematic decrease in absorbance. Switching between PIC
monomers and PIC J-aggregates is not accompanied by a change in the
chemical structure, and thus from the repeatability point of view we
assume that the swelling technique is more advantageous than other
techniques based on the change in chemical structure.
Acknowledgements
This work was supported by JSPS KAKENHI Grant Numbers
JP15F15742, JP15K13676. This publication is the result of the project
for overseas researchers under postdoctoral fellowship of Japan Society
for the Promotion of Science.
References
Alemani, M., Peters, M.V., Hecht, S., Rieder, K.-H., Moresco, F., Grill, L., 2006. Electric field-
induced isomerization of azobenzene by STM. J. Am. Chem. Soc. 128, 14446–14447.
Aragó, J., Troisi, A., 2015. Dynamics of the excitonic coupling in organic crystals. Phys. Rev.
Lett. 114, 026402.
Brigatti, M.F., Galán, E., Theng, B.K.G., 2013. Structure and mineralogy of clay minerals. In:
Faïza, B., Gerhard, L. (Eds.), Handbook of Clay Science. Elsevier, UK, pp. 21–81.
Bujdák, J., 2006. Effect of the layer charge of clay minerals on optical properties of organic
dyes. A review. Appl. Clay Sci. 34 (1–4), 58–73.
Bujdák, J., 2014. Layer-by-layer assemblies composed of polycationic electrolyte, organic dyes,
and layered silicates. J. Phys. Chem. C 118, 7152–7162.
Bujdák, J., Iyi, N., 2008. Spectral properties and structure of the J-aggregates of
pseudoisocyanine dye in layered silicate films. J. Colloid Interface Sci. 326, 426–432.
Bujdák, J., Komadel, P., 1997. Interaction of methylene blue with reduced charge
montmorillonite. J. Phys. Chem. B 101 (44), 9065–9068.
Bureš, F., Cvejn, D., Melánová, K., Beneš, L., Svoboda, J., Zima, V., Pytela, O., Mikysek, T.,
Růžičková, Z., Kityk, I.V., Wojciechowski, A., AlZayed, N., 2016. Effect of intercalation and
chromophore arrangement on the linear and nonlinear optical properties of model
aminopyridine push-pull molecules. J. Mater. Chem. C 4, 468–478.
Comstock, M.J., Strubbe, D.A., Berbil-Bautista, L., Levy, N., Cho, J., Poulsen, D., Fréchet, J.M.J.,
Louie, S.G., Crommie, M.F., 2010. Determination of photoswitching dynamics through
chiral mapping of single molecules using a scanning tunneling microscope. Phys. Rev. Lett.
104, 178301.
Czikklely, V., Forsterling, H.D., Kuhn, H., 1970. Extended dipole model for aggregates of dye
molecules. Chem. Phys. Lett. 6, 207–210.
Czímerova, A., Bujdák, J., Dohrmann, R., 2006. Traditional and novel methods for estimating
the layer charge of smectites. Appl. Clay Sci. 34 (1–4), 2–13.
Davydov, A.S., 1964. The theory of molecular excitons. Sov. Phys. Usp. 7, 145–178.
Eguchi, M., Shimada, T., Tryk, D.A., Inoue, H., Takagi, S., 2013. Role of hydrophobic
interaction in controlling the orientation of dicationic porphyrins on solid surfaces. J. Phys.
Chem. C 117 (18), 9245–9251.
Epelde-Elezcano, N., Martinez-Martinez, V., Duque-Redondo, E., Temino, I., Manzano, H.,
Lopez-Arbeloa, I., 2016. Strategies for modulating the luminescence properties of pyronin
Y dye-clay films: an experimental and theoretical study. Phys. Chem. Chem. Phys. 18 (12),
8730–8738.
Gao, J., Stein, B.W., Thomas, A.K., Garcia, J.A., Yang, J., Kirk, M.L., Grey, J.K., 2015. Enhanced
charge transfer doping efficiency in J-aggregate poly(3-hexylthiophene) nanofibers. J.
Phys. Chem. C 119, 16396–16402.
Gopakumar, T.G., Matino, F., Naggert, H., Bannwarth, A., Tuczek, F., Berndt, R., 2012.
Electron-induced spin crossover of single molecules in a bilayer on gold. Angew. Chem. Int.
Ed. 51, 6262–6266.
Gunnlaugsson, T., 2016. Supramolecular pathways: accessible self-assembly. Nat. Chem. 8, 6–7.
Hattori, T., Tong, Z., Kasuga, Y., Sugito, Y., Yui, T., Takagi, K., 2006. Hybridization of layered
niobates with cationic dyes. Res. Chem. Intermed. 32, 653–669.
Jelley, E.E., 1936. Spectral absorption and fluorescence of dyes in the molecular state. Nature
138, 1009–1010.
Kakegawa, N., Kondo, T., Ogawa, M., 2003. Variation of electron-donating ability of smectites
as probed by photoreduction of methyl viologen. Langmuir 19, 3578–3582.
Kunimine Industries Co. Ltd., The Application of Clay for Nanocomposite. (Tokyo, Japan).
Leyssner, F., Hagen, S., Óvári, L., Dokić, J., Saalfrank, P., Peters, M.V., Hecht, S., Klamroth, T.,
Tegeder, P., 2010. Photoisomerization ability of molecular switches adsorbed on au(111):
comparison between azobenzene and stilbene derivatives. J. Phys. Chem. C 114,
1231–1239.
Liljeroth, P., Repp, J., Meyer, G., 2007. Current-induced hydrogen tautomerization and
conductance switching of naphthalocyanine molecules. Science 317, 1203–1206.
Maeder, M., 2007. In: Maeder, M., Neuhold, Y.M. (Eds.), Practical Data Analysis in Chemistry,
vol. 26. Elsevier, pp. 213–316.
Mashtalir, O., Cook, K.M., Mochalin, V.N., Crowe, M., Barsoum, M.W., Gogotsi, Y., 2014. Dye
adsorption and decomposition on two-dimensional titanium carbide in aqueous media. J.
Mater. Chem. A 2, 14334–14338.
Matejdes, M., Czímerová, A., Janek, M., 2015. Fluorescence tuning of 2D montmorillonite
optically active layers with beta-cyclodextrine/dye supramolecular complexes. Appl. Clay
Sci. 114, 9–19.
Matejdes, M., Himeno, D., Suzuki, Y., Kawamata, J., 2017. Controlled formation of
pseudoisocyanine J-aggregates in the interlayer space of synthetic saponite. Appl. Clay Sci.
140, 119–123.
Miyamoto, N., Kawai, R., Kuroda, K., Ogawa, M., 2000. Adsorption and aggregation of a
cationic cyanine dye on layered clay minerals. Appl. Clay Sci. 16, 161–170.
Ribierre, J.C., Sato, M., Ishizuka, A., Tanaka, T., Watanabe, S., Matsumoto, M., Matsumoto, S.,
Uchiyama, M., Aoyama, T., 2012. Organic field-effect transistors based on J-aggregate thin
films of a bisazomethine dye. Org. Electron. 13, 999–1003.
Sasai, R., Itoh, T., Ohmori, W., Itoh, H., Kusunoki, M., 2009. Preparation and characterization of
rhodamine 6G/alkyltrimethylammonium/laponite hybrid solid materials with higher
emission quantum yield. J. Phys. Chem. C 113 (1), 415–421.
Scheibe, G., Kandler, L., Ecker, H., 1937. Polymerisation und polymere adsorption als ursache
neuartiger absorptionsbanden von organischen Farbstoffen. Naturwissenschaften 25, 75.
Schoonheydt, R.A., Johnston, C.T., 2013. Surface and interface chemistry of clay minerals. In:
Faïza, B., Gerhard, L. (Eds.), Handbook of Clay Science. Elsevier, UK, pp. 139–172.
Shinozaki, R., Nakato, T., 2004. Humidity-dependent reversible aggregation of rhodamine 6G
dye immobilized within layered niobate K4Nb6O17. Langmuir 20 (18), 7583–7588.
Steiger, R., Pugin, R., Heier, J., 2009. J-aggregation of cyanine dyes by self-assembly. Colloids
Surf. B. 74, 484–491.
Walker, B.J., Bulović, V., Bawendi, M.G., 2010. Quantum dot/J-aggregate blended films for
light harvesting and energy transfer. Nano Lett. 10, 3995–3999.
Würthner, F., Kaiser, T.E., Saha-Möller, C.R., 2011. J-aggregates: from serendipitous discovery
to supramolecular engineering of functional dye materials. Angew. Chem. Int. Ed. 50,
3376–3410.
Zhao, L., Xiang, R., Ma, R., Wang, X., An, Y., Shi, L., 2011. Chiral conversion and memory of
TPPS J-aggregates in complex micelles: PEG-b-PDMAEMA/TPPS. Langmuir 27,
11554–11559.
Fig. 7. Variation of the absorbance recorded at 575 nm after repeated DMSO application
and DMSO removal steps. As sample was used PIC/Mt hybrid film prepared at 10% CEC
loading level.
M. Matejdes et al. Applied Clay Science 144 (2017) 54–59
59