
Recommended
Recommended
More Related Content
Similar to Nature GeNetics VOLUME 46 NUMBER 10 OCTOBER 2014 1 0 8 9.docx
Similar to Nature GeNetics VOLUME 46 NUMBER 10 OCTOBER 2014 1 0 8 9.docx (20)
More from gemaherd
More from gemaherd (20)
Recently uploaded
Recently uploaded (20)
Nature GeNetics VOLUME 46 NUMBER 10 OCTOBER 2014 1 0 8 9.docx
- 1. Nature GeNetics VOLUME 46 | NUMBER 10 | OCTOBER 2014 1 0 8 9 A suite of forces and factors, including mutation, recombination, selection, population history and gene duplication influence patterns of intraspecific genetic variation. Distinguishing which factors have shaped sequence variation across a genome requires extensive whole- genome sequencing of multiple individuals, which has only recently become tractable1. Most large-scale whole-genome resequencing studies have focused on model and domesticated species1–5. However, extensive sequencing of natural populations holds great promise for advancing understanding of evolutionary biology, including identify- ing functional variation and the molecular bases of adaptation. Recent work in a number of species has identified genomic regions that show signatures of positive selection, suggesting that such regions contain loci that control adaptive traits4,6–8. Relatively few studies, however, have combined genome-wide scans with phenotypic data to determine whether computationally identified selected regions influence
- 2. adap- tive phenotypic variation5,9–13. Genome-wide studies of large natural populations combined with phenotypic measurements are necessary to determine which factors shape patterns of genetic variation within species and, therefore, enhance understanding of adaptation. With large geographic ranges spanning wide environmental gradi- ents and a long history of research showing local adaptation14, forest trees are ideal for examining the processes shaping genetic variation in natural populations. Forest trees cover approximately 30% of ter- restrial land area15, provide direct feedback to global climate15 and are often foundation species that organize entire biotic communities and biogeochemical systems16,17. Clearly, biotic and abiotic interac- tions have influenced population sizes and distributions of forest trees, leaving diagnostic signatures in the genomes of present- day populations14,18,19. A deeper understanding of the evolutionary and ecological forces that shaped these patterns will offer insights and options for ecosystem management, applied tree improvement and accelerated domestication efforts20.
- 3. Black cottonwood, Populus trichocarpa Torr. & Gray, is a dominant riparian tree that has become a model for the advancement of genome- level insights in forest trees21. The sequencing of 16 P. trichocarpa genomes revealed widespread patterns of linkage disequilibrium (LD) and population structure22 and extensive genecological studies have revealed a high degree of adaptive phenotypic variation in growth, vegetative phenology and physiological traits such as water-use effi- ciency and photosynthesis23–25, suggesting that local adaptation is prevalent. To date, candidate gene–association analyses have revealed loci with significant effects on phenotypic traits26,27. However, thus far there have been no publications describing whole-genome asso- ciations for adaptive traits in P. trichocarpa, or their relationship to signatures of selection in any forest tree species. One of the salient features of the P. trichocarpa genome is a remark- ably well-conserved whole-genome duplication that is shared by all members of the Salicaceae and near relatives: the Salicoid duplica- tion28,29. Despite the extensive occurrence of segments of collinear paralogous genes, more than two-thirds of the duplicated genes are
- 4. lost after the duplication event, and there are substantial functional biases in the remaining gene pairs—in particular, there is an over- abundance of gene categories with large numbers of protein- protein interactions30,31. A major unexplored question is whether the funda- mental, diagnostic differences in diversity between retained duplicate pairs and genes lacking paralogs from the Salicoid duplication (sin- gletons) are connected to patterns of natural selection and adaptive phenotypic variation. Population genomics of Populus trichocarpa identifies signatures of selection and adaptive trait associations Luke M Evans1, Gancho T Slavov2, Eli Rodgers-Melnick1, Joel Martin3, Priya Ranjan4, Wellington Muchero4, Amy M Brunner5, Wendy Schackwitz3, Lee Gunter4, Jin-Gui Chen4, Gerald A Tuskan3,4 & Stephen P DiFazio1 Forest trees are dominant components of terrestrial ecosystems that have global ecological and economic importance. Despite distributions that span wide environmental gradients, many tree populations are locally adapted, and mechanisms underlying this adaptation are poorly understood. Here we use a combination of whole-genome selection scans and association analyses of 544 Populus trichocarpa trees to reveal genomic bases of adaptive variation across a wide latitudinal range. Three hundred ninety-seven genomic regions showed evidence of
- 5. recent positive and/or divergent selection and enrichment for associations with adaptive traits that also displayed patterns consistent with natural selection. These regions also provide unexpected insights into the evolutionary dynamics of duplicated genes and their roles in adaptive trait variation. 1Department of Biology, West Virginia University, Morgantown, West Virginia, USA. 2Institute of Biological, Environmental and Rural Sciences, Aberystwyth University, Aberystwyth, UK. 3The Joint Genome Institute, Walnut Creek, California, USA. 4Plant Systems Biology Group, BioSciences Division, Oak Ridge National Laboratory, Oak Ridge, Tennessee, USA. 5Department of Forest Resources and Environmental Conservation, Virginia Tech, Blacksburg, Virginia, USA. Correspondence should be addressed to S.P.D. ([email protected]). Received 22 May; accepted 30 July; published online 24 August 2014; doi:10.1038/ng.3075 A r t i c l e s np g © 2 01 4 N at ur
- 6. e A m er ic a, In c. A ll ri gh ts r es er ve d. http://www.nature.com/doifinder/10.1038/ng.3075 http://www.nature.com/naturegenetics/ http://www.nature.com/naturegenetics/ 1 0 9 0 VOLUME 46 | NUMBER 10 | OCTOBER 2014 Nature GeNetics
- 7. A r t i c l e s Here we report the whole-genome resequencing of a collection of 544 P. trichocarpa individuals, spanning much of the species’ natural latitudinal range, that have been clonally replicated in three contrast- ing environments. We use this resource to detect signatures of recent selection across the Populus genome and on adaptive traits themselves. We also show that the signals of association with adaptive traits are stronger in positively selected regions. Finally, we demonstrate that Salicoid duplicate genes have distinctive patterns of adaptive variation that reveal the evolutionary effects of dosage constraints. RESULTS Polymorphism and population structure From high-coverage whole-genome sequencing of 544 unrelated P. trichocarpa individuals (Fig. 1a and Supplementary Table 1) we collected more than 3.2 terabases (Tb) of data that aligned to 394 Mb of the P. trichocarpa genome. Approximately 87.5% of the 3.2 Tb was accessible for analysis based on median sequencing depth across all samples (Supplementary Fig. 1). From these data, we detected 17,902,740 single nucleotide polymorphisms (SNPs). Using this resource, nucleotide diversity was twofold higher
- 8. in intergenic sequence than in genic sequence, largely consistent with purifying selection (Table 1). Diversity was particularly low in coding sequences, where nonsynonymous diversity was one- third that of synonymous diversity. Most SNPs were rare (minor allele frequency (MAF) ≤ 0.01), particularly those predicted to have major effects (for example, splice site mutations) (Table 1 and Supplementary Fig. 2). We also identified 5,660 large (>100 bp) and 254,464 small (<50 bp) insertion or deletion (indel) polymorphisms (unpublished data). On the basis of principal component analysis (PCA) of these 17.9 mil- lion SNPs, we identified four major regional genetic groups corresponding to geographical origin (Fig. 1a). We also found spatial genetic structure within regional groupings that clustered as separate subgroups within source locations (Fig. 1b). These data indicate that there is genome-wide genetic structure at both broad latitudinal and local spatial scales. Phenotypic evidence of selection We examined two different indicators of selection using phenotypic data from three clonally replicated plantations representing the center and southern extent of the extant range of P. trichocarpa. We found that quantitative differentiation (QST) in height, spring bud
- 9. flush and fall bud set among source rivers was greater than genome- wide marker differentiation (FST) (Fig. 2a), consistent with spatially divergent selection32, as is commonly observed in forest trees14,24,25. Furthermore, at all three plantations, these same adaptive traits showed correlations with the first two principal components (PC) axes of multivariate climate variables (Fig. 2b–d and Supplementary Fig. 3). Warmer climates (negative PC1) are associated with earlier bud flush and later bud set, strongly supporting the hypothesis that climate is a major determinant of adaptive genetic variation through- out the sampled range of P. trichocarpa24,25. Recent positive and divergent selection We related the strong evidence of climate-driven, divergent selection on adaptive traits to genomic regions that also appeared to be affected by natural selection. We examined five distinct metrics of natural selection using 1-kb windows across the genome. These met- rics included differentiation (FST), allele frequency cline steepness across mean annual temperature and precipitation measurements (SPA)33, extended haplotype homozygosity around alleles from rapid allele frequency increase (iHS)8 and allele frequency clines (bayenv)34 with each of the first two climate PC axes (PC1 and PC2). From these data we classified the empirical top 1% of windows
- 10. or regions as ‘selection outliers’, i.e., regions with unusually strong polymorphism patterns consistent with recent positive and/or divergent selection (Fig. 3, Supplementary Figs. 4 and 5 and Supplementary Tables 2–6). Most of the selection outlier regions occurred uniquely among selection scan metrics, suggesting that each metric provides a distinct view of selection and that different selective forces are shaping these genomic regions (Fig. 3a). However, we found 397 regions in the top 1% for at least two of the selection scan metrics; we termed these regions candidate selection regions (CSRs) (Supplementary Table 7). We tested whether the genes spanning or nearest to these CSRs (452 genes) and the selection outliers (1,418; 1,718; 1,151; 257 and 312 genes for FST, SPA, iHS, bayenv PC1 and bayenv PC2, respectively) were overrepresented among annotation categories, gene families or genes with known involvement in several biological processes (Fig. 3 and Supplementary Tables 8–11). On the basis of Fisher exact tests, a b Dean Fraser
- 11. Homathko Kitimat Klinaklini Lillooet Nisqually Nooksack Olympic Peninsula Salmon Skagit Skwawka Skykomish Squamish Vancouver I Puyallup –0.10 PC2 (7.3%) P C 1 ( 9 .9 % ) P C
- 12. 1 ( 3 0 .8 % ) –0.05 0 0.05 0.10 PC2 (10.4%) –0.05 0 0.05 Columbia Tahoe WA/BC Willamette 0 0.1 0.2 0.3 0.4 0.10 0.05
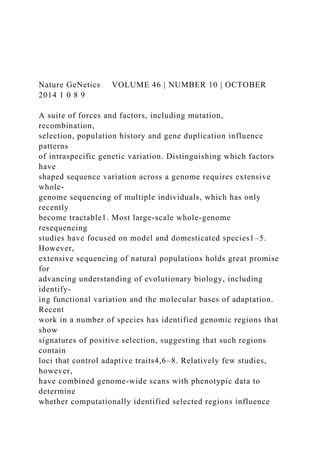
- 13. 0 –0.05 –0.10 Figure 1 Geographic locations and genetic structure of the 544 P. trichocarpa individuals sequenced. (a) Map (left) of collection locations of the 544 P. trichocarpa genotypes sampled in this study from along the Northwest coast of North America (tan shading indicates species range) and PCA (right) of all 544 individuals color- coded by general geographic regions. Yellow diamonds represent plantation locations. (b) Map (left) and PCA (right) of the central Washington and British Columbia (WA/BC) group of individuals (outlined by box in a), color-coded according to collection river. The percentage of the variance explained by the PC1 and PC2 axes for the regional analysis and the WA/BC group is shown. np g © 2 01 4 N
- 14. at ur e A m er ic a, In c. A ll ri gh ts r es er ve d. Nature GeNetics VOLUME 46 | NUMBER 10 | OCTOBER 2014 1 0 9 1
- 15. A r t i c l e s certain functional categories were overrepresented, including GO annotations related to response to stimuli; 1,3-β-glucan (callose) synthesis; and metabolic processes, as well as PANTHER annotations for leucine-rich repeat receptor-like protein kinase and homeobox protein transcription factors (Supplementary Tables 8–10). Despite some similarities, genes associated with the top 1% of each scan were generally overrepresented in unique categories (Fig. 3). For example, genes encoding transcription factors were, as a group, overrepresented among FST and SPA outliers; those encoding DELLA proteins (gibberellin-interacting transcriptional regulators; Pfam PF12041), among FST and bayenv PC2; and genes encoding phytochromes (Pfam PF00360) or involved in photoperiodic or circadian clock regulation, ATPase activity and transmembrane movement (for example, GO:0042626) were only overrepresented in FST (Supplementary Tables 8 and 9). Heat shock–related anno- tations were significantly overrepresented only in SPA (PANTHER PTHR10015 and PTHR11528), and genes encoding proteins induced by water stress or abscisic acid (Pfam PF02496) were overrepresented
- 16. in bayenv PC2 and SPA outliers. Genes encoding the hydrolase 4-nitrophenylphosphatase (PTHR19288) were overrepresented among bayenv PC1 and weakly represented in FST (Supplementary Table 9). Genes encoding class III aminotransferases (PANTHER PTHR11986, involved in abiotic stress)35 were overrepresented most strongly in bayenv PC2 (Fig. 3). Intriguingly, although moderate-effect SNPs were underrepre- sented among genic regions of all selection scan outliers, owing pre- sumably to purifying selection, SNPs predicted to have high impacts were overrepresented among strong sweep loci implicated by the iHS scans (Supplementary Table 12), potentially because SNPs with major, presumably beneficial effects are more likely to be swept to high frequency. Because different selection processes (for example, hard sweeps and subtle frequency shifts of standing variation) will influence diversity patterns differently, these five metrics reveal an assortment of potential selection pressures acting on P. trichocarpa through the largely nonoverlapping regions identified in each. Adaptive trait associations in candidate selected regions If climate is a major force driving the signatures of positive selection, we predict polymorphisms in regions affected by selection to be
- 17. associated with climate-related adaptive traits. Vegetative bud phenology in particular should be a major determinant of fitness in these peren- nial populations, as timing of the onset and release of dormancy is shaped largely by photoperiod and temperature regimes23,24. Indeed, genes related to photoperiod, drought and stress response were over- represented among the selection outliers (Supplementary Table 11). To more directly test this hypothesis, we performed a genome- wide association study (GWAS) with spring bud flush, fall bud set and tree height measured at the three test sites, accounting for popula- tion stratification and background genetic effects in a mixed model framework for both univariate36 and multivariate traits37 (Fig. 1b, Supplementary Tables 1 and 13 and Supplementary Figs. 6–10). More specifically, we found that those regions in the top 1% of selec- tion scans had stronger adaptive trait association signals at all three test sites than would be expected by chance (i.e., the observed mean association signal was stronger than randomly resampled windows, table 1 Per-site nucleotide diversity estimated across the genome for all annotated features of the P. trichocarpa genome and the number of variants annotated in each class
- 18. Feature π (median and central 95% range) Overalla 0.0041 (0.0004–0.01226) Intergenic 0.0064 (0.0012–0.0125) Genicb 0.003 (0.0006–0.0106) 5′ UTR 0.0028 (0.0001–0.0114) 3′ UTR 0.0033 (0.0001–0.0123) Intron 0.0034 (0.0005–0.0114) Coding sequence 0.002 (0.0002–0.0111) Nonsynonymous 0.0018 (0–0.0122) Synonymous 0.0054 (0–0.0348) πnonsynonymous/πsynonymous 0.3179 (0–14.5447) Annotation Number of variantsc Intergenic 14,520,224 Intron 1,962,848 Nonsynonymous coding 612,655 Nonsynonymous start 253 Start lost 1,631 Stop gained 18,702 Stop lost 2,175
- 19. Splice site acceptor 3,748 Splice site donor 4,449 Synonymous coding 386,103 Synonymous stop 959 3′ UTR 389,771 5′ UTR 169,083 Total is greater than total observed number of variants because some SNPs have multiple annotations for alternative transcripts. aBased on P. trichocarpa version 3.0 reference genome. bPredicted transcript from 5′ to 3′ UTR. cVariants annotated using SnpEff60. d P la ce rv ill e b u d s e t
- 20. PC1 –5 0 5 10 15 0.5 0 –0.5 –1.0 c r = 0.446 P <10–16 PC1 50 0 –50 –100 C o rv a lli s h e ig
- 21. h t –5 0 5 10 15 r = 0.332 P <10–16 b r = 0.44 P <10–16 2 1 0 –1 C la ts ka n ie b u d f lu sh
- 22. –5 0 5 10 15 PC1 a Clatskanie, OR Corvallis, OR Placerville, CA 0.8 0.6 0.4 0.2 0 Q S T Bud flush Bud set Height Trait Figure 2 Phenotypic evidence of climate-driven selection in P. trichocarpa. (a) Patterns of quantitative trait differentiation (QST) are stronger than genome-wide differentiation (FST) among sampled geographic locations. Shaded area represents the 95% confidence interval (CI) of FST; points and bars represent the point and 95% CI of QST. (b–d) Genotypic estimates of best linear unbiased predictors
- 23. (BLUPs) for adaptive traits growing in multiple plantation environments show strong correlations with the first principal component of 20 climate variables measured at the collection location. Negative PC1 values are associated with warmer conditions, and more positive bud flush and bud set BLUPs indicate earlier flush or set, respectively. Pearson correlation r and P values are shown. np g © 2 01 4 N at ur e A m er ic a, In
- 24. c. A ll ri gh ts r es er ve d. http://pfam.xfam.org/family/PF12041 http://pfam.xfam.org/family/PF00360 http://www.ebi.ac.uk/QuickGO/GTerm?id=GO:0042626 http://www.pantherdb.org/panther/family.do?clsAccession=PTH R10015 http://www.pantherdb.org/panther/family.do?clsAccession=PTH R11528 http://pfam.xfam.org/family/PF02496 http://www.pantherdb.org/panther/family.do?clsAccession=PTH R19288 http://www.pantherdb.org/panther/family.do?clsAccession=PTH R11986 1 0 9 2 VOLUME 46 | NUMBER 10 | OCTOBER 2014 Nature GeNetics A r t i c l e s
- 25. controlling for gene density; P < 0.00005) (Fig. 4 and Supplementary Fig. 11). This was the case for all scans, including those based on spatial variation in allele frequency (for exam- ple, FST and bayenv) as well as those based on long haplotypes (iHS). This correspondence is therefore unlikely to be artifactual, supporting the hypothesis that these outlier regions are driven partly by selection on adaptive traits. We found strong associations for both univariate analyses as well as the multi- trait GWAS for each trait among test sites (Supplementary Table 13). Though some of the strongest univariate associations were also identified in the multiple-plantation GWAS, many associations were nonover- lapping, perhaps owing to the strong envi- ronmental differences among the locations, which ranged from cool and wet (Clatskanie, Oregon) to hot and dry (Placerville, California). Strikingly few indi- vidual height-associated SNPs overlapped in comparisons between the Placerville plantation and the two other sites. Dormancy candidate genes in selection and GWAS regions A number of dormancy-related genes were near the strongest GWAS and selection signals. A region on chromosome 10, characterized by high LD, was one of the CSRs and was associated with bud flush (mixed- model SNP association P = 5.19 × 10⁻⁶) (Fig. 5). The strongest selec-
- 26. tion signal occurred near Potri.010G079600, encoding a DNA- damage repair protein, and a number of genes encoding lipid biosynthesis transferases. A strong bud set association also occurred near this region (Clatskanie and Corvallis, Oregon; Supplementary Fig. 12). The strongest association signal (mixed-model SNP association P = 5.69 × 10⁻⁷), within 15 kb of a CSR, was just downstream of the coding region of Potri.010G076100, encoding a ureidoglycolate ami- dohydrolase (UAH), whose leaf and root expression is downregulated with short days38. Ureides are transportable intermediates of purine catabolism, and by catalyzing the final step in ureide catabolism, UAH has a role in the remobilization of nitrogen39. The ureide allantoin also influences abscisic acid metabolism and promotes abiotic stress tolerance in Arabidopsis39. However, to our knowledge, ureides and UAH have not previously been implicated as having important roles in seasonal nitrogen cycling or cold tolerance in Populus. Among the photoperiodic and dormancy genes we found an FST outlier, Potri.010G179700 (FT2), which influences growth cessa- tion in Populus40. This gene had an intronic SNP strongly associated with bud set and height (mixed-model SNP association P <
- 27. 0.00015, Supplementary Table 13) and was near strong SPA and bayenv outliers. A second gene, Potri.008G117700 (similar to PFT1), occurred as an FST outlier region and was within 5 kb of several multitrait association signals (P = 7.17 × 10⁻⁵). Arabidopsis PFT1 is hypothesized to influ- ence both defense and phytochrome B–mediated FT regulation41. Among the strongest bud flush associations (mixed-model SNP association P = 2.72 × 10⁻¹⁴) was a nonsynonymous mutation in Potri.008G077400, a 4-nitrophenylphosphatase–associated locus (Clatskanie and Corvallis, Fig. 6). This mutation is in high LD with many other significantly associated SNPs in the surrounding 40 kb, 0 0.02 0.04 0.06 0.08 0.10 Leucine-rich repeat receptor-like protein kinase Homeobox protein transription factors Lyst-interacting protein LIP5 Alpha-amylase Serine-threonine protein kinase Aldehyde dehydrogenase-related Xenotropic and polytropic retrovirus receptor 1-related AAA ATPase Phopholipase D Uridine kinase Protein phosphatase 2C Vacuolar protein sorting-associated protein NADH dehydrogenase
- 28. Protein arginine N-methyltransferase Thiamin pyrophosphokinase Casein kinase-related Methyltransferase BCL-2-associated athanogene Zinc finger FYVE domain containing protein Zinc finger CCHC domain containing protein Two-component sensor histidine kinase WD40 repeat protein Sugar-1-phosphate guanyl transferase Male sterility protein 2-related Cyclin Multi-copper oxidase IRE1-related Exportin 4,7-related Multidrug resistance protein COP9 signalosome complex subunit 7 YTH domain-containing LIN-9 MADS box protein F-Box/leucine rich repeat protein Phosphoenolpyruvate dikinase-related Myosin Transcription factor NF-Yα–related VHS domain containing protein family TBC1 domain family member GTPase-activating protein PHD finger transcription factor F S T S P
- 29. A iH S P C 2 C S R P C 1 Aminotransferase class III P value b a Unique and overlappingregions in each selection scan FST SPA Bayenv PC11,130 16 16 5 5 5
- 30. 5 12 95 0 194 6 4 46 53 33 2 2 12 157 Bayenv PC2 50 1,072iHS 6 6 13 1,421 1 1
- 31. 1 1 1 Figure 3 Unique and shared genomic regions among five selection scans. (a) Venn diagram of the number of regions throughout the genome in the top 1% for each selection scan. (b) Overrepresentation P value (Fisher’s exact test) for PANTHER annotation categories in selection outliers. Only the ten most strongly overrepresented categories for each selection scan are shown. a 15,000 F re q u e n cy (a ll 1 -k
- 36. 0 1 4,000 2,000 0 6,000 2,000 0 2 3 0 0 0.5 1 2 3 4 Bud flush SPA All 72 Bud set iHS Height CSR
- 37. 5 6 1.0 1.5 Average –log10 (P value) in 1-kb window 2.0 2.5 SPA All iHS All CSR 60 48 36 24 12 0 48 40 32 24 16 8 0
- 38. 20 16 12 8 4 0 Figure 4 The selection outliers have a stronger association signal with adaptive traits than that expected by chance. (a–c) The genome- wide distribution of association signal in 1-kb windows through the genome (blue) and the association within the selection outliers (green; red line indicates mean) for three traits in different gardens. np g © 2 01 4 N at ur
- 39. e A m er ic a, In c. A ll ri gh ts r es er ve d. Nature GeNetics VOLUME 46 | NUMBER 10 | OCTOBER 2014 1 0 9 3 A r t i c l e s including Potri.008G076800, (encoding FAR1 transcription
- 40. factor) and Potri.008G077300 (encoding UDP-galactose transporter), and is in an FST and bayenv PC1 outlier region. In this same region there is a bud flush association signal in all three test sites (P values ranging from 2.01 × 10⁻⁷ to 1.08 × 10⁻⁵) within Potri.008G077700 (FT1), a gene previously implicated in Populus dormancy cycling42. However, it appears to be a weakly linked (r2 = 0.14), separate association signal from that in Potri.008G077400. In summary, we detected genomic regions with patterns of diversity consistent with divergent and/or recent positive selection on a range of traits, and particularly on climate-related phenological and growth patterns. Although our selection scans and GWAS analyses identified genes previously known to influence adaptive traits, they also iden- tified many loci of unknown function, which would not have been considered in any a priori candidate gene approach. Furthermore, the results and discussion presented above focus primarily on veg- etative phenology, but many other traits are likely to be involved in determining fitness in these highly variable environments. In fact, the CSRs contained genes that have been implicated in
- 41. controlling numerous other adaptive characteristics, including temperature stress tolerance, ion uptake and homeostasis, insect and pathogen defense and reproduction (Supplementary Note). Duplication and network connectedness We tested whether genes associated with selection outliers were over- or underrepresented among the 7,906 identified gene pairs resulting from the Salicoid whole-genome duplication29,31 (hereafter referred to as Salicoid duplicates), as compared to genes that occur as singletons (Table 2). These analyses suggest that recent positive selective sweeps (indicated by iHS) are less likely for retained Salicoid duplicates than for singleton genes, but when one occurs, the sweep tends to occur for both duplicates. We also found that genes nearest to the individual FST, SPA and iHS outliers had more predicted protein-protein interac- tions than genes in the rest of the genome (Supplementary Fig. 13; P ≤ 0.05). Furthermore, protein-protein interactions were negatively correlated with total and within-population nucleotide diversity and the ratio of nonsynonymous to synonymous diversity (r < – 0.06, P < 0.0001). These results suggest that patterns of selection (both purifying and positive) are influenced by genomic context,
- 42. including past whole-genome duplication events and gene or protein- protein interactions (Supplementary Note). DISCUSSION A primary goal of evolutionary biology is to determine the influences of positive and purifying selection, as well as neutral forces in shap- ing genetic variation. Natural populations spanning wide climatic gradients offer an ideal opportunity to investigate these patterns. We sequenced more than 500 P. trichocarpa individuals from across much of the species range and identified more than 17 million SNPs (Table 1 and Fig. 1). These polymorphisms revealed significant spatial and geographic structure, even at fine spatial scales. As previously suggested on the basis of small-scale sequencing and genotyping22, such patterns seem to have resulted from a complex demographic history. … Step 1 • Specific • Since I will graduate after this semester, I will work in family welding machine
- 43. business and I will be part of the U.S market team. I want to learn the market and explore the welding business. • Measurable • The goal will be accomplish before May 20th. • Action-Oriented/Achievable • Well I can first visit all the big companies’ website and their product. Using some website to see which machines are hot sell in what kind field, then I can attend some Welding Exhibition whenever I have time. • Realistic/Relevant • Just know the welding business market in the North American, and be ready to work with the team in June this year. • Time-based • Staring from today till the end of May. Step2 I believe through out the semester I will learn something that can help me doing better when I join the team, so that I can work better with
- 44. people. One thing that I know is I want to connect what I learn from school with the things I will learn in the future job experience. Step 3 On a scale of 0-5, I’m 1 for now. I’m just getting start it with some general knowledge. Step 4 - Know the total market volume. - Know all the types welding machine - Know the advantage and disadvantage of the machine and for the big welding company - Know the market, how people selling the machine. E-market or supermarket. Running head: GOAL SETTING 1 GOAL SETTING
- 45. 2 Goal Setting Student's Name Institutional Affiliation My goal is to ensure that I attain a healthy equilibrium between my school work and life by the end of the semester. Salient balance between my school work and life is a critical component that will see my personal development improve and my quality of life strengthen upon accomplishing this goal. Therefore, I am looking forward to ensuring I strictly follow guidelines to ensure I attain my goal. By the end of the semester, I want to feel comfortable handling tasks comfortably without interfering with "time for the other" tasks. I am planning to start pursuing this goal on February 10, 2020. The following are some of the steps I need to follow in order to achieve my goal; · Ensure I set my priorities · Plan and track my time · Plan to concentrate on a particular thing at a time · Have a time table of what I want to achieve each day · Ensure that I respect and have enough private time · Have a sneak peek at my habits and lifestyle · Ask for support · Have regular exercise · Learn to evaluate school life balance regularly. When I achieve a balance between school and life I will be able to concentrate more in class and also give considerable time to my school demands. Also, a balance will help me improve my general health and time management. Currently, I am at 0, embracing myself to start strong within the next few days, I believe with this foundation I will be able to
- 46. achieve my goal. I will be certain I have achieved my goal when I get enough time between my daily tasks and avoid further procrastination. A proper plan and adequate time for my daily exercise will be a sign of achievement and personal growth. With an adequate support system, I will be able to evaluate my performance through his/her assessment, this way I will be sure I am moving on the right track. Decision Matrix Analysis Worksheet © Copyright Mind Tools Ltd, 2006-2015. Please feel free to copy this sheet for your own use and to share with friends, co-workers or team members, just as long as you do not change it in any way. • For information on decision matrix analysis, visit www.mindtools.com/rs/GridAnalysis. Factors: Total Weights: http://www.mindtools.com/ http://www.mindtools.com/rs/DecisionMatrixAnalysis Happiness Situation 10566: Happiness Situation 10568: Happiness Situation 10570: Happiness Situation 10572: Happiness Situation 10574: Happiness Situation 10576: Happiness Situation 10567: Happiness Situation 10569: Happiness Situation 10571: Happiness Situation 10573:
- 47. Happiness Situation 10575: Happiness Situation 10577: Happiness Situation 10578: Happiness Situation 10579: Happiness Situation 10580: Happiness Situation 10581: Happiness Situation 10582: Happiness Situation 10583: Happiness Situation 10584: Happiness Situation 10585: Happiness Situation 10586: Happiness Situation 10587: Happiness Situation 10588: Happiness Situation 10589: Happiness Situation 10590: Happiness Situation 10591: Happiness Situation 10592: Happiness Situation 10593: Happiness Situation 10594: Happiness Situation 10595: Happiness Situation 10596: Happiness Situation 10597: Happiness Situation 10598: Happiness Situation 10599: Happiness Situation 10600: Happiness Situation 10601: Happiness Situation 10602: Happiness Situation 10603: Happiness Situation 10604: Happiness Situation 10605: Happiness Situation 10606: Happiness Situation 10607: Happiness Situation 10608: Happiness Situation 10609: Happiness Situation 10610: Happiness Situation 10611: Happiness Situation 10612: Happiness Situation 10613: Happiness Situation 10614: Happiness Situation 10615: Happiness Situation 10616: Happiness Situation 10617: Happiness Situation 10618: Happiness Situation 10619: Happiness Situation 10620: Happiness Situation 10621: Happiness Situation 10622: Happiness Situation 10623: Happiness Situation 10624: Happiness Situation 10625: Happiness Situation 10626: Happiness Situation 10627: Happiness Situation 10628: Happiness Situation 10629: Happiness Situation 10630: Happiness Situation 10631: Happiness Situation 10632: Happiness Situation 10633: Happiness Situation 10634: Happiness Situation 10635: Happiness Situation 10636: Happiness Situation 10637: Happiness Situation 10638: Happiness Situation 10639: Happiness Situation 10640: Happiness Situation 10641: Happiness Situation 10642: Happiness Situation 10643: Happiness Situation 10644: Happiness Situation 10645: Happiness Situation 10646: Happiness Situation 10647:
- 48. Happiness Situation 10648: Happiness Situation 10649: Happiness Situation 10650: Happiness Situation 106010: Happiness Situation 10651: Happiness Situation 10652: Happiness Situation 10653: Happiness Situation 10654: Happiness Situation 10655: Happiness Situation 10656: For this assignment, you will create a decision matrix and write a short paper discussing your decision-making process. Please follow the steps below. 1. For this assignment, please review the video and article located at this link from Mindtools: https://www.mindtools.com/pages/article/newTED_03.htm (Links to an external site.) 2. Identify an academic or career-related decision that you either need to make now, or will need to make in the near future. Please make sure that this is a decision with at least 3 potential choices to choose from, and multiple factors influencing your decision. 3. Identify one (1) S.M.A.R.T. goal associated with your decision. List your S.M.A.R.T. goal at the top of your paper. 4. Complete the decision matrix worksheet below: DecisionMatrixAnalysisWorksheet-1.pdfPreview the document see attachment 5. Develop a 1-2 page paper (double-spaced) discussing the following topics. The paper length of 1-2 pages should be where you answer questions like the ones below. The 1-2 pages does NOT count your decision-making matrix: The details surrounding your academic/career decision How you identified the factors that you used to judge/measure
- 49. each potential choice Your results Your thoughts on the results Did this clarify or complicate your decision? Do you agree with the results? Why or why not? Explain. Your S.M.A.R.T. goal associated with this decision, how this goal will help you, and how you will achieve this goal. 6. Submit your decision-making matrix worksheet and paper as one document. You can make your own decision-making matrix instead of using the one in the PDF as long as they look the same. Please submit your paper as a Word document or PDF and adhere to the following format: 12-point font double space 1 inch margins In-text citations when necessary (include a reference list if applicable) Word or PDF format Your paper will be graded on the following criteria: Content (meaningful discussion, addressing major questions posed) Inclusion of all required sections Grammar, spelling, punctuation Adherence to formatting guidelines