Download as PDF, PPTX
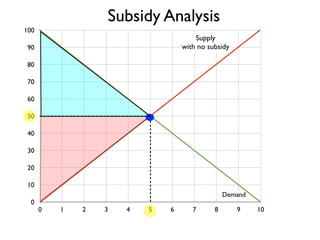
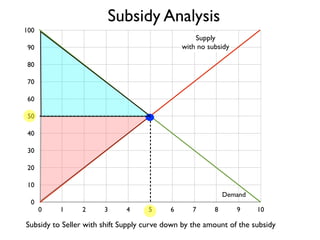


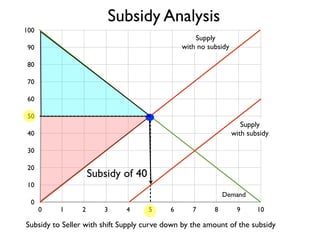


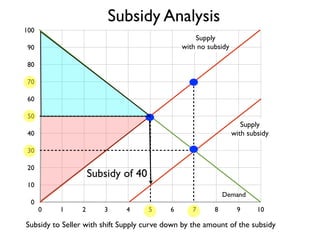
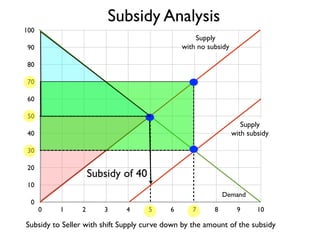


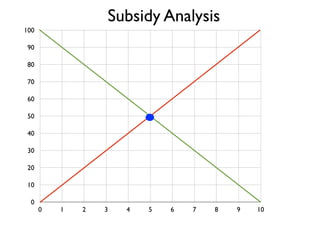


The document shows diagrams of supply and demand curves with and without subsidies. It illustrates how a subsidy shifts the supply curve down, increasing the quantity supplied and lowering the price. It also shows that with a $40 subsidy, sellers receive $70, buyers pay $30, and the government pays $40, resulting in a $240 gain but $40 of deadweight loss.


