2. CONTENTS
2 Letter to Stockholders
6 Exploration and Production
15 Refining and Marketing
18 Index to Financial Information
58 Directors and Officers
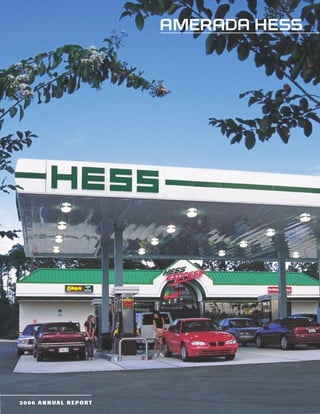
C OV E R
HESS EXPRESS Retail Facility in Florida
3. Financial and Operating Highlights
Amerada Hess Corporation and Consolidated Subsidiaries
2000 1999
Dollar amounts in millions, except per share data
FINANCIAL — FOR THE YEAR
Sales and other operating revenues $11,993 $ 7,039
Operating earnings $ 987 $ 307
Net income $ 1,023(a) $ 438(a)
Net income per share (diluted) $ 11.38 $ 4.85
Return on average capital employed(b) 20.4% 10.5%
Common stock dividends per share $ .60 $ .60
Capital expenditures $ 938 $ 797
Weighted average shares outstanding (diluted) —
in thousands 89,878 90,280
FINANCIAL — AT YEAR-END
Total assets $10,274 $ 7,728
Total debt $ 2,050 $ 2,310
Stockholders’ equity $ 3,883 $ 3,038
OPERATING — FOR THE YEAR
Production — net
Crude oil and natural gas liquids —
thousands of barrels per day
United States 67 65
Foreign 194 167
Total 261 232
Natural gas — thousands of Mcf per day
United States 288 338
Foreign 391 305
Total 679 643
Barrels of oil equivalent —
thousands of barrels per day 374 339
Refining and marketing — thousands of barrels per day
Refining crude runs — HOVENSA L.L.C.(c) 211 209
Refined products sold 366 344
(a) Includes after-tax income from special items of $36 million in 2000 and $131 million in 1999.
(b) Net income excluding after-tax interest expense divided by average capital employed (total debt plus equity).
(c) Reflects the Corporation’s 50% share of HOVENSA’s crude runs.
See Management’s Discussion and Analysis of Results of Operations beginning on page 19.
1
4. To Our Stockholders
The year 2000 was an extraordinary year for Amerada Hess.
• We achieved record after-tax earnings of $1.023 billion ($11.38 per
share), a 20% return on average capital employed.
• We increased production to 374,000 barrels of oil equivalent per day
from 339,000 barrels per day in 1999, a 10% increase.
• We began construction of the coking unit at our HOVENSA joint venture
Virgin Islands refinery.
• We significantly expanded our retail marketing network.
• We repurchased 3,444,000 shares of Common Stock for $220 million.
We enter 2001 confident that we will have another year of strong earnings and
production growth. We have a strong balance sheet and are poised to take steps
for further growth and profitability. We continue to strive for excellence in our
environmental, health and safety performance.
E X P L O R AT I O N A N D P R O D U C T I O N
In 2000, we achieved a 29% return on capital employed in exploration and
production. Exploration and production will continue to be the primary
vehicle for future income and growth. We will balance our efforts among
exploration drilling, reserve development opportunities and acquisitions. We
believe that increasing our international portfolio of lower-cost, long-life
reserves and our exposure to natural gas in the United States is the best way
to create value in our upstream business.
Major milestones in 2000 included the successful development of the
Conger and Northwestern Fields in the Gulf of Mexico, which will add about
16,000 barrels of oil equivalent per day to our United States production, the
acquisition of the Gassi El Agreb redevelopment project in Algeria, which
will add current net production of about 14,000 barrels of oil per day, and the
acquisition of an additional interest in the Azeri, Chirag and Guneshli Fields
in Azerbaijan, which offer lower-cost, long-life reserves. Early this year, the
Atora Field in Gabon came onstream.
We recently reached agreement to purchase natural gas properties onshore
and offshore Louisiana for approximately $750 million. Net production from
these properties will average about 200,000 Mcf of natural gas equivalent per
day in 2001 and peak at about 250,000 Mcf per day in 2003. Early in 2001, we
also acquired Gulf of Mexico properties that will have net production of about
2
5. 30,000 Mcf of natural gas equivalent per day in 2001. Both acquisitions offer
excellent financial returns, production upside and increased exposure to
United States natural gas markets.
We expect our daily production to increase by about 12% to 420,000 bar-
rels of oil equivalent per day in 2001 as a result of past exploration successes,
field redevelopments and production from these acquisitions. We anticipate
a further production increase in 2002. The per barrel profitability of our pro-
duction, after eliminating the impact of higher crude oil and natural gas
prices, has risen dramatically since we reshaped our upstream asset base.
Management remains committed to enhancing financial returns.
We replaced 129% of our production in 2000. However, we have not been sat-
isfied with the results of our exploration program. During 2000, we brought
in new management for our United States and international exploration pro-
grams. We are confident that the new exploration leadership will improve our
exploration success rate and move us toward our finding cost target.
During 2000, Amerada Hess made an offer for LASMO plc, a United Kingdom
exploration and production company with significant international activities.
We withdrew our offer in the face of a higher bid that would not have met our
financial return standards and, we believe, would not have been in the best
interests of our shareholders. We will continue to be disciplined and pursue
acquisitions that meet our financial standards.
REFI N I NG AN D MARKETI NG
Our challenge in refining and marketing has been to achieve double-digit
returns on capital employed in a business that has traditionally suffered from
low margins and relatively poor financial performance. We successfully met
this challenge in 2000. While returns were enhanced by improved refining
margins, our refining and marketing financial results, relative to competitors,
have improved dramatically since we reshaped our downstream asset base.
Our return on capital employed from refining and marketing operations
exceeded 12% in 2000.
Construction of the 58,000 barrel per day delayed coking unit and related
facilities has begun at the Virgin Islands refinery. The unit, which is sched-
uled to be completed during the second quarter of 2002, will further enhance
financial returns.
3
6. We continue to invest in retail marketing because we believe that over time
this business can deliver superior financial returns. In 2000, we acquired 178
Merit retail facilities, greatly strengthening our business in the metropolitan
Philadelphia, New York and Boston markets. We have rebranded nearly all
of these HESS.
We have reached agreement to form a joint venture to own and operate 141
WILCO retail facilities, which are located primarily in North Carolina, South
Carolina and Virginia. The gasoline will be sold under the HESS brand. We
also have agreed to purchase 53 Gibbs retail facilities, located primarily in
the Boston metropolitan area and southern New Hampshire. We will rebrand
them HESS. At the end of 2001, we expect to have about 1,150 HESS retail
facilities, more than double the number at the end of 1996, and we will be
the leading independent convenience retail marketer on the East Coast.
During 2000, we continued to expand our energy marketing business. Sales
of distillates and residual fuel oil increased as a result of colder weather in
the fourth quarter of 2000. Natural gas sales to industrial and commercial
customers were in excess of 500,000 Mcf per day at year-end 2000. We also
invested in innovative technologies to make alternate sources of energy avail-
able to our customers. We are manufacturing and marketing to industrial and
commercial customers a cogeneration unit that generates electricity and ther-
mal energy. We made an investment in a fuel cell company that designs and
develops integrated fuel cell systems capable of using multiple fuels to pro-
duce cleaner energy for both the stationary and vehicular markets.
C U R R E N T R ET U R N S TO S HAR E H O LD E R S
At its March 7, 2001 meeting, the Corporation’s Board of Directors increased
the regular quarterly dividend on the Common Stock to 30 cents per share
from 15 cents per share. The Board’s action reflects the Corporation’s contin-
uing commitment to increasing current returns to shareholders, the
Corporation’s sound financial condition and the positive outlook for the future.
In 2000, the Corporation’s Board of Directors authorized the expenditure of
$300 million to repurchase shares of Amerada Hess Common Stock. During
2000, $220 million was spent, leaving $80 million available for continued
share repurchases. Management and the Board of Directors continue to believe
that the Corporation’s Common Stock is an excellent investment.
4
7. R E S U LT S O F O P E R AT I O N S
Amerada Hess had record earnings of $1.023 billion ($11.38 per share) in 2000
compared with $438 million ($4.85 per share) in 1999. Earnings from opera-
tions were $987 million in 2000 compared with $307 million in 1999.
Exploration and production operating earnings were $868 million in 2000 com-
pared with $324 million in 1999. Operating earnings from refining and
marketing amounted to $288 million in 2000 versus $133 million in 1999.
Interest expense and other corporate charges were $169 million in 2000 com-
pared with $150 million in 1999. Special items contributed $36 million in
2000 compared with $131 million in 1999.
In 2000, sales and other operating revenues were $12 billion compared with
$7 billion in 1999. Capital expenditures were $938 million versus $797 mil-
lion in 1999. Details on results of operations appear under Management’s
Discussion and Analysis of Results of Operations and Financial Condition
beginning on page 19 of this Annual Report.
We express our appreciation to our employees for their dedication and con-
tributions. We are proud of their achievements in the past year. We thank
our Directors for their guidance and leadership. We thank our stockholders
for their strong support.
JOH N B. H ES S W. S . H . L A I D L A W
Chairman of the Board and President and
Chief Executive Officer Chief Operating Officer
March 7, 2001
5
8. Exploration and Production
U N I T E D S TAT E S
Amerada Hess, as operator, brought the Conger Field on Garden Banks Block 215, in which it has a
37.50% interest, onstream in December 2000. This Gulf of Mexico field is produced through a multi-
well, sub-sea system with topside support and processing facilities. Innovative technology was required
for the sub-sea system; it is the industry’s first use, on a field-wide scale, of 15,000 PSI horizontal sub-
sea tree technology. When development is completed in the second quarter of 2001, net production for
the Corporation is expected to peak at about 7,500 barrels of oil per day and 33,000 Mcf of natural gas
per day. The Conger sub-sea system is tied back to the Enchilada Complex in which Amerada Hess has
an interest.
First production from the Amerada Hess operated Northwestern Field (AHC 50%), on Garden Banks
Blocks 200 and 201, commenced in November 2000. The two-well, sub-sea system is tied back 16.5
miles to facilities at East Cameron Block 373. Production for Amerada Hess is expected to peak at 35,000
Mcf of natural gas and 800 barrels of condensate per day in 2001.
Amerada Hess drilled a successful development well in the Penn State Field (AHC 50%) that will be
completed in the second quarter of 2001, tied into existing sub-sea facilities and processed at the Bald-
pate platform. Net production from this well is expected to be 2,000 barrels of oil per day and 4,800 Mcf
of natural gas per day. Amerada Hess operates the Baldpate and Penn State Fields, which are located
on Garden Banks Blocks 259/260 and 216, respectively.
The Tulane Field (AHC 100%), on Garden Banks Block 158, is being developed as a single-well, sub-
sea satellite tieback. Detailed engineering is underway and initial production is expected late this year.
Production is expected to reach 35,000 Mcf of natural gas per day in 2002.
During 2000, Amerada Hess acquired interests in 22 blocks in Gulf of Mexico lease sales at a cost of
$19.6 million. Of these blocks, 13 are operated by Amerada Hess and 13 are located in water depths
exceeding 5,000 feet. Amerada Hess acquired 11 additional leases in the Gulf of Mexico in 2000 for
$2.8 million.
Onshore, Amerada Hess continued its drilling program in North Dakota, using horizontal drilling tech-
nology to optimize development of the Madison reservoir. The Corporation drilled 20 new wells in 2000
resulting in net incremental production of about 4,000 barrels of oil per day and 10,000 Mcf of natural
gas per day. Amerada Hess has an average interest of 86% in these wells. Additional drilling is planned
in this area for 2001.
6
11. UNITED KINGDOM
Two new fields were brought onstream in the United Kingdom in 2000. The Bittern Field, in which
Amerada Hess Limited, the Corporation’s British subsidiary, has a 28.28% interest, is being produced
through the Triton floating production, storage and offloading vessel which Amerada Hess Limited oper-
ates. Production for Amerada Hess Limited from the Bittern Field is expected to average about 16,000
barrels of crude oil and natural gas liquids per day and 15,000 Mcf of natural gas per day during 2001.
The Cook Field (AHL 28.46%) came onstream in April 2000 and also produces through a floating pro-
duction, storage and offloading vessel. Amerada Hess Limited’s share of production is expected to peak
at 5,100 barrels of oil per day in the second half of 2001.
Amerada Hess Limited acquired an additional 34.46% interest in the Ivanhoe, Rob Roy and Hamish
Fields in 2000 bringing its interest in those fields to more than 76%. The acquisition, plus additional
successful drilling, resulted in net production from these mature fields increasing to 7,000 barrels of
crude oil and natural gas liquids per day in 2000 compared with 4,100 barrels per day in 1999.
Two new developments have begun in the United Kingdom North Sea. Approval for development of
the Halley Field (AHL 40%) was received early in 2001. Production is expected to begin in 2001 and
to reach 7,000 barrels of oil per day and 12,000 Mcf of natural gas per day for Amerada Hess Limited
late in 2001. Development of the Skene Field (AHL 9.07%) is underway and is expected to produce
first gas by the end of 2001. Production for Amerada Hess Limited will peak at 30,000 Mcf of natural
gas per day in 2002.
Further natural gas discoveries were made in 2000. On Block 47/4a, the Minerva discovery (AHL 35%)
tested at rates exceeding 40,000 Mcf of natural gas per day. Minerva will be developed as part of the sec-
ond phase of the Easington Catchment Area project and should come onstream by the end of 2002.
A successful horizontal well discovered North Davy (AHL 28%) and tested at 100,000 Mcf of natural
gas per day. Initial gas production is expected by the end of 2001, with Amerada Hess Limited’s share
expected to peak at 12,000 Mcf of natural gas per day in 2002.
Studies continue for the development of the Goldeneye and Western Hub natural gas discoveries (AHL
13.75%) in the Outer Moray Firth. Early in 2001, a successful appraisal well was drilled on the South
Atlantic prospect (AHL 20%) which will be included in the development study.
Other activities in the United Kingdom included taking the first steps for the possible development of
the Clair Field, in which Amerada Hess Limited has a 9.29% interest, and the acquisition by Amerada
Hess Limited of a 17.50% interest in Block 204/14, which contains the Suilven oil discovery north-
west of the Schiehallion Field (AHL 15.67%).
9
12. N O R W AY
Amerada Hess Norge A/S, the Corporation’s Norwegian subsidiary, and its partners have obtained
approval for the enhanced-recovery, waterflood project for the Valhall Field in which Amerada Hess
Norge has a 28.09% interest. Initial water injection is expected to begin in 2003. The water injection
project will extend the life of the Valhall Field and is expected to increase Amerada Hess Norge’s share
of production from 23,400 barrels of oil per day in 2000 to in excess of 30,000 barrels per day in 2003.
The Valhall Field licenses have been extended to 2028 from 2011.
Early in 2001, oil was discovered on License 202 in the Barents Sea, offshore northern Norway. The
discovery will require further appraisal. Amerada Hess Norge has a 25% interest in the discovery.
Production in Norway averaged 31,000 barrels of oil equivalent per day in 2000, essentially the same
level of production as in 1999.
DEN MARK
The South Arne Field, operated by the Corporation’s Danish subsidiary, Amerada Hess ApS, completed
its first full-year of production in 2000. Production for Amerada Hess ApS averaged 25,300 barrels of
oil per day and 37,300 Mcf of natural gas per day. Development of the field continued in 2000 with one
water injection well and two development wells completed. High-rate water injection began in the fourth
quarter of 2000 to enhance recovery. Full-field water injection will begin in mid-2001 to increase pro-
duction and extend the life of the field.
Amerada Hess ApS is evaluating the possible drilling of an appraisal well on its Southern Tor prospect,
a potential extension of the South Arne Field. Amerada Hess ApS has a 57.48% interest in the South
Arne Field and in the Southern Tor prospect.
FA R O E I S L A N D S
Amerada Hess has been awarded operatorship of License 001 in the Faroes First Round of License
Awards. This license covers parts of Blocks 6005/20, 6005/25 and 6004/16 in the Faroe Islands, which
are northwest of the British Isles. An exploration well, in which Amerada Hess has a 42.76% interest,
is planned for the second half of 2001.
10
13. B RAZ I L
Amerada Hess Limitada, the Corporation’s Brazilian subsidiary, has interests in six blocks in Brazil
comprising 5.1 million gross acres and 1.9 million net acres in water depths ranging from 200 to 9,900
feet. Amerada Hess Limitada drilled its initial exploration wells in Brazil in 2000 on Blocks BC-8 in
the Campos Basin and BS-2 in the Santos Basin, in both of which it has a 32% interest. Both wells
encountered hydrocarbons. A second well on Block BS-2 is scheduled to be drilled in the first half of
2001. Amerada Hess Limitada has a 16% interest in Block BCe-2 in the Potiguar Basin. A well is expected
to be drilled in the first half of 2001. Extensive 3-D seismic covering Block BM-S-3 (AHL 45%) was
acquired during 2000. Interpretation of this data is taking place and an exploration well is planned on
this block in 2002.
In the Brazilian Second Licensing Round, Amerada Hess Limitada acquired an 85% interest in the
BM-Seal-5 Block and a 40% interest in the BM-Seal-4 Block, both of which are located in the Sergipe-
Alagoas Basin. Seismic data is being acquired.
I N DON ES IA
Early in 2001, agreement was reached for the sale of natural gas from the Jabung Production Sharing
Contract (PSC), in which Amerada Hess holds a 30% interest. Gross production from the Jabung PSC is
expected to average approximately 60,000 Mcf of natural gas per day beginning in the third quarter of
2003 and reach a maximum rate of approximately 130,000 Mcf of natural gas per day late in the decade.
As part of the project, liquefied petroleum gas and condensate are expected to be produced at gross rates
of 15,000 barrels per day and 11,000 barrels per day, respectively. Current gross crude oil production is
21,000 barrels per day. Production for Amerada Hess in Indonesia averaged 4,000 barrels of oil per
day and 10,000 Mcf of natural gas per day in 2000.
THAI LAN D
Net production for the Corporation from the Pailin Field in Thailand averaged 23,000 Mcf of natural
gas per day and 1,200 barrels of condensate per day in 2000. Phase two of the development of the field
has been approved and is expected to be brought onstream in July 2002. Phase two will provide the Cor-
poration with additional production of 25,000 Mcf of natural gas per day.
M A L AY S I A
In 2001, Amerada Hess acquired an 85% interest in the Block F PSC off the northern coast of Sarawak,
which covers approximately 8,000 square kilometers. The Company is processing existing seismic data
and acquiring additional seismic. Early in 2001, exploration drilling began on Blocks SK-306 (AHC 46%)
and PM-304 (AHC 41%) to evaluate the commercial potential of previous crude oil and natural gas dis-
coveries on these blocks.
11
14. ALG E R IA
In 2000, Amerada Hess acquired, for $55 million, the Gassi El Agreb redevelopment project in Algeria,
which covers the El Gassi, El Agreb and Zotti Fields. The Corporation expects to invest approximately
$500 million over the next five years to enhance recovery from the fields through an operating company
named SonaHess, which is a joint venture between Amerada Hess and Sonatrach, the Algerian national
oil company. The enhanced recovery project is designed to increase gross production from about 30,000
barrels of oil per day to 50,000 barrels per day late in 2003. Amerada Hess expects to receive net pro-
duction of about 14,000 barrels of oil per day from these fields in 2001 with peak entitlement production
expected to reach about 25,000 barrels of oil per day in 2006.
Amerada Hess also acquired exploration rights on Block 401/c, which is adjacent to the Hassi Berkine
region of Algeria, a prolific oil production area.
GABON
The Atora Field came onstream in February 2001. Amerada Hess Production Gabon, a 77.50% owned
Gabonese subsidiary of the Corporation, has a 40% interest in the field and expects its share of pro-
duction from the Atora Field to reach 6,000 barrels of oil per day in 2001 and to peak at 9,000 barrels
of oil per day in 2002.
Crude oil production for Amerada Hess in Gabon averaged 7,100 barrels per day in 2000 and is expected
to increase to about 9,000 barrels per day in 2001.
A Z E R BAIJAN
Amerada Hess increased its equity interests in the Azeri, Chirag and Guneshli Fields in Azerbaijan to
2.72% from 1.68% in 2000. Production for Amerada Hess in 2001 is expected to average approximately
5,500 barrels of oil per day. Options for expanding the oil export pipeline system to handle increased
volumes of oil production from Azerbaijan are being considered. The Corporation’s share of production
in Azerbaijan has the potential to rise to in excess of 20,000 barrels of oil per day in 2008, if pipeline
capacity is increased.
12
17. Refining and Marketing
REFINING
The St. Croix refinery, owned and operated by HOVENSA L.L.C., a joint venture between Amerada Hess
and Petroleos de Venezuela, S.A., benefitted from significantly improved refining margins in 2000 and
made a major contribution to the Corporation’s earnings. HOVENSA supplies refined petroleum prod-
ucts to both joint venture partners, including the bulk of the Corporation’s refined products for its East
Coast marketing business. HOVENSA continued to supply California with gasoline and distillates that
met that state’s strict environmental standards in 2000 during periods of shortages or tight supply.
During the year, HOVENSA began construction of the 58,000 barrel per day delayed coking unit. Upon
completion, the refinery will begin processing 115,000 barrels per day of heavy Venezuelan Merey crude
oil. The coker will enable the refinery to process crude oil that is heavier and less costly relative to other
crude oils processed at the refinery, thus improving profitability. The refinery will continue to process
at least 155,000 barrels per day of lighter Venezuelan Mesa crude oil. The delayed coking unit is sched-
uled to come onstream in the second quarter of 2002.
Early in 2001, HOVENSA brought the 140,000 barrel per day fluid catalytic cracking unit down for sched-
uled maintenance. This gasoline manufacturing unit was out of operation for approximately six weeks.
Immediately after the fluid catalytic cracking unit was brought back onstream, HOVENSA shut down
one of the large crude units at the refinery, both for scheduled maintenance and to upgrade it for inte-
gration with the delayed coking unit.
Total refinery runs at HOVENSA averaged 422,000 barrels per day in 2000, approximately the same level
as in 1999. The fluid catalytic cracking unit continued to operate at a peak rate of 140,000 barrels per
day during most of the year.
The Corporation’s Port Reading fluid catalytic cracking unit ran smoothly throughout 2000, generally
at a rate of about 60,000 barrels per day. The fluid catalytic cracking unit processes vacuum gas oil and
residual fuel oil to manufacture high-quality gasoline for HESS customers in the Northeast.
MARKETI NG
In November 2000, Convenience Store Decisions, a leading industry publication, named HESS EXPRESS
“2000 Convenience Store Chain of the Year.” The annual award, in its eleventh year, recognizes excel-
lence in convenience store chains in such areas as customer service, marketing innovation and market
share growth.
In 2000, Amerada Hess acquired 178 Merit retail gasoline stations which are concentrated in the New
York City, Boston and Philadelphia metropolitan areas. Nearly all of these locations have been rebranded
HESS, greatly strengthening the HESS brand in these areas.
15
18. Amerada Hess has agreed to purchase 53 company-operated retail facilities from Gibbs Oil Limited Part-
nership. The sites, most of which include convenience stores, are located primarily in the Boston
metropolitan area and southern New Hampshire. All will be rebranded HESS after closing, expected in
late April.
Late in 2000, Amerada Hess announced its intention to form a joint venture with North Carolina retail
marketer A.T. Williams Oil Company, which owns and operates 120 WILCO gasoline stations with con-
venience stores and 21 WILCO Travel Centers, located primarily in North Carolina, South Carolina and
Virginia. Under the agreement, gasoline and diesel will be sold under the HESS brand.
Amerada Hess continues to build high-volume HESS EXPRESS convenience retail facilities, upgrade
existing gasoline stations and convenience stores, make acquisitions in key geographic areas and increase
the number of independent HESS branded retailers. The number of HESS retail facilities increased to
929 at year-end 2000 from 701 at year-end 1999, and is expected to reach 1,150 by year-end 2001.
Amerada Hess opened 25 new HESS EXPRESS convenience stores in 2000 and began construction
on seven others. Forty-two retail sites were upgraded by adding convenience stores or rebuilding
existing facilities.
In energy marketing, a return to colder weather in the fourth quarter of 2000 resulted in an increase in
sales and profitability in the Corporation’s distillate and fuel oil businesses. In addition, through a series
of acquisitions, the Corporation nearly tripled its natural gas sales to industrial and commercial cus-
tomers in its core East Coast market area. At the end of 2000, natural gas sales to East Coast industrial
and commercial customers were averaging in excess of 500,000 Mcf per day. The Corporation is now
the leading unregulated natural gas supplier to these markets and is in a position to grow its electricity
sales as electricity markets open to competition.
During 2000, Amerada Hess entered the distributed electric generation business through its Hess Micro-
gen subsidiary. Hess Microgen manufactures and installs a reciprocating engine cogeneration unit that
generates electricity and thermal energy at commercial and industrial customer locations, providing these
customers with a low-cost alternative to purchasing power from higher cost local electric utilities. Approx-
imately 20 of these units have been installed and are in operation.
During 2000, Amerada Hess made a long-term technology development investment in fuel cells through
an investment in Nuvera Fuel Cells, Inc. This technology, designed to produce cleaner energy, poten-
tially has widespread applications in the automotive and onsite electricity generation sectors. Nuvera
is a joint venture among Amerada Hess, Arthur D. Little, Inc. and DeNora New Energy Investments B.V.,
an Italian company.
16
20. Index to Financial Information
Amerada Hess Corporation and Consolidated Subsidiaries
19 Financial Review
27 Statement of Consolidated Income;
Statement of Consolidated Retained Earnings
28 Consolidated Balance Sheet
30 Statement of Consolidated Cash Flows
31 Statements of Consolidated Changes in Preferred Stock,
Common Stock and Capital in Excess of Par Value;
Statement of Consolidated Comprehensive Income
32 Notes to Consolidated Financial Statements
45 Report of Management
46 Report of Ernst & Young LLP, Independent Auditors
47 Supplementary Oil and Gas Data
52 Ten-Year Summary of Financial Data
56 Ten-Year Summary of Operating Data
18
21. FI NANCIAL REVI EW
Amerada Hess Corporation and Consolidated Subsidiaries
Management’s Discussion and Analysis of The Corporation’s average selling prices, including the
Results of Operations and Financial Condition effects of hedging, were as follows:
Consolidated Results of Operations
2000 1999 1998
Net income amounted to $1,023 million in 2000, $438 mil-
Crude oil (per barrel)
lion in 1999 and a loss of $459 million in 1998. Operating
United States $23.97 $16.71 $12.56
earnings (income excluding special items) amounted to
Foreign 25.53 18.07 13.18
$987 million in 2000 compared with $307 million in 1999
Natural gas liquids (per barrel)
and a loss of $196 million in 1998.
United States 22.30 13.59 9.52
Foreign 23.41 14.29 10.42
The after-tax results by major operating activity for 2000,
Natural gas (per Mcf)
1999 and 1998 are summarized below:
United States 3.74 2.14 2.08
Foreign 2.20 1.79 2.26
2000 1999 1998
Millions of dollars
Exploration and production $ 868 $ 324 $ (18)
The Corporation’s net daily worldwide production was
Refining, marketing
as follows:
and shipping 288 133 (18)
Corporate (43) (31) (37)
Interest (126) (119) (123) 2000 1999 1998
Operating earnings (loss) 987 307 (196) Crude oil
Special items 36 131 (263) (thousands of barrels per day)
United States 55 55 37
Net income (loss) $1,023 $ 438 $ (459)
Foreign 185 159 153
Net income (loss) per
Total 240 214 190
share (diluted) $11.38 $ 4.85 $(5.12)
Natural gas liquids
(thousands of barrels per day)
Comparison of Results United States 12 10 8
Exploration and Production: Operating earnings from explo- Foreign 9 8 8
ration and production activities increased by $544 million
Total 21 18 16
in 2000, primarily due to significantly higher worldwide
crude oil selling prices, increased United States natural Natural gas
gas selling prices and higher crude oil sales volumes. (thousands of Mcf per day)
Operating earnings increased by $342 million in 1999, United States 288 338 294
largely due to higher crude oil selling prices, increased Foreign 391 305 282
sales volumes and reduced exploration expenses.
Total 679 643 576
Barrels of oil equivalent
(thousands of barrels per day) 374 339 302
19
22. The effective income tax rate on exploration and produc-
On a barrel of oil equivalent basis, the Corporation’s oil
tion earnings in 2000 was 41%, compared to an effective
and gas production increased by 10% in 2000 and 12% in
rate of 44% in 1999. Generally, this rate will exceed the
1999. The increase in foreign crude oil production in 2000
U.S. statutory rate because of special petroleum taxes,
was primarily due to a full year of production from the
principally in the United Kingdom and Norway. The effec-
South Arne Field in Denmark. United Kingdom produc-
tive rate in 2000 was lower than in 1999 due to the timing
tion was also higher, largely due to new production from
of deductions for certain prior year foreign drilling costs.
the Bittern Field and an increased interest in the Ivanhoe
and Rob Roy Fields. Increased natural gas production
from new and existing fields in the United Kingdom, Crude oil and natural gas selling prices continue to be
Denmark and Thailand offset declining natural gas pro- volatile, and should prices decline, there would be a nega-
duction in the United States. Late in 2000, production tive effect on future earnings. However, the Corporation
commenced from the Conger and Northwestern Fields has hedged a substantial amount of 2001 crude oil produc-
in the Gulf of Mexico, which will increase United States tion and, to a lesser extent 2002 production, which will
natural gas production in 2001. mitigate the effect if prices decline in those years.
The 1999 increase in crude oil production was primarily Refining, Marketing and Shipping: Operating earnings for
attributable to the Baldpate Field in the Gulf of Mexico, refining, marketing and shipping activities increased
which commenced production in late 1998, and new pro- to $288 million in 2000 compared with income of
duction from the South Arne Field. The 1999 increase in $133 million in 1999 and a loss of $18 million in 1998. The
foreign natural gas production reflected increases in the Corporation’s downstream operations include HOVENSA
North Sea, Indonesia and Thailand. L.L.C. (HOVENSA), a 50% owned refining joint venture
with a subsidiary of Petroleos de Venezuela S.A. (PDVSA),
Production expenses were higher in 2000, primarily due accounted for on the equity method. Additional refining
to increased oil and gas production volumes and, on a per and marketing operations include a fluid catalytic crack-
barrel basis, due to changes in the mix of producing fields. ing facility in Port Reading, New Jersey, as well as retail
Depreciation, depletion and amortization charges were gasoline stations, energy marketing activities, shipping
higher in 2000, also reflecting increased production vol- and trading.
umes, although the per barrel rate for depreciation and
related costs was comparable to the 1999 and 1998 HOVENSA: The Corporation’s share of HOVENSA’s
amounts. Exploration expense was higher in 2000, primar- income was $121 million in 2000 compared with $7
ily due to increased drilling and seismic purchases in million in 1999 and $24 million in 1998, when the refinery
the Gulf of Mexico and increased exploration activity in was wholly-owned for the first ten months of the year.
international areas (outside of the North Sea). Explora- Refined product margins were significantly improved in
tion expense in 1999 was lower than in 1998 as a result 2000, particularly for gasolines and distillates. Through-
of a planned reduction in the exploration program. out most of 1999 refined product margins were weak. The
General and administrative expenses related to explo- Corporation’s share of HOVENSA’s refinery runs
ration and production activities were comparable in amounted to 211,000 barrels per day in 2000 and 209,000
2000 and 1999, but somewhat lower than in 1998, due to in 1999. Income taxes on HOVENSA’s results are offset by
cost reduction initiatives in the United States and United available loss carryforwards.
Kingdom. The total cost per barrel of production, depre-
ciation, exploration and administrative expenses was Operating earnings from refining, marketing and
$11.70 in 2000, $11.75 in 1999 and $13.80 in 1998 (exclud- shipping activities also include interest income on the
ing special charges). note received from PDVSA at the formation of the joint
venture. Interest on the PDVSA note amounted to $48 mil-
lion in 2000, $47 million in 1999 and $8 million in 1998.
Interest is reflected in non-operating income in the
income statement.
20
23. HOVENSA has been accounted for on the equity method Corporate: Net corporate expenses amounted to $43 mil-
since the formation of the joint venture in November 1998. lion in 2000, $31 million in 1999 and $37 million in 1998.
Prior to that time, refinery results were consolidated. In The increase in 2000 reflects lower earnings of an insur-
1998, the following amounts for HOVENSA were included ance subsidiary and higher compensation and related
in the Corporation’s income statement (in millions): sales costs. In 1999, earnings from the insurance subsidiary
revenue — $622, cost of products sold — $439, operating included dividends from reinsurers, which exceeded
expenses — $83 and depreciation — $70. dividends received in 2000.
Retail, energy marketing and other: Results from retail Interest: After-tax interest expense increased slightly in
gasoline operations declined in 2000 compared with 2000 compared with 1999. The increase was due to higher
1999 as selling prices generally did not keep pace with interest rates and lower amounts capitalized, partially off-
rising product costs. Results of energy marketing activities set by reduced average borrowings.
improved in 2000, largely reflecting increased seasonal
demand for fuel oils. Earnings from the Corporation’s cat- Consolidated Operating Revenues: Sales and other operating
alytic cracking facility in New Jersey also improved in revenues increased by 70% in 2000 principally reflecting
2000 reflecting improved refining margins. Total refined significantly higher worldwide crude oil, natural gas
product sales volumes increased to 134 million barrels in and refined product selling prices. Sales volumes of for-
2000 from 126 million barrels in 1999. eign crude oil and natural gas also increased, as well as
sales of refined products and purchased natural gas in the
Marketing expenses increased in 2000 compared with United States.
1999 reflecting expanded retail operations, including the
cost of operating acquired gasoline stations and an Sales and other operating revenues increased by approxi-
increased number of convenience stores. Other operating mately 18% in 1999, excluding third party sales of the
expenses increased in 2000, largely reflecting higher fuel St. Croix refinery in 1998. The increase in the Corpora-
costs for the catalytic cracking facility in New Jersey and tion’s revenues in 1999 was principally due to higher
the Corporation’s shipping operations. crude oil and refined product selling prices and increased
crude oil and natural gas sales volumes.
The Corporation has a 50% voting interest in a consolidated
partnership which trades energy commodities and deriva-
tives. The Corporation also takes forward positions on
energy contracts in addition to its hedging program. The
combined results of these trading activities were gains of
$22 million in 2000, $19 million in 1999 and a loss of
$26 million in 1998. Expenses of the trading partnership are
included in marketing expenses in the income statement.
Refining, marketing and shipping results were higher in
1999 than in 1998, primarily due to improved results from
the catalytic cracking facility in New Jersey, higher earn-
ings from retail operations and increased trading income.
Future results of the Corporation’s refining and marketing
operations will continue to be volatile, reflecting competi-
tive industry conditions and supply and demand factors,
including the effects of weather.
21
24. Special Items Asset impairments in 1999 included $34 million for the
After-tax special items in 2000, 1999 and 1998 are summa- Corporation’s crude oil storage terminal in St. Lucia as a
rized below: result of a storage contract that was not renewed. The car-
rying value of the terminal had been partially impaired in
1998 reflecting the reduced crude oil storage requirements
Refining,
of the HOVENSA joint venture. Net charges of $38 million
Exploration Marketing
and and were also recorded in 1999 for the write-down in book
Millions of dollars Total Production Shipping Corporate
value of the Corporation’s interest in the Trans Alaska
2000 Pipeline System.
Gain on termination
of acquisition $ 60 $ — $ — $60 The Corporation also recorded a 1999 net charge of
Costs associated with $27 million for the additional decline in value of a drilling
research and devel- service fixed-price contract, due to lower market rates.
opment venture (24) — (24) — The Corporation had previously impaired drilling service
contracts in 1998 by recording a charge of $77 million.
Total $ 36 $ — $ (24) $60
Payments on the drilling service contracts were com-
1999 pleted by December 31, 2000 and the remaining reserve of
Gain on asset sales $ 176 $ 30 $ 146 $— $14 million was reversed to income.
Income tax benefits 54 54 — —
Impairment of assets Liquidity and Capital Resources
and operating leases (99) (65) (34) — Net cash provided by operating activities, including
changes in operating assets and liabilities amounted to
Total $ 131 $ 19 $ 112 $—
$1,843 million in 2000, $770 million in 1999 and $519 mil-
1998
lion in 1998. The increases in 2000 and 1999 reflect
Gain (loss) on
improved earnings and changes in operating assets and
asset sales $ (50) $ 56 $(106) $—
liabilities. Excluding balance sheet changes, operating
Impairment of assets
cash flow was $1,948 million in 2000, $1,116 million in
and operating leases (198) (154) (44) —
1999 and $521 million in 1998.
Severance (15) (15) — —
In 1999 and 1998, the Corporation generated additional
Total $(263) $(113) $(150) $—
cash of $395 million and $468 million, respectively, from
the proceeds of asset sales.
The 2000 gain on termination of the proposed acquisition
of another oil company principally reflects foreign cur-
The amount of the Corporation’s cash and cash equiva-
rency gains on pound sterling contracts which were pur-
lents increased to $312 million at December 31, 2000. Total
chased in anticipation of the acquisition. These contracts
debt was $2,050 million at December 31, 2000 compared
were sold in the fourth quarter resulting in an after-tax
with $2,310 million at December 31, 1999. The debt to
gain of $53 million. Also included in this special item is
capitalization ratio decreased to 35% at December 31,
income from a fee on termination of the acquisition, par-
2000 from 43% at year-end 1999. At December 31, 2000,
tially offset by transaction costs. The charge of $24 million
substantially all of the Corporation’s outstanding debt
reflects costs associated with an alternative fuel research
was fixed-rate debt. The Corporation had $2 billion of
and development venture.
additional borrowing capacity available under its revolv-
ing credit agreements and unused lines of credit under
The gain on asset sales of $146 million in 1999 reflects
uncommitted arrangements with banks of $216 million
the sale of the Corporation’s Gulf Coast and Southeast
at December 31, 2000.
pipeline terminals and certain retail sites. The Corpora-
tion also sold natural gas properties in California, result-
In January 2001, the Corporation replaced its existing
ing in an after-tax gain of $30 million. Special income tax
revolving credit facilities with two new committed facili-
benefits of $54 million represent the United States tax
ties totalling $3 billion. These facilities provide $1.5 bil-
impact of certain prior year foreign exploration activities
lion of short-term borrowing capacity and $1.5 billion
and the recognition of capital losses.
of five-year revolving credit.
22
25. The Corporation’s Board of Directors approved a $300 mil- During 2000, the Corporation agreed with the Algerian
lion stock repurchase program in March 2000. Through National Oil Company to acquire a 49% interest in three
December 31, 2000, 3,444,000 shares have been repur- producing Algerian oil fields. The Corporation paid $55
chased for $220 million. million in 2000 for the redevelopment project and will
invest up to $500 million over the next five years for new
The Corporation conducts foreign exploration and pro- wells, workovers of existing wells and water injection and
duction activities in the United Kingdom, Norway, Den- gas compression facilities. A significant portion of the
mark, Gabon, Indonesia, Thailand, Azerbaijan, Algeria future expenditures will be funded by the cash flows from
and in other countries. The Corporation also has a refining these fields. The Corporation also purchased an additional
joint venture with a Venezuelan company. Therefore, the 1.04% interest in three fields in Azerbaijan. The total pur-
Corporation is subject to the risks associated with foreign chase price was approximately $70 million, of which
operations. These exposures may include political risk, $45 million is payable over the next two years. The Cor-
credit risk and currency risk. There have not been any poration now owns a 2.72% interest in these fields.
material adverse effects on the Corporation’s results of
operations or financial condition as a result of its dealings During 2000, the Corporation acquired the remaining out-
with foreign entities. standing stock of the Meadville Corporation for $168 mil-
lion in cash, deferred payments and preferred stock.
Capital Expenditures The purchase included 178 Merit retail gasoline stations
The following table summarizes the Corporation’s capital located in the northeastern United States. During the
expenditures in 2000, 1999 and 1998: year, the Corporation also purchased certain energy
marketing operations.
2000 1999 1998
Millions of dollars
The decrease in capital expenditures in 1999 compared
Exploration and production with 1998, reflects the completion of several major devel-
Exploration $167 $101 $ 242 opment projects and the reduced 1999 exploration pro-
Production and development 536 626 915 gram. Although not included in capital expenditures
Acquisitions 80 — 150 above, the Corporation increased its investment in Pre-
mier Oil plc, an equity affiliate, by $59 million in 1999.
783 727 1,307
Acquisitions in 1998 included $100 million for explo-
Refining, marketing and shipping ration and production interests in Azerbaijan.
Operations 109 70 132
Acquisitions 46 — — Capital expenditures in 2001 are currently expected to be
approximately $1,050 million, excluding the acquisitions
155 70 132
referred to below. It is anticipated that these expenditures
Total $938 $797 $1,439
will be financed by internally generated funds.
23
26. The Corporation has announced several acquisitions The Corporation owns an interest in a partnership that
which, if completed as anticipated, will involve addi- trades energy commodities and energy derivatives. The
tional capital expenditures in 2001. These expenditures accounts of the partnership are consolidated with those of
will be financed primarily with internally generated funds the Corporation. The Corporation also takes trading posi-
supplemented by borrowings to the extent necessary. The tions for its own account.
Corporation reached agreement to purchase substantially
all of the assets of a privately held exploration and pro- The Corporation uses value at risk to estimate the poten-
duction company for approximately $750 million, after tial effects of changes in fair values of derivatives and
expected closing adjustments. The properties acquired other instruments used in hedging activities and deriva-
are located on the Gulf of Mexico shelf and onshore tives and commodities used in trading activities. This
Louisiana. Production currently is averaging approxi- method determines the potential one-day change in fair
mately 200,000 Mcf of natural gas equivalent per day and value with 95% confidence. The analysis is based on his-
is expected to rise to 250,000 Mcf of natural gas equivalent torical simulation and other assumptions. The value at
per day in 2003. The Corporation also has agreed to pur- risk is summarized below:
chase three natural gas properties in the Gulf of Mexico
for approximately $95 million, which will add natural gas
Hedging Trading
production of approximately 30,000 Mcf per day. In Millions of dollars Activities Activities
addition, the Corporation will invest approximately $90
2000
million in a 50% owned joint venture which will operate
At December 31 $36 $16
120 gasoline stations and 21 travel centers. The Corpora-
Average for the year 25 15
tion will also acquire a chain of 53 retail outlets that will
High during the year 36 18
be financed with operating leases.
Low during the year 17 9
1999
Derivative Instruments
At December 31 $ 13 $6
The Corporation is exposed to market risks related to vola-
Average for the year 6 7
tility in the selling prices of crude oil, natural gas and
High during the year 13 10
refined products, as well as to changes in interest rates
Low during the year 2 5
and foreign currency values. Derivative instruments are
used to reduce these price and rate fluctuations. The Cor-
poration has guidelines for, and controls over, the use of
The Corporation may use interest-rate swaps to balance
derivative instruments.
exposure to interest rates. At December 31, 2000, the Cor-
poration has substantially all fixed-rate debt and no inter-
The Corporation uses futures, forwards, options and
est-rate swaps. At December 31, 1999, the Corporation had
swaps to reduce the effects of changes in the selling prices
$400 million of notional value, interest-rate swaps that
of crude oil, natural gas and refined products. These
decreased its percentage of floating-rate debt to 24%. The
instruments fix the selling prices of a portion of the Cor-
Corporation’s outstanding debt of $2,050 million has a fair
poration’s products and the related gains or losses are
value of $2,149 million at December 31, 2000 ($2,299 at
an integral part of the Corporation’s selling prices. In the
December 31, 1999). A 10% change in interest rates would
fourth quarter of 2000, the Corporation hedged an
change the fair value of debt at December 31, 2000 by
increased percentage of its crude oil production in antici-
$110 million. The impact of a 10% change in interest rates
pation of the proposed acquisition of another oil company.
on debt and related interest rate swaps at December 31,
As a result, at December 31 the Corporation had open
1999 was $120 million.
hedge positions equal to 65% of its estimated 2001
worldwide crude oil production and 25% of its 2002
production. The Corporation also has hedges covering
15% of its 2001 United States natural gas production. The
Corporation also uses derivatives in its energy marketing
activities to fix the purchase prices of energy products
sold under fixed-price contracts. As market conditions
change, the Corporation will adjust its hedge positions.
24
27. The Corporation uses foreign exchange contracts to The regulation of motor fuels in the United States and else-
reduce its exposure to fluctuating foreign exchange rates, where continues to be an area of considerable change and
principally the pound sterling. At December 31, 2000, the will require large capital expenditures in future years. In
Corporation has $438 million of notional value foreign December 1999, the United States Environmental Protection
exchange contracts ($865 million at December 31, 1999). Agency (“EPA”) adopted rules that phase in limitations on
Generally, the Corporation uses these foreign exchange the sulfur content of gasoline beginning in 2004. In Decem-
contracts to fix the exchange rate on net monetary liabili- ber 2000, EPA adopted regulations to substantially reduce
ties of its North Sea operations. The change in fair value of the allowable sulfur content of diesel fuel by 2006. EPA is
the foreign exchange contracts from a 10% change in the also considering restrictions or a prohibition on the use of
exchange rate is estimated to be $40 million at December MTBE, a gasoline additive that is produced by Port Reading
31, 2000 ($90 million at December 31, 1999). During the and HOVENSA and is used primarily to meet United States
fourth quarter of 2000, the Corporation purchased signifi- regulations requiring oxygenation of reformulated gaso-
cant amounts of sterling foreign exchange contracts in lines. California and several other states have already
anticipation of the proposed acquisition of another oil adopted a ban on MTBE use beginning in 2003.
company. As discussed earlier, these contracts were sold
before the end of the year, resulting in a special, after-tax The Corporation and HOVENSA are reviewing options to
gain of $53 million. determine the most cost effective compliance strategies
for these fuel regulations. The costs to comply will
Environment and Safety depend on a variety of factors, including the availability
of suitable technology and contractors, the outcome of
Improvement in environmental and safety performance
anticipated litigation regarding the diesel sulfur rule and
continues to be a goal of the Corporation. The Corporation’s
whether the minimum oxygen content requirement for
awareness of its environmental responsibilities and envi-
reformulated gasoline remains in place if MTBE is
ronmental regulations at the federal, state and local levels
banned. Other fuel regulations are also under considera-
have led to programs on energy conservation, pollution
tion which could result in additional capital expendi-
control and waste minimization and treatment. To ensure
tures. Future capital expenditures necessary to comply
that the Corporation meets its goals and the requirements
with these regulations may be substantial.
of regulatory authorities, the Corporation also has pro-
grams for compliance evaluation, facility auditing and
employee training to monitor operational activities. The Corporate programs and improved equipment and tech-
trend toward environmental performance improvement nologies have reduced the number and size of spills
raises the Corporation’s operating costs and requires requiring remediation. However, the Corporation expects
increased capital investments. continuing expenditures for environmental assessment
and remediation related primarily to existing conditions.
Sites where corrective action may be necessary include
The Port Reading refining facility and the HOVENSA
gasoline stations, terminals, onshore exploration and pro-
refinery presently produce gasolines that meet or exceed
duction facilities, refineries (including solid waste man-
the current United States requirements for conventional
agement units under permits issued pursuant to the
and reformulated gasolines, including the requirements for
Resource Conservation and Recovery Act) and, although
reformulated gasolines that took effect in 2000 which fur-
not significant, “Superfund” sites where the Corporation
ther mandated decreases in emissions of volatile and toxic
has been named a potentially responsible party. The Cor-
organic compounds. In addition, the HOVENSA refinery
poration expects that existing reserves for environmental
has desulfurization capabilities enabling it to produce low-
liabilities will adequately cover costs to assess and reme-
sulfur diesel fuel. However, regulatory changes already
diate known sites.
made or anticipated in the United States will alter the com-
position and emissions characteristics of motor fuels.
The Corporation expended $7 million in 2000, $8 million
in 1999 and $9 million in 1998 for remediation. In addi-
tion, capital expenditures for facilities, primarily to com-
ply with federal, state and local environmental standards,
were $5 million in 2000, $2 million in 1999 and $4 million
in 1998.
25
28. The Corporation strives to provide a safe working environ- Quarterly Financial Data
ment for its employees, contractors, customers and the Quarterly results of operations for the years ended Decem-
public. To achieve this goal, the Corporation sets perfor- ber 31, 2000 and 1999 follow:
mance objectives and targets for continual improvement.
Programs are in place to enhance safety awareness and
Sales Net
knowledge of safety policies. Inspections and audits are Millions of and other income
dollars, except operating Operating Special Net per share
used to monitor performance.
per share data revenues earnings items income (diluted)
2000
Forward Looking Information
First $ 2,831 $224 $ — $ 224 $2.47
Certain sections of the Financial Review, including refer-
Second 2,644 202 — 202 2.24
ences to the Corporation’s future results of operations and
Third 2,833 257 — 257 2.86
financial position, capital expenditures, derivative
36(a)
Fourth 3,685 304 340 3.83
disclosures and environmental sections, represent for-
ward looking information. Forward looking disclosures Total $11,993 $987 $ 36 $1,023
are based on the Corporation’s current understanding and
1999
assessment of these activities and reasonable assumptions
$ 30(b) $
First $ 1,539 $ 41 71 $ .79
about the future. Actual results may differ from these dis-
40(b)
Second 1,430 37 77 .86
closures because of changes in market conditions, govern-
106(b)
Third 1,801 53 159 1.75
ment actions and other factors.
(45)(c)
Fourth 2,269 176 131 1.45
Dividends Total $ 7,039 $ 307 $131 $ 438
Cash dividends on common stock totaled $.60 per share
(a) Includes a net gain of $60 million on termination of acquisition,
($.15 per quarter) during 2000 and 1999. In March 2001, partially offset by a charge of $24 million for costs associated with a
the Corporation increased its quarterly dividend to $.30 research and development venture.
(b) Represents after-tax gains on asset sales.
per share.
(c) Includes special income tax benefits of $54 million, offset by
impairment of assets and operating leases of $99 million.
Stock Market Information
The common stock of Amerada Hess Corporation is trad-
The results of operations for the periods reported herein
ed principally on the New York Stock Exchange (ticker
should not be considered as indicative of future operating
symbol: AHC). High and low sales prices in 2000 and
results.
1999 were as follows:
2000 1999
Quarter Ended High Low High Low
3 13 1
433⁄4
March 31 65 ⁄4 47 ⁄16 53 ⁄4
701⁄8 611⁄16 653⁄8 4715⁄16
June 30
7415⁄16 571⁄4 665⁄16 563⁄4
September 30
761⁄4 581⁄8 631⁄16 531⁄2
December 31
26
29. S TAT E M E N T O F C O N S O L I D AT E D I N C O M E
Amerada Hess Corporation and Consolidated Subsidiaries
For the Years Ended December 31
2000 1999 1998
Millions of dollars, except per share data
Revenues
Sales (excluding excise taxes) and other
operating revenues $11,993 $7,039 $6,580
Non-operating income
Gain (loss) on asset sales — 273 (26)
Equity in income (loss) of HOVENSA L.L.C. 121 7 (16)
Other 163 142 83
Total revenues 12,277 7,461 6,621
Costs and Expenses
Cost of products sold 7,883 4,240 4,373
Production expenses 557 487 518
Marketing expenses 542 387 379
Exploration expenses, including dry holes
and lease impairment 289 261 349
Other operating expenses 234 217 224
General and administrative expenses 224 232 271
Interest expense 162 158 153
Depreciation, depletion and amortization 714 649 662
Impairment of assets and operating leases — 128 206
Total costs and expenses 10,605 6,759 7,135
Income (loss) before income taxes 1,672 702 (514)
Provision (benefit) for income taxes 649 264 (55)
Net Income (Loss) $ 1,023 $ 438 $ (459)
Net Income (Loss) Per Share
Basic $ 11.48 $ 4.88 $ (5.12)
Diluted 11.38 4.85 (5.12)
S TAT E M E N T O F C O N S O L I D AT E D R E TA I N E D E A R N I N G S
For the Years Ended December 31
2000 1999 1998
Millions of dollars, except per share data
Balance at Beginning of Year $ 2,287 $1,904 $2,463
Net income (loss) 1,023 438 (459)
Dividends declared — common stock
($.60 per share in 2000, 1999 and 1998) (54) (55) (55)
Common stock acquired and retired (187) — (45)
Balance at End of Year $ 3,069 $2,287 $1,904
See accompanying notes to consolidated financial statements.
27
30. C O N S O L I D AT E D B A L A N C E S H E E T
Amerada Hess Corporation and Consolidated Subsidiaries
At December 31
2000 1999
Millions of dollars; thousands of shares
Assets
Current Assets
Cash and cash equivalents $ 312 $ 41
Accounts receivable
Trade 2,949 1,112
Other 47 63
Inventories 401 373
Other current assets 406 239
Total current assets 4,115 1,828
Investments and Advances
HOVENSA L.L.C. 831 710
Other 219 282
Total investments and advances 1,050 992
Property, Plant and Equipment
Exploration and production 10,499 9,974
Refining, marketing and shipping 1,399 1,091
Total — at cost 11,898 11,065
Less reserves for depreciation, depletion, amortization and
lease impairment 7,575 7,013
Property, plant and equipment — net 4,323 4,052
Note Receivable 443 539
Deferred Income Taxes and Other Assets 343 317
Total Assets $10,274 $ 7,728
28
31. At December 31
2000 1999
Liabilities and Stockholders’ Equity
Current Liabilities
Accounts payable — trade $ 1,875 $ 772
Accrued liabilities 1,158 625
Taxes payable 440 159
Notes payable 7 18
Current maturities of long-term debt 58 5
Total current liabilities 3,538 1,579
Long-Term Debt 1,985 2,287
Deferred Liabilities and Credits
Deferred income taxes 510 442
Other 358 382
Total deferred liabilities and credits 868 824
Stockholders’ Equity
Preferred stock, par value $1.00, 20,000 shares authorized
3% cumulative convertible series
Authorized — 330 shares
Issued — 327 shares in 2000 ($16 million liquidation preference) — —
Common stock, par value $1.00
Authorized — 200,000 shares
Issued — 88,744 shares in 2000; 90,676 shares in 1999 89 91
Capital in excess of par value 864 782
Retained earnings 3,069 2,287
Accumulated other comprehensive income (139) (122)
Total stockholders’ equity 3,883 3,038
Total Liabilities and Stockholders’ Equity $10,274 $7,728
The consolidated financial statements reflect the successful efforts method of accounting for oil and gas exploration and producing activities.
See accompanying notes to consolidated financial statements.
29
32. S TAT E M E N T O F C O N S O L I D AT E D C A S H F L O W S
Amerada Hess Corporation and Consolidated Subsidiaries
For the Years Ended December 31
2000 1999 1998
Millions of dollars
Cash Flows From Operating Activities
Net income (loss) $ 1,023 $ 438 $ (459)
Adjustments to reconcile net income (loss) to net cash
provided by operating activities
Depreciation, depletion and amortization 714 649 662
Impairment of assets and operating leases — 128 206
Exploratory dry hole costs 133 69 160
Lease impairment 33 36 31
(Gain) loss on asset sales — (273) 26
Provision (benefit) for deferred income taxes 164 62 (138)
Undistributed earnings of affiliates (119) 7 33
1,948 1,116 521
Changes in other operating assets and liabilities
(Increase) decrease in accounts receivable (1,792) (155) 6
(Increase) decrease in inventories (23) 80 122
Increase (decrease) in accounts payable, accrued
liabilities and deferred revenue 1,617 (175) 186
Increase (decrease) in taxes payable 272 53 (87)
Changes in prepaid expenses and other (179) (149) (229)
Net cash provided by operating activities 1,843 770 519
Cash Flows From Investing Activities
Capital expenditures
Exploration and production (783) (727) (1,307)
Refining, marketing and shipping (155) (70) (132)
Total capital expenditures (938) (797) (1,439)
Investment in affiliates (38) (59) —
Proceeds from asset sales and other 27 432 503
Net cash used in investing activities (949) (424) (936)
Cash Flows From Financing Activities
Issuance (repayment) of notes (11) 15 (14)
Long-term borrowings — 990 848
Repayment of long-term debt (396) (1,348) (317)
Cash dividends paid (54) (54) (55)
Common stock acquired (220) — (59)
Stock options exercised 59 18 —
Net cash provided by (used in) financing activities (622) (379) 403
Effect of Exchange Rate Changes on Cash (1) — (3)
Net Increase (Decrease) in Cash and Cash Equivalents 271 (33) (17)
Cash and Cash Equivalents at Beginning of Year 41 74 91
Cash and Cash Equivalents at End of Year $ 312 $ 41 $ 74
See accompanying notes to consolidated financial statements.
30
33. S TAT E M E N T O F C O N S O L I D AT E D C H A N G E S I N P R E F E R R E D S T O C K ,
C O M M O N S T O C K A N D C A P I TA L I N E X C E S S O F PA R VA L U E
Amerada Hess Corporation and Consolidated Subsidiaries
Preferred Stock Common stock
Capital in
Number of Number of excess of
shares Amount shares Amount par value
Millions of dollars; thousands of shares
Balance at January 1, 1998 — $ — 91,451 $ 91 $ 775
Cancellations of nonvested common
stock awards (net) — — (26) — (2)
Common stock acquired and retired — — (1,071) (1) (9)
Employee stock options exercised — — 3 — —
Balance at December 31, 1998 — — 90,357 90 764
Cancellations of nonvested common
stock awards (net) — — (3) — —
Employee stock options exercised — — 322 1 18
Balance at December 31, 1999 — — 90,676 91 782
Distributions to trustee of nonvested
common stock awards (net) — — 461 — 28
Common stock acquired and retired — — (3,475) (3) (31)
Employee stock options exercised — — 1,082 1 69
Issuance of preferred stock 327 — — — 16
Balance at December 31, 2000 327 $ — 88,744 $89 $864
S TAT E M E N T O F C O N S O L I D AT E D C O M P R E H E N S I V E I N C O M E
For the Years Ended December 31
2000 1999 1998
Millions of dollars
Components of Comprehensive Income (Loss)
Net income (loss) $1,023 $438 $(459)
Change in foreign currency translation adjustment (17) (7) (2)
Comprehensive Income (Loss) $1,006 $431 $(461)
See accompanying notes to consolidated financial statements.
31