Economic Risk Factor Update: April 2024 [SlideShare]
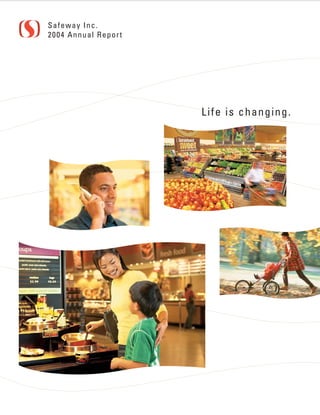
safeway 2004 Annual Report
1. Safew ay I nc.
2004 Annu al Report
Li fe is c h a n g i n g .
2. Safeway Inc. is one of the largest food and drug retailers in North America. As of January 1, 2005,
the company operated 1,802 stores in the Western, Southwestern, Rocky Mountain, Midwestern and
Mid-Atlantic regions of the United States and in western Canada. In support of its stores, Safeway
has an extensive network of distribution, manufacturing and food processing facilities.
Percentage of Stores with
Specialty Departments
2004
Bakery 94%
Deli 96
Floral 93
Pharmacy 74
Manufacturing and Processing Facilities
Year-end 2004
U.S. Canada
Milk Plants 6 3
Bread Baking Plants 5 2
Ice Cream Plants 2 2
Cheese and Meat Packaging Plants – 2
Soft Drink Bottling Plants 4 –
Fruit and Vegetable Processing Plants 1 3
Other Food Processing Plants 2 –
Pet Food Plant 1 –
21 12
Contents
2 Letter to Stockholders
5 Editorial Material
14 Financial Contents
56 Directors and Principal Officers
57 Investor Information
3. Financial Highlights
53 Weeks 52 Weeks
52 Weeks
2003 2002
2004
(Dollars in millions, except per-share amounts)
F o r t h e Ye a r :
Sales and other revenue $35,822.9 $35,727.2 $34,917.2
Gross profit 10,595.3 10,724.2 10,996.4
Operating profit 1,172.8 573.9 947.6
Net income (loss) 560.2 (169.8) (828.1)
Diluted earnings (loss) per share: 1.25 (0.38) (1.77)
Cash capital expenditures 1,212.5 935.8 1,467.4
A t Ye a r E n d :
Common shares outstanding (in millions) (Note 1) 447.7 444.2 441.0
Retail square feet (in millions) 82.1 82.6 81.5
Number of stores 1,802 1,817 1,808
Note 1: Net of 130.8 million, 131.2 million and 132.0 million shares held in treasury in 2004, 2003 and 2002, respectively.
S A F E WAY I N C . 2 0 0 4 A N N U A L R E P O R T 1
4. To O u r S t o c k h o l d e r s
While 2004 was another difficult year for our industry, we made solid progress on several fronts
and laid a strong foundation to support future growth. Among our most notable achievements,
we generated exceptionally strong cash flow from operations, which allowed us to significantly
reduce total debt; we dramatically improved the quality, selection and presentation of our
perishable offerings; and we began the rollout of our highly successful Lifestyle stores through
an aggressive remodeling program. We also made substantial progress restructuring labor
contracts, which we believe will enable us to compete more effectively going forward.
Results From Operations
Net income was $560.2 million ($1.25 per diluted share) in 2004 compared to a loss of $169.8
million ($0.38 per diluted share) in 2003.
As indicated in the table at the bottom of page 4, results for 2004 include total estimated
charges of approximately $308.1 million, after tax ($0.68 per diluted share), related to the
following items:
• Estimated impact of the Southern California strike;
• Dominick’s store closures;
• Contributions to a UFCW multi-employer health and welfare plan in Northern California; and
• A lease expense adjustment in accordance with recent SEC guidance on “rent holidays.”
Excluding these items, 2004 earnings would have been $1.93 per diluted share.1
For 2003, the same table outlines a total of almost $1.1 billion in after-tax charges
($2.43 per diluted share), related to the following items:
• Estimated impact of the Southern California strike;
• Dominick’s impairment charges;
• Randall’s impairment charges;
• Miscellaneous investments write-off;
• Inventory accounting change; and
• Restructuring and other expenses.
Excluding these items, net income in 2003 would have been $2.05 per diluted share.1
Sales
Total sales rose only slightly to $35.8 billion in 2004 from $35.7 billion in 2003, primarily
because of the strike and the extra week of operation in fiscal 2003, which was a 53-week year.
Excluding strike-affected stores, comparable-store sales increased 1.5%, while identical-store
sales (which do not include replacement stores) rose 0.9%. Further excluding fuel, comparable-
store sales declined 0.2%, while identical-store sales were down 0.8%.
With the lingering effects of the strike gradually abating, total sales have improved in the
first quarter of 2005. We are encouraged by this positive trend and expect it to continue as the
year progresses.
Gross Profit
Gross profit in 2004 declined 44 basis points to 29.58% of sales. The reduction was due primarily
to increased fuel sales (which have a lower gross margin) and the estimated impact of the strike.
Operating and Administrative Expense
Operating and administrative expense last year decreased 7 basis points to 26.30% of sales.
The slight improvement was due to lower impairment charges and higher fuel sales, partly
offset by the impact of the strike and higher wages, benefits and occupancy expenses.
2 S A F E WAY I N C . 2 0 0 4 A N N U A L R E P O R T
5. We continued to make substantial progress renegotiating labor contracts under favorable
terms. As of this writing, we have restructured collective bargaining agreements in all but two
of our retail divisions, where contracts have expired and we are currently negotiating new
ones. The modified agreements have begun to arrest the rapid increase in employee health care
premiums and, over time, are expected to reduce the gap in our total labor costs versus those
of our non-union competitors.
Interest Expense
Interest expense declined $31.2 million to $411.2 million in 2004, primarily because strong cash
flow from operations enabled us to reduce debt by $1.1 billion to $6.7 billion.
Capital Spending
Cash capital expenditures increased to $1.2 billion in 2004. During the year we opened 33 new
stores, all designed to our new Lifestyle format featured later in this report. We also expanded
or remodeled 115 existing stores – 94 of which were refurbished to Lifestyle standards – and
we closed 48 older stores.
In 2005, we plan to invest approximately $1.4 billion in cash capital expenditures and open
30 to 35 new Lifestyle stores while completing some 275 to 285 Lifestyle remodels. By the end
of this year, we plan to operate approximately 450 Lifestyle stores, more than three times the
current total.
We also opened 41 fuel centers adjacent to our stores. As of year-end 2004, 311 of our
stores sold gasoline, boosting sales at these locations while enhancing one-stop shopping
convenience for our customers.
Cash Flow
Net cash flow from operating activities in 2004 rose $617 million to $2.2 billion, while net cash
flow from investing activities, which consists principally of cash paid for property additions,
increased $275 million to approximately $1.1 billion. Net cash flow used by financing activities
– mainly cash used to retire debt – was also up significantly, to approximately $1.1 billion in
2004 from $724 million the prior year. As noted above, total debt declined to $6.7 billion at
year-end 2004 from $7.8 billion at year-end 2003.
Community Involvement
Each year we make cash and in-kind donations to hundreds of non-profit organizations
throughout the communities we serve. Many of these contributions are channeled through
The Safeway Foundation, which is sustained by fundraising events and an annual employee-
giving campaign.
During 2004 in our U.S. retail operations alone, we donated more than $100 million
worth of merchandise to Second Harvest food banks and other hunger-relief organizations.
We also contributed more than $20 million to local schools through eScrip and other
educational programs. In addition, we conducted major fundraising campaigns to support
awareness, research and treatment programs for breast and prostate cancer as well as
muscular dystrophy.
Although we generally limit our charitable giving to worthy causes within our operating
areas, we made an exception for victims of the devastating tsunami in South Asia and
Eastern Africa, raising more than $3.5 million to support relief efforts on their behalf earlier
in 2005.
S A F E WAY I N C . 2 0 0 4 A N N U A L R E P O R T 3
6. Outlook
This is an exciting time to be at Safeway, as we fundamentally reinvent our business and the
way we go to market. We continue to make excellent progress in establishing and communi-
cating clear, compelling points of difference between our offerings and those of our competitors.
At the same time, through an innovative new advertising campaign, we will be connecting
with consumers – current customers and potential new ones – in ways that we believe will
position Safeway as a uniquely responsive, more complete store. As noted on the following
pages, life is changing, and so are we.
In closing, once again I’d like to acknowledge our employees for their tireless efforts.
As we strive to establish a sustained competitive advantage in a challenging business
environment, I’m reminded that “a company is only as good as its employees allow it to be.”
We’re fortunate to have some of the best trained, most knowledgeable workers in the
supermarket industry. We think they’re the friendliest, most helpful employees in the business
as well, a sentiment echoed by many of our customers. We have a winning team whose
players thrive on challenges and take pride in outperforming the competition while enhancing
customer satisfaction.
Based on our recent, positive sales trends, we are encouraged that our strategy is working
and are convinced that Safeway is headed in the right direction for future growth. We are
determined to deliver shareholder value.
Steven A. Burd
Chairman, President and Chief Executive Officer
March 15, 2005
1
Reconciliation of GAAP Net Income
(Loss) to Adjusted Income (Unaudited)
(Dollars in millions, except per-share amounts)
2004 2003
Amount Per Diluted Amount Per Diluted
Share Share
Net income, as reported $560.2 $1.25 Net loss, as reported $(169.8) $(0.38)
Estimated strike impact 102.9 0.23
Dominick’s store closures 28.5 0.06
Dominick’s impairment charges:
Estimated strike impact 254.0 0.57
Goodwill 275.9 0.62
Health and welfare contribution 19.1 0.04
Assets 190.9 0.43
Accrual for rent holidays 6.5 0.01
Randall’s impairment charges 447.7 1.00
Adjusted income $868.3 $1.93 Miscellaneous investments
write-off 6.5 0.01
Inventory loss accrual 43.5 0.10
Restructuring and other expenses 15.6 0.04
Adjusted income $ 913.2 $ 2.05
4 S A F E WAY I N C . 2 0 0 4 A N N U A L R E P O R T
7. Life is changing. So are we.
S A F E WAY I N C . 2 0 0 4 A N N U A L R E P O R T 5
8. T o d a y ’s c o n s u m e r s e x p e c t
Consumers today are busier and more diverse than ever before. They’re also more selective and have
an unprecedented range of options when choosing where they shop for food. Increasing time constraints
and shifting demographic trends – such as greater ethnicity, changing household composition and growing
affluence – have accelerated the profusion of new retail formats, each trying to satisfy today’s consumers’
varied needs and desires.
9. more from a food store.
When seeking a food store, consumers look for one that recognizes they live and eat differently today.
More shoppers are demanding meal solutions customized to their lifestyles. At the same time, shopping
for food has become a continuous series of trade-offs. Despite relentless time pressure, consumers are
increasingly willing to swap convenience for more interesting, relevant shopping experiences – experiences
that feed both needs and passions.
SAFEWAY INC. 2004 ANNUAL REPORT 7
10. Safeway is redefining the
Because life has changed, we’re changing, too. We are fundamentally reinventing our business,
establishing a solid framework to provide consistently high-quality food that fits consumers’ changing
lifestyles. Every day, in every department of every store, we strive to establish clear, compelling points
of difference in our offerings so we will be demonstrably superior to our competitors and can provide an
exceptionally satisfying shopping experience for our customers. This is particularly evident in the quality
and presentation of our perishables and the level of customer service we deliver.
QUALITY PRODUCE
We have dramatically improved the quality and presentation of our fresh fruits of them unique items grown especially for us. For consumers seeking
and vegetables. To differentiate our produce from our competitors’, we specify organically grown fruits and vegetables, we have expanded our assortment
higher quality grades and select from the best, sweetest crops available, some of top-quality, 100% Certified Organics to more than 80 items.
8 SAFEWAY INC. 2004 ANNUAL REPORT
11. food shopping experience.
Nowhere is the transformation and revitalization of Safeway more apparent than in our spectacular
new Lifestyle stores. These stores highlight our passion for superb fresh foods and innovative, consumer-
focused initiatives such as restaurant-quality meal solutions and organic produce. We have designed and
merchandised our Lifestyle stores to reflect the way today’s consumers shop. Our ultimate objective with
this exciting new format is to make Safeway a complete food store, a one-of-kind store that offers shoppers
an unparalleled array of uniquely responsive solutions and experiences, now and in the future.
S A F E WA Y I N C . 2 0 0 4 A N N U A L R E P O R T 9
12. Key Marketing Initiatives
R a n c h e r ’s R e s e r v e B e e f
Safeway’s exclusive line of Rancher’s Reserve beef is naturally aged to ensure exceptional taste and tender-
ness. Our beef experts carefully select and trim every cut of Rancher’s Reserve by hand. The result is beef
that’s guaranteed to please or we offer another cut and a full refund. We cut our
customers’ meat purchases any way they like them and gladly offer cooking tips and
recommendations. We even season or marinade their purchases at no extra charge.
10 SAFEWAY INC. 2004 ANNUAL REPORT
13. Specialty Foods to Go
We’re working hard to make our prepared meals program the finest of its kind. Our extensive at your table
menu features fresh sushi, Milena’s pizzeria-style pizzas, gourmet specialties such as teriyaki salmon and
grilled rosemary chicken, and “comfort food” like traditional meatloaf. Busy shoppers
can also select numerous ready-to-go offerings from our Signature line of premium
sandwiches, soups and salads.
11 SAFEWAY INC. 2004 ANNUAL REPORT
14. SIGNATURE SANDWICHES
We prepare an extensive array of
Signature Sandwiches created with the
finest Old World-style Primo Taglio meats
and cheeses, piled high between slices of
fresh-from-the-oven Safeway SELECT
Artisan breads. This popular, expanding
line also includes low-carb wraps.
SIGNATURE PANINI SANDWICHES
A popular new “grab ‘n go” offering at
Safeway is classic Italian panini. Shoppers
can choose from delicious grilled sandwiches
like Pastrami and Swiss or the Breakfast
Panini. All are served fresh and hot off
the grill.
SIGNATURE SOUPS
One of our most successful initiatives in 2004
was the launch of our restaurant-quality line
of Signature Soups. We offer them warm and
ready to eat from specially-designed hot soup
carts or pre-packaged to heat and serve later
at home. Shoppers can select from several
gourmet varieties such as Tuscan Tomato,
Fajita Chicken & Toasted Corn Chowder, and
Cravin’ Crab & Sweet Corn. All are made
with the finest, freshest ingredients.
In addition, our Lifestyle stores serve take-home family favorites cut to order at our carving station. Daily evening specials
include roast turkey, pork tenderloin, prime rib and other classics served with popular side dishes.
SAFEWAY INC. 2004 ANNUAL REPORT 12
15. New Lifestyle Stores
Our new Lifestyle concept stores have been dramatically redesigned to showcase our commitment to
quality, particularly in the perishable departments. Earth-toned décor, subdued lighting, custom flooring,
unique display fixtures and other special features impart a warm ambiance that we believe significantly
enhances the shopping experience. As of year-end 2004, we had built 34 new stores of this design and
remodeled 108 existing stores to the same standards. Sales at these stores have been strong, reflecting
positive customer response to the new format.
SAFEWAY INC. 2004 ANNUAL REPORT 13
16. Financial Contents
S A F E WAY I N C . A N D S U B S I D I A R I E S
15 Company in Review
18 Five-Year Summary Financial Information
20 Financial Review
29 Consolidated Statements of Operations
30 Consolidated Balance Sheets
32 Consolidated Statements of Cash Flows
34 Consolidated Statements of Stockholders’ Equity
35 Notes to Consolidated Financial Statements
53 Management’s Annual Report on
Internal Controls over Financial Reporting
54 Independent Auditors’ Reports
56 Directors and Principal Officers
57 Investor Information
1 4 S A F E WAY I N C . 2 0 0 4 A N N U A L R E P O R T
17. Company in Review
S A F E WAY I N C . A N D S U B S I D I A R I E S
Safeway Inc. (“Safeway” or the “Company”) is one of the The following table summarizes Safeway’s stores by size
largest food and drug retailers in North America, with 1,802 at year-end 2004:
Number Percent
stores at year-end 2004. Square Footage of Stores of Total
The Company’s U.S. retail operations are located Less than 30,000 275 15%
principally in California, Oregon, Washington, Alaska, 30,000 to 50,000 767 43
More than 50,000 760 42
Colorado, Arizona, Texas, the Chicago metropolitan area and
Total stores 1,802 100%
the Mid-Atlantic region. The Company’s Canadian retail
operations are located principally in British Columbia,
At year-end 2004, Safeway owned
STORE OWNERSHIP
Alberta and Manitoba/Saskatchewan. In support of its retail
approximately one-third of its stores and leased its
operations, the Company has an extensive network of distri-
remaining stores.The Company prefers ownership because it
bution, manufacturing and food processing facilities.
provides control and flexibility with respect to financing
Safeway also has a 49% interest in Casa Ley, S.A. de
terms, remodeling, expansions and closures.
C.V. (“Casa Ley”) which operates 115 food and general
merchandise stores in Western Mexico. In addition, the
Safeway’s operating strategy is to
MERCHANDISING
Company has a strategic alliance with and a 54%
provide value to its customers by maintaining high store
ownership interest in GroceryWorks Holdings, Inc., an
standards and a wide selection of high quality products at
Internet grocer.
competitive prices. To provide one-stop shopping for today’s
busy shoppers, the Company emphasizes high quality
Safeway’s average store size is approximately
STORES
produce and meat, and offers many specialty items through
45,000 square feet. The Company determines the size of a
its various specialty departments.
new store based on a number of considerations, including
Safeway is focused on differentiating its offering with
the needs of the community the store serves, the location
high quality perishables. The Company is developing a
and site plan, and the estimated return on capital invested.
reputation for having the absolute best produce in the
Safeway’s primary new store prototype, called the “Lifestyle
market and the most tender and flavorful meat, through the
Store,” is 55,000 square feet. Lifestyle stores feature a
Company’s Rancher’s Reserve Tender Beef offering. In
warm and inviting décor, with special lighting to highlight
addition, Safeway has developed a variety of new items in
products and departments.
the deli/food service department, including Signature
Safeway’s stores provide a full array of dry grocery items
sandwiches, soups and salads that provide meal solutions
tailored to local preferences. Most stores offer a wide
to today’s busy shoppers.
selection of food and general merchandise and feature a
To showcase its commitment to quality, particularly in
variety of specialty departments such as bakery,
the perishable departments, Safeway has developed a store
delicatessen, floral and pharmacy. In addition, many stores
prototype called the “Lifestyle Store.” The Lifestyle store
now offer Starbucks coffee shops and adjacent fuel centers.
has an earth-toned décor package, subdued lighting, custom
Safeway continues to operate a number of smaller stores
flooring, unique display fixtures and other special features
that also offer an extensive selection of food and general
that impart a warm ambience that the Company believes
merchandise, and generally include one or more specialty
significantly enhances the shopping experience.
departments. These stores remain an important part of the
Company’s store network in smaller communities and
certain other locations where larger stores may not be
feasible because of space limitations and/or community
needs or restrictions.
S A F E WAY I N C . 2 0 0 4 A N N U A L R E P O R T 1 5
18. S A F E WAY I N C . A N D S U B S I D I A R I E S
Safeway has developed a line of some 1,300 premium Safeway operated the following manufacturing and
corporate brand products since 1993 under the “Safeway processing facilities at year-end 2004:
SELECT” banner. The award-winning Safeway SELECT line is
U.S. Canada
designed to offer premium quality products that the Company
Milk plants 6 3
believes are equal or superior in quality to comparable best-
Bread baking plants 5 2
selling nationally advertised brands, or are unique to the Ice cream plants 2 2
Cheese and meat packaging plants – 2
category and not available from national brand manufacturers.
Soft drink bottling plants 4 –
The Safeway SELECT line of products includes Fruit and vegetable processing plants 1 3
Other food processing plants 2 –
carbonated soft drinks; unique salsas; bagged salads; whole
Pet food plant 1 –
bean coffees; the Indulgence line of cookies and other
Total 21 12
sweets; the Verdi line of frozen pizzas, fresh and frozen
pastas, pasta sauces and olive oils; Milena’s take & bake
In addition, the Company operates laboratory facilities
pizzas; the Primo Taglio line of meats, cheeses and
for quality assurance and research and development in
sandwiches; Signature soups, sandwiches and salads;
certain of its plants and at its corporate offices.
Artisan fresh-baked breads; NutraBalance pet food; and
Ultra laundry detergents and dish soaps. The Safeway
Each of Safeway’s 12 retail operating
DISTRIBUTION
SELECT line also includes an extensive array of ice creams,
areas is served by a regional distribution center consisting
frozen yogurts and sorbets; Healthy Advantage items such
of one or more facilities. Safeway has 17 distribution/
as low-fat ice creams, cereals and low-fat cereal bars; and
warehousing centers (13 in the United States and four in
Gourmet Club frozen entrees and hors d’oeuvres.
Canada), which collectively provide the majority of all
products to Safeway stores. The Company’s distribution
The principal
M A N U FA C T U R I N G A N D W H O L E S A L E
centers in Maryland, Alberta and British Columbia are
function of manufacturing operations is to purchase,
operated by third parties.
manufacture and process private label merchandise sold in
stores operated by the Company. As measured by sales
A key component of
C A P I TA L E X P E N D I T U R E P R O G R A M
dollars, approximately 24% of Safeway’s private label
the Company’s long-term strategy is its capital expenditure
merchandise is manufactured in Company-owned plants,
program. The Company’s capital expenditure program funds,
and the remainder is purchased from third parties.
among other things, new stores, remodels, manufacturing
Safeway’s Canadian subsidiary has a wholesale
plants, distribution facilities and information technology
operation that distributes both national brands and private
advances. Over the last several years, Safeway
label products to independent grocery stores and institu-
management has continued to strengthen its program to
tional customers.
select and approve new capital investments.
1 6 S A F E WAY I N C . 2 0 0 4 A N N U A L R E P O R T
19. S A F E WAY I N C . A N D S U B S I D I A R I E S
The table below presents the Company’s cash capital 30 to 35 new Lifestyle stores while completing some 275 to
expenditures and details changes in the Company’s store 285 Lifestyle remodels. By the end of 2005, Safeway plans
base over the last three years: to operate approximately 450 Lifestyle stores, more than
three times the current total.
(Dollars in millions) 2004 2003 2002
Cash capital expenditures $1,212.5 $935.8 $1,467.4
MARKET RISK FROM FINANCIAL INSTRUMENTS
Cash capital expenditures
Safeway manages interest rate risk through the strategic
as a percentage of sales
and other revenue 3.4% 2.6% 4.2% use of fixed and variable interest rate debt and, from time
Stores opened 33 40 75
to time, interest rate swaps. As of year-end 2004, the
Stores closed 48 31 40
Remodels (Note 1) 115 75 203 Company effectively converted $500 million of its 4.95%
Total retail square footage
fixed-rate debt and $300 million of its 4.125% fixed-rate
at year end (in millions) 82.1 82.6 81.5
debt to floating rate debt through interest rate swap
Number of fuel stations
at year end 311 270 214
agreements.
The Company does not utilize financial instruments
Note 1: Defined as store remodel projects (other than maintenance) generally requiring
expenditures in excess of $200,000.
for trading or other speculative purposes, nor does it
utilize leveraged financial instruments. The Company
During 2004, Safeway invested $1.2 billion in cash
does not consider the potential declines in future earnings,
capital expenditures. The Company opened 33 new Lifestyle
fair values and cash flows from reasonably possible
stores, remodeled 115 existing stores – 94 of them were
near-term changes in interest rates and exchange rates to
refurbished to Lifestyle standards – and closed 48 stores. In
be material.
2005, the Company expects to spend approximately $1.4
billion in cash capital expenditures and open approximately
The table below presents principal amounts and related weighted average rates by year of maturity for the Company’s debt
obligations at year-end 2004 (dollars in millions):
2005 2006 2007 2008 2009 Thereafter Total Fair Value
Commercial paper:
Principal – $ 105.0 – – – – $ 105.0 $ 105.0
Weighted average interest rate – 2.28% – – – – 2.28%
Long-term debt:(1)
Principal $ 596.9 $ 713.7 $ 785.2 $ 553.7 $ 502.2 $2,809.9 $5,961.6 $6,313.5
Weighted average interest rate 3.10% 6.13% 5.79% 5.21% 7.50% 6.16% 5.83%
(1) Primarily fixed-rate debt
S A F E WAY I N C . 2 0 0 4 A N N U A L R E P O R T 1 7
20. F i v e - Ye a r S u m m a r y F i n a n c i a l I n f o r m a t i o n
S A F E WAY I N C . A N D S U B S I D I A R I E S
52 Weeks 53 Weeks 52 Weeks 52 Weeks 52 Weeks
(Dollars in millions, except per-share amounts) 2004 2003 2002 2001 2000
R e s u l t s o f O p e r a t i o n s (Note 1)
Sales and other revenue $35,822.9 $35,727.2 $ 34,917.2 $34,434.5 $32,103.3
Gross profit 10,595.3 10,724.2 10,996.4 10,776.6 9,666.1
Operating and administrative expense (9,422.5) (9,421.2) (8,760.8) (8,047.4) (7,258.2)
Goodwill impairment charges – (729.1) (1,288.0) – –
Goodwill amortization – – – (140.4) (126.2)
Operating profit 1,172.8 573.9 947.6 2,588.8 2,281.7
Interest expense (411.2) (442.4) (430.8) (446.9) (457.2)
Other income (expense), net 32.3 9.6 15.5 (46.9) 42.0
Income before income taxes and cumulative
effect of accounting change 793.9 141.1 532.3 2,095.0 1,866.5
Income taxes (233.7) (310.9) (660.4) (841.1) (774.6)
Income (loss) before cumulative effect
of accounting change 560.2 (169.8) (128.1) 1,253.9 1,091.9
Cumulative effect of accounting change – – (700.0) – –
Net income (loss) $ 560.2 $ (169.8) $ (828.1) $ 1,253.9 $ 1,091.9
Basic earnings (loss) per share:
Income (loss) before cumulative effect
of accounting change $ 1.26 $ (0.38) $ (0.27) $ 2.49 $ 2.19
Cumulative effect of accounting change – – (1.50) – –
Net income (loss) $ 1.26 $ (0.38) $ (1.77) $ 2.49 $ 2.19
Diluted earnings (loss) per share:
Income (loss) before cumulative effect
of accounting change $ 1.25 $ (0.38) $ (0.27) $ 2.44 $ 2.13
Cumulative effect of accounting change – – (1.50) – –
Net income (loss) $ 1.25 $ (0.38) $ (1.77) $ 2.44 $ 2.13
1 8 S A F E WAY I N C . 2 0 0 4 A N N U A L R E P O R T
21. F i v e - Ye a r S u m m a r y F i n a n c i a l I n f o r m a t i o n
S A F E WAY I N C . A N D S U B S I D I A R I E S
52 Weeks 53 Weeks 52 Weeks 52 Weeks 52 Weeks
(Dollars in millions, except per-share amounts) 2004 2003 2002 2001 2000
F i n a n c i a l S t a t i s t i c s (Note 1)
Comparable-store sales increases (decreases) (Note 2) 0.9% (2.4%) (0.7%) 2.3% 2.8%
Identical-store sales increases (decreases) (Note 2) 0.3% (2.8%) (1.7%) 1.6% 2.2%
Gross profit margin 29.58% 30.02% 31.49% 31.30% 30.11%
Operating and administrative expense
as a percentage of sales (Note 3) 26.30% 26.37% 25.09% 23.37% 22.61%
Operating profit as a percentage of sales 3.3% 1.6% 2.7% 7.5% 7.1%
Cash capital expenditures $ 1,212.5 $ 935.8 $ 1,467.4 $ 1,793.0 $ 1,572.5
Depreciation and amortization 894.6 863.6 888.3 797.3 704.5
Total assets 15,377.4 15,096.7 16,047.2 17,462.6 15,965.2
Total debt 6,763.4 7,822.3 8,435.6 7,399.8 6,495.9
Total stockholders’ equity 4,306.9 3,644.3 3,627.5 5,889.6 5,389.8
Weighted average shares outstanding –
basic (in millions) 445.6 441.9 467.3 503.3 497.9
Weighted average shares outstanding –
diluted (in millions) 449.1 441.9 467.3 513.2 511.6
Other Statistics
Genuardi’s stores acquired during the year – – – 39 –
Stores opened during the year 33 40 75 95 75
Stores closed during the year 48 31 40 49 46
Total stores at year-end 1,802 1,817 1,808 1,773 1,688
Remodels completed during the year (Note 4) 115 75 203 255 275
Total retail square footage at year-end (in millions) 82.1 82.6 81.5 78.8 73.6
Note 1. The Company has classified certain minor revenue items as other revenues in 2004. These items had historically been classified as a reduction of costs and expenses. These
items, and their effect on same-store sales, have been reclassified for prior periods to conform to the 2004 presentation. See page 22.
Note 2. Defined as stores operating the same period in both the current year and the previous year. Comparable stores include replacement stores while identical stores do not.
2004 sales increase includes the estimated 60-basis-point impact of Southern California strike. 2003 sales decrease includes the estimated 240-basis-point impact of
Southern California strike. 2001 and 2000 sales increases include the estimated 50-basis-point impact of the 2000 Northern California distribution center strike.
Note 3. Management believes this ratio is relevant because it assists investors in evaluating Safeway’s ability to control costs.
Note 4. Defined as store remodel projects (other than maintenance) generally requiring expenditures in excess of $200,000.
S A F E WAY I N C . 2 0 0 4 A N N U A L R E P O R T 1 9
22. Financial Review
S A F E WAY I N C . A N D S U B S I D I A R I E S
Results of Operations of 2002, Safeway performed its annual review of goodwill
Safeway reported net income of $560.2 million ($1.25 per and recorded a pre-tax impairment charge of $583.8 million
diluted share) in 2004, a net loss of $169.8 million ($0.38 for Dominick’s.
per diluted share) in 2003 and a net loss of $828.1 million In the first 36 weeks of 2003, Safeway reduced the
($1.77 per diluted share) in 2002. These results were signifi- carrying value of Dominick’s by writing down an additional
cantly affected by a strike in Southern California, goodwill $256.5 million of goodwill and $120.7 million of long-lived
and asset impairments at Dominick’s and Randall’s and assets, based on indications of value received during the
other unusual charges described below. sale process. In November 2003, Safeway announced that it
was taking Dominick’s off the market after the winning
On October 11, 2003, seven UFCW local bidder and the unions representing Dominick’s could not
S T R I K E I M PA C T
unions struck the Company’s 289 stores in Southern reach an agreement on a labor contract. Safeway reclas-
California. As a result, pursuant to the terms of a multi- sified Dominick’s from an “asset held for sale” to “assets
employer bargaining arrangement, Kroger and Albertson’s held and used” and adjusted Dominick’s individual long-
locked out certain of their retail union employees in lived assets to the lower of cost or fair value. As a result, in
Southern California food stores. An agreement ending the the fourth quarter of 2003 Safeway incurred a pre-tax, long-
strike was ratified by the unions on February 28, 2004. lived asset impairment charge of $190.7 million and a
Employees returned to work beginning March 5, 2004. goodwill impairment charge of $24.9 million. As of year-end
Safeway estimates the overall cost of the strike and its 2003, there is no goodwill remaining on Safeway’s consol-
residual effects reduced 2004 earnings by $412.2 million idated balance sheet related to Dominick’s.
before taxes ($0.57 per diluted share) and 2003 earnings by In the first quarter of 2004, Safeway closed 12 under-
$167.5 million before taxes ($0.23 per diluted share). performing Dominick’s stores which resulted in a store-
Safeway estimated the impact of the strike by comparing lease exit charge of $45.7 million.
internal forecasts immediately before the strike with actual Pre-tax long-lived asset and goodwill impairment at
results during and after the strike, at strike-affected stores. Dominick’s are summarized below (in millions):
The estimate also includes the Company’s benefit under an
2004 2003 2002
agreement with Kroger and Albertson’s that arises out of
Cumulative effect of adopting
the multi-employer bargaining process in Southern California.
SFAS No. 142 (goodwill
impairment) – – $589.0
Goodwill impairment – $281.4 583.8
D O M I N I C K ’ S In the first quarter of 2002, Safeway adopted
Impairment of long-lived assets
Statement of Financial Accounting Standards (“SFAS”) No. (included in operating and
administrative expense) – 311.4 201.3
142, “Goodwill and Other Intangible Assets,” and recorded
Store lease exit costs
a pre-tax goodwill impairment charge of $589.0 million at (included in operating and
Dominick’s. In November 2002, Safeway announced the administrative expense) $45.7 – –
decision to sell Dominick’s and exit the Chicago market due
Dominick’s incurred operating losses and declining sales
to labor issues. In accordance with SFAS No. 144,
in each of the last three fiscal years and faces substantial
“Accounting for the Impairment or Disposal of Long-Lived
hurdles to achieving satisfactory operating profit in the
Assets,” Safeway recorded a pre-tax charge for the
future. These hurdles include a highly competitive market
impairment of long-lived assets of $201.3 million in the
and an unfavorable labor contract. Dominick’s is operating
fourth quarter of 2002 to adjust Dominick’s to its estimated
under a labor contract that expired in 2003 and is currently
fair market value less cost to sell. Also in the fourth quarter
negotiating a new labor contract. A more competitive labor
contract is vital to Dominick’s future viability. Safeway
believes a satisfactory contract can be negotiated.
2 0 S A F E WAY I N C . 2 0 0 4 A N N U A L R E P O R T
23. S A F E WAY I N C . A N D S U B S I D I A R I E S
In the first quarter of 2002, Safeway recorded In 2004, Safeway was notified that it was required to
R A N D A L L’ S
a pre-tax goodwill impairment charge of $111.0 million at contribute an additional $31.1 million before tax ($0.04 per
Randall’s when it adopted SFAS No. 142. During the fourth diluted share) during the year to two Northern California
quarter of 2002, Safeway performed its annual review of multi-employer health and welfare plans for its share of
goodwill and recorded a pre-tax impairment charge at funding deficits.
Randall’s of $704.2 million. In the fourth quarter of 2003, Safeway incurred a lease expense adjustment of $10.6
Safeway again performed its annual review of goodwill and million before tax ($0.01 per diluted share) in 2004 related
wrote off the remaining $447.7 million of goodwill at to rent holidays. This adjustment conformed the Company’s
Randall’s. Pre-tax goodwill impairment charges at Randall’s lease accounting policies to views expressed by the Office
are summarized below (in millions): of the Chief Accountant of the SEC on February 7, 2005.
In 2003, Safeway changed its accounting policy to
2003 2002
accrue estimated physical inventory losses for the period
Cumulative effect of adopting SFAS
between the last physical inventory count and the balance
No. 142 (goodwill impairment) – $111.0
sheet date. Safeway also made a change to its physical
Goodwill impairment $447.7 704.2
inventory loss calculation methodology to reflect more
precise data from new financial software implemented in
Randall’s has incurred operating losses and declining
2003. The effect of these changes was recorded in 2003.
sales in each of the last two years due primarily to over-
However, most of the adjustment was accumulated over
storing in Texas. Historically, other markets which were
many prior years. These charges reduced earnings by $71.0
over-stored eventually self-corrected through population
million before tax ($0.10 per diluted share).
growth or as operators left the market. There can be no
Safeway wrote off miscellaneous equity investments in
assurance that the Texas market will experience such a
2003 totaling $10.6 million ($0.01 per diluted share), after
correction, and operating conditions in Texas are expected
determining they were impaired. Safeway also incurred pre-
to remain extremely competitive in 2005.
tax charges totaling $25.5 million ($0.04 per diluted share)
for employee buyouts, severance costs and other related
O T H E R C H A R G E S Other significant pre-tax charges (credits)
costs related to the restructuring of the Company’s adminis-
consist of the following (in millions):
trative offices.
2004 2003 2002
In 2002, Safeway received $32.7 million ($0.04 per
Northern California health
diluted share) from a bank for the termination of an in-store
and welfare contribution $31.1 – –
banking agreement with Safeway.
Accrual for rent holidays 10.6 – –
Inventory loss accrual – $71.0 – In 1987, Safeway assigned a number of leases to Furr’s
Impairment of miscellaneous
Inc. (“Furr’s”) and Homeland Stores, Inc. (“Homeland”) as
equity investments – 10.6 –
Employee buyouts, severance part of the sale of the Company’s former El Paso, Texas and
costs and other related costs – 25.5 –
Oklahoma City, Oklahoma divisions. Safeway is contingently
Termination of in-store banking
liable if Furr’s and Homeland are unable to continue making
agreement – – $(32.7)
Lease liability credits related
rental payments on these leases. In 2001, Furr’s and
to Furr’s and Homeland
Homeland declared bankruptcy and Safeway recorded a pre-
bankruptcies – – (12.1)
tax charge to earnings of $42.7 million ($0.05 per diluted
share) to recognize the estimated lease liabilities
associated with these bankruptcies and for a single lease
S A F E WAY I N C . 2 0 0 4 A N N U A L R E P O R T 2 1
24. S A F E WAY I N C . A N D S U B S I D I A R I E S
from Safeway’s former Florida division. In 2002, Furr’s and
Portions of 2004 Sales Dollar
Homeland emerged from bankruptcy and, based on the
resolution of various leases, Safeway reversed $12.1 million
of this accrual.
s Cost of Goods Sold: 70.4%
s Operating & Administrative Expense: 26.3%
Total sales increased only slightly to $35.8 billion in
SALES s Operating Profit: 3.3%
2004 from $35.7 billion in 2003, primarily because of the
strike and because fiscal 2004 had one fewer week than
fiscal 2003.
Historically, Safeway has classified certain minor revenue
Same-store sales increases (decreases) for 2004 were
items such as partner gift card and vending machine income
as follows:
as a reduction of costs and expenses. As the value of these
items has grown, the Company has determined that they are Comparable-Store Identical-Store
Sales (includes Sales (excludes
more appropriately classified as other revenue in 2004. replacement stores) replacement stores)
These items have been reclassified for prior periods to Including Fuel:
conform to the 2004 presentation. These reclassifications Excluding strike-affected stores 1.5% 0.9%
Including strike-affected stores 0.9% 0.3%
had no effect on previously reported operating profit or net
income (loss) and are summarized below (in millions): Excluding Fuel:
Excluding strike-affected stores (0.2%) (0.8%)
Including strike-affected stores (0.7%) (1.3%)
2004 2003 2002
Sales, before reclassifications $ 35,621.9 $ 35,552.7 $ 34,767.5
Reclassifications 201.0 174.5 149.7 In 2003, total sales increased 2.3% to $35.7 billion from
Sales and other revenue, $34.9 billion in 2002 due primarily to the additional week in
as adjusted $ 35,822.9 $ 35,727.2 $ 34,917.2
2003, new store openings and additional fuel sales, partially
offset by the estimated impact of the strike in Southern
Cost of goods sold, before
reclassifications $(25,230.0) $(25,018.9) $(23,955.5) California. Excluding the estimated effects of the strike in
Reclassifications 2.4 15.9 34.7
Southern California, comparable-store sales were flat, while
Cost of good sold, as adjusted $(25,227.6) $(25,003.0) $(23,920.8)
identical-store sales declined 0.4%. Further excluding the
effects of fuel sales, 2003 comparable-store sales
Gross profit, before
reclassifications $ 10,391.9 $ 10,533.8 $ 10,812.0
decreased 1.6% and identical-store sales decreased 2.0%.
Reclassifications 203.4 190.4 184.4
In 2002, comparable-store sales decreased by 0.7%,
Gross profit, as adjusted $ 10,595.3 $ 10,724.2 $ 10,996.4
while identical-store sales declined 1.7%. Excluding the
Operating and administrative effects of fuel sales, 2002 comparable-store sales decreased
expense, before
1.3% and identical-store sales decreased 2.2%. Sales in
reclassifications $ (9,219.1) $ (9,230.8) $ (8,576.4)
2002 were impacted by continued softness in the economy,
Reclassifications (203.4) (190.4) (184.4)
Operating and administrative an increase in competitive activity, an overly aggressive
expense, as adjusted $ (9,422.5) $ (9,421.2) $ (8,760.8)
shrink-reduction effort and disruptions associated with the
centralization of buying and merchandising.
These reclassifications did not change previously
reported comparable-store sales or identical-store sales by
more than 10 basis points in either 2004, 2003 or 2002.
2 2 S A F E WAY I N C . 2 0 0 4 A N N U A L R E P O R T
25. S A F E WAY I N C . A N D S U B S I D I A R I E S
G R O S S P R O F I T Gross profit represents the portion of sales Promotional allowances make up nearly three-quarters of
revenue remaining after deducting the costs of goods sold all allowances. With promotional allowances, vendors pay
during the period, including purchase and distribution costs. Safeway to promote their product. The promotion may be
These costs include inbound freight charges, purchasing and any combination of a temporary price reduction, a feature in
receiving costs, warehouse inspection costs, warehousing print ads, a feature in a Safeway circular, or a preferred
costs, and other costs of Safeway’s distribution network. location in the store. The promotions are typically one to
Advertising and promotional expenses are also a component two weeks long.
of cost of goods sold. Slotting allowances are a small portion of total
Gross profit margin was 29.58% of sales in 2004, 30.02% allowances (typically less than 5% of all allowances). With
in 2003, and 31.49% in 2002. slotting allowances, the vendor reimburses Safeway for the
Gross profit declined 44 basis points in 2004. The strike cost of placing new product on the shelf. Safeway has no
in Southern California reduced gross profit by an estimated obligation or commitment to keep the product on the shelf
41 basis points, and higher fuel sales (which have a lower for a minimum period.
gross margin) reduced gross profit by 40 basis points. Gross Contract allowances make up the remainder of all
profit in 2003 was reduced by 20 basis points due to the allowances. Under the typical contract allowance, a vendor
$71.0 million charge to accrue estimated inventory losses. pays Safeway to keep product on the shelf for a minimum
The remaining 17-basis-point increase was primarily the period of time or when volume thresholds are achieved.
result of targeted pricing and promotion.
Gross profit declined 147 basis points in 2003. Higher Operating
O P E R AT I N G A N D A D M I N I S T R AT I V E E X P E N S E
fuel sales reduced gross profit by 38 basis points. The $71.0 and administrative expense consists primarily of store
million inventory loss accrual reduced gross profit 20 basis occupancy costs and backstage expenses, which, in turn,
points. The strike in Southern California reduced gross profit consist primarily of wages, employee benefits, rent,
by an estimated five basis points. The remaining 84-basis- depreciation and utilities.
point decline was primarily the result of targeted pricing Operating and administrative expense was 26.30% of
and promotion. sales in 2004 compared to 26.37% in 2003 and 25.09%
Gross profit improved 19 basis points to 31.49% in 2002 in 2002.
primarily due to shrink control, improved buying practices Operating and administrative expense decreased seven
and private-label growth. The increased gross margin dollars basis points in 2004. Lower impairment charges reduced
were largely reinvested in targeted pricing and promotion. operating and administrative expense as a percentage of
Vendor allowances totaled $2.2 billion in 2004, 2003 and sales by 77 basis points and higher fuel sales reduced
2002. Vendor allowances did not materially impact the operating and administrative expense by 39 basis points.
Company’s gross profit in 2004, 2003 and 2002 because These improvements were offset by a 22-basis-point increase
Safeway spends the allowances received on pricing from the strike in Southern California and 87 basis points due
promotions, advertising expenses and slotting expenses. to higher wages, benefits and occupancy expense.
Vendor allowances can be grouped into the following broad Operating and administrative expense increased 128
categories: promotional allowances, slotting allowances basis points in 2003. Higher Dominick’s impairment charges
and contract allowances. All vendor allowances are increased operating and administration expense 30 basis
classified as an element of cost of goods sold. points. Reduced sales from the Southern California strike
increased operating and administrative expense by an
estimated 29 basis points. Higher pension expense added
28 basis points, and higher workers’ compensation expense
S A F E WAY I N C . 2 0 0 4 A N N U A L R E P O R T 2 3
26. S A F E WAY I N C . A N D S U B S I D I A R I E S
Critical Accounting Policies
added 15 basis points. The remaining 26-basis-point
increase was primarily due to higher employee benefit Critical accounting policies are those accounting policies
costs, soft sales and settlement income from the that management believes are important to the portrayal of
termination of an in-store banking agreement recorded in Safeway’s financial condition and results and require
2002 operating and administrative expense. management’s most difficult, subjective or complex
Operating and administrative expense increased 172 judgments, often as a result of the need to make estimates
basis points in 2002. The Dominick’s impairment charge about the effect of matters that are inherently uncertain.
added 55 basis points. This increase was partially offset by
a decrease of approximately 9 basis points due to income The Company is primarily
W O R K E R S ’ C O M P E N S AT I O N
received from a bank for the termination of an in-store self-insured for workers’ compensation, automobile and
banking agreement with Safeway. The remaining 126-basis- general liability costs. It is the Company’s policy to record its
point increase was primarily due to higher employee benefit self-insurance liability, as determined actuarially, based on
costs, higher real estate occupancy costs, higher pension claims filed and an estimate of claims incurred but not yet
expense and soft sales. reported, discounted at a risk-free interest rate. Any actuarial
projection of losses concerning workers’ compensation and
Interest expense was $411.2 million general liability is subject to a high degree of variability.
INTEREST EXPENSE
in 2004, compared to $442.4 million in 2003, and $430.8 in Among the causes of this variability are unpredictable
2002. Interest expense decreased in 2004 primarily due to external factors affecting future inflation rates, discount
lower average borrowings in 2004 compared to 2003. rates, litigation trends, legal interpretations, benefit level
Interest expense increased in 2003 primarily due to higher changes and claim settlement patterns. An example of how
average borrowings in 2003 compared to 2002. Interest change in discount rates can affect Safeway’s reserve
expense declined in 2002 primarily due to lower interest occurred in 2004 when a 25-basis point increase in the
rates in 2002 compared to 2001. Company’s discount rate, based on changes in market rates,
reduced its liability by approximately $4.3 million.
O T H E R I N C O M E ( L O S S ) Other income consists of interest The majority of the Company’s workers’ compensation
income, minority interest in a consolidated affiliate and liability is from claims occurring in California. California
equity in earnings from Safeway’s unconsolidated affiliates. workers’ compensation has received intense scrutiny from
Interest income was $9.7 million in 2004, $5.4 million in the state’s politicians, insurers, employers and providers, as
2003 and $8.5 million in 2002. Equity in earnings (losses) of well as the public in general. Recent years have seen
unconsolidated affiliates was income of $12.6 million in escalation in the number of legislative reforms, judicial
2004, a loss of $ 7.1 million in 2003 and a loss of $0.2 rulings and social phenomena affecting this business. Some
million in 2002. Equity in losses of unconsolidated affiliates of the many sources of uncertainty in the Company’s reserve
in 2002 includes approximately $15.8 million in charges estimates include changes in benefit levels, medical fee
related to the resolution of physical inventory count discrep- schedules, medical utilization guidelines, vocation rehabili-
ancies at Casa Ley. tation and apportionment.
S T O R E C L O S U R E S It is the Company’s policy to recognize
losses relating to the impairment of long-lived assets when
expected net future cash flows are less than the assets’
carrying values. For closed stores that are under long-term
leases, the Company records a liability for the future
minimum lease payments and related ancillary costs from
2 4 S A F E WAY I N C . 2 0 0 4 A N N U A L R E P O R T
27. S A F E WAY I N C . A N D S U B S I D I A R I E S
the date of closure to the end of the remaining lease term, G O O D W I L L Safeway accounts for goodwill in accordance
net of estimated cost recoveries. In both cases, fair value is with SFAS No. 142, “Goodwill and Other Intangible Assets.”
determined by estimating net future cash flows and As required by SFAS No. 142, Safeway tests for goodwill
discounting them using a risk-adjusted rate of interest. annually using a two-step approach with extensive use of
The Company estimates future cash flows based on its accounting judgments and estimates of future operating
experience and knowledge of the market in which the results. Changes in estimates or application of alternative
closed store is located and, when necessary, uses real assumptions and definitions could produce significantly
estate brokers. However, these estimates project future different results. The factors that most significantly affect
cash flow several years into the future and are affected by the fair value calculation are market multiples and
variable factors such as inflation, real estate markets and estimates of future cash flows. Fair value is determined
economic conditions. by an independent third-party appraiser who primarily
used the discounted cash flow method and the guideline
E M P L O Y E E B E N E F I T P L A N S The determination of company method.
Safeway’s obligation and expense for pension and other post-
Liquidity and Financial Resources
retirement benefits is dependent, in part, on the Company’s
Net cash flow from operating activities was $2,226.4 million
selection of certain assumptions used by its actuaries in
in 2004, $1,609.6 million in 2003, and $2,034.7 million in
calculating these amounts. These assumptions are disclosed
2002. Net cash flow from operating activities increased in
in Note I to the consolidated financial statements and
2004 largely due to increased net income and changes in
include, among other things, the discount rate, the expected
working capital. Net cash flow from operating activities
long-term rate of return on plan assets and the rates of
decreased in 2003 and 2002 primarily due to lower operating
compensation and health care costs. In accordance with
results and changes in working capital.
generally accepted accounting principles, actual results that
Cash flow used by investing activities was $1,070.3
differ from the Company’s assumptions are accumulated and
million in 2004, $795.0 million in 2003 and $1,395.7 million
amortized over future periods and, therefore, affect its
in 2002. Cash flow used by investing activities increased
recognized expense and recorded obligation in such future
in 2004 compared to 2003 because of higher capital
periods. While Safeway believes its assumptions are
expenditures. Cash flow used by investing activities
appropriate, significant differences in Safeway’s actual
decreased in 2003 compared to 2002 because of reduced
experience or significant changes in the Company’s
capital expenditures in 2003. Cash flow used by investing
assumptions may materially affect Safeway’s pension and
activities declined in 2002 compared to 2001 primarily
other post-retirement obligations and its future expense.
because of cash used to acquire Genuardi’s in 2001, as well
When not considering other changes in assumptions or
as reduced capital expenditures.
actual return on plan assets, a 100-basis-point reduction in
Capital expenditures were gradually scaled back in 2003
the year-end 2004 discount rate alone would negatively
and 2002 as the economy softened. Capital expenditures
impact 2005 U.S. pension expense by approximately $28
increased in 2004 as the Company focused on remodeling
million, and a 50-basis-point reduction in expected return on
its existing stores under its new “Lifestyle Store” prototype.
plan assets alone would negatively impact 2005 U.S.
In 2004, Safeway opened 33 new stores and completed 115
pension expense by approximately $8 million.
remodels. In 2003, Safeway opened 40 new stores and
Not considering any changes in assumptions, a $100
remodeled 75 stores. In 2005, Safeway expects to spend
million reduction in plan assets in 2004 would impact 2005
approximately $1.4 billion in cash capital expenditures,
U.S. pension expense by approximately $18 million. The fair
open approximately 30 to 35 new stores and complete
value of plan assets can vary significantly from year to year.
approximately 275 to 285 remodels.
S A F E WAY I N C . 2 0 0 4 A N N U A L R E P O R T 2 5
28. S A F E WAY I N C . A N D S U B S I D I A R I E S
Based upon the current level of operations, Safeway should not be considered as an alternative to net income or
believes that net cash flow from operating activities and cash flows from operating activities (which are determined
other sources of liquidity, including borrowing under the in accordance with GAAP) and is not being presented as an
Company’s commercial paper program and bank credit indicator of operating performance or a measure of liquidity.
agreement, will be adequate to meet anticipated Other companies may define Adjusted EBITDA differently
requirements for working capital, capital expenditures, and, as a result, such measures may not be comparable to
interest payments and scheduled principal payments for the Safeway’s Adjusted EBITDA.
foreseeable future. There can be no assurance, however,
52 weeks
that Safeway’s business will continue to generate cash flow 2004
(Dollars in millions)
at or above current levels or that the Company will be able Adjusted EBITDA:
Net income $ 560.2
to maintain its ability to borrow under the commercial paper
Add (subtract):
program and bank credit agreement. Income taxes 233.7
LIFO income (15.2)
If the Company’s credit rating were to decline below its
Interest expense 411.2
current level of Baa2/BBB, the ability to borrow under the Depreciation and amortization 894.6
commercial paper program would be adversely affected. Equity in earnings of unconsolidated affiliates (12.6)
Total Adjusted EBITDA $2,071.9
Safeway’s ability to borrow under the bank credit agreement
Adjusted EBITDA as a multiple of interest expense 5.04x
is unaffected by Safeway’s credit rating. However, if
Total debt at year-end 2004 $6,763.4
Safeway’s 2004 Adjusted EBITDA to interest ratio of 5.04 to
Debt to Adjusted EBITDA 3.26x
1 were to decline to 2.0 to 1, or if Safeway’s year-end 2004
debt to Adjusted EBITDA ratio of 3.26 to 1 were to grow to
Total debt, including capital leases, was $6.76 billion in
4.0 to 1, Safeway’s ability to borrow under the bank credit
2004, $7.82 billion in 2003 and $8.44 billion in 2002. Total
agreement would be impaired. The computation of Adjusted
debt declined in 2004 and 2003 as Safeway used cash flow
EBITDA, as defined by the bank credit agreement, is
from operations to pay down debt. Annual debt maturities
provided below solely to provide an understanding of the
over the next five years are set forth in Note D of the
impact that Adjusted EBITDA has on Safeway’s ability to
Company’s 2004 consolidated financial statements.
borrow under the bank credit agreement. Adjusted EBITDA
The table below presents significant contractual obligations of the Company at year-end 2004:
(In millions) 2005 2006 2007 2008 2009 Thereafter Total
Long-term debt $ 596.9 $ 818.7 $ 785.2 $ 553.7 $ 502.2 $2,809.9 $6,066.6
Capital lease obligations(1) 42.8 40.8 41.8 42.5 43.7 485.2 696.8
Operating leases 405.9 396.8 380.9 362.5 328.3 2,778.6 4,653.0
Self-insurance liability 142.9 96.2 66.1 46.7 34.5 112.5 498.9
Contracts for purchase of property, equipment
and construction of buildings 139.7 – – – – – 139.7
Contracts for purchase of inventory 486.9 – – – – – 486.9
(1) Minimum lease payments, less amounts representing interest
2 6 S A F E WAY I N C . 2 0 0 4 A N N U A L R E P O R T