SlideShare a Scribd company logo
1 of 20
Download to read offline
CANADIAN NATIONAL RAILWAY COMPANY
CONSOLIDATED STATEMENT OF INCOME (U.S. GAAP)
(In millions, except per share data)


                                                                             Three months ended
                                                                                  March 31
                                                                              2009             2008
                                                                                 (Unaudited)

                                                                         $    1,859
Revenues                                                                                 $     1,927

Operating expenses
                                                                                454
   Labor and fringe benefits                                                                     461
                                                                                291
   Purchased services and material                                                               285
                                                                                182
   Fuel                                                                                          310
                                                                                203
   Depreciation and amortization                                                                 175
                                                                                 82
   Equipment rents                                                                                64
                                                                                166
   Casualty and other                                                                            109
                                                                              1,378
Total operating expenses                                                                       1,404

                                                                               481
Operating income                                                                                  523

                                                                              (112)
Interest expense                                                                                  (86)

                                                                               161                 (6)
Other income (loss) (Note 3)

                                                                               530
Income before income taxes                                                                        431

                                                                              (106)
Income tax expense                                                                             (120)

Net income                                                               $     424       $        311

Earnings per share (Note 9)
                                                                         $     0.91
   Basic                                                                                 $      0.64

                                                                         $     0.90
   Diluted                                                                               $      0.64

Weighted-average number of shares
                                                                              468.3
  Basic                                                                                        482.8

                                                                              472.3
   Diluted                                                                                     488.6
See accompanying notes to unaudited consolidated financial statements.


                                                                1
CANADIAN NATIONAL RAILWAY COMPANY
CONSOLIDATED BALANCE SHEET (U.S. GAAP)
(In millions)


                                                                         March 31          December 31        March 31
                                                                            2009                 2008            2008
                                                                         (Unaudited)                         (Unaudited)
Assets

Current assets:
                                                                $              349
  Cash and cash equivalents                                                            $          413    $         334
                                                                               940                913              621
  Accounts receivable (Note 4)
                                                                               273
  Material and supplies                                                                           200              212
                                                                                77
  Deferred income taxes                                                                            98               67
                                                                               138
  Other                                                                                           132              111
                                                                             1,777              1,756            1,345

                                                                           23,947
Properties                                                                                     23,203          20,754
                                                                            1,787
Intangible and other assets                                                                     1,761           2,065

Total assets                                                    $          27,511      $       26,720    $     24,164

Liabilities and shareholders' equity

Current liabilities:
                                                                $            1,280
  Accounts payable and other                                                           $        1,386    $       1,333
                                                                               527                506              269
  Current portion of long-term debt (Note 4)
                                                                             1,807              1,892            1,602

                                                                             5,594
Deferred income taxes                                                                           5,511            5,021
                                                                             1,371
Other liabilities and deferred credits                                                          1,353            1,404
                                                                             7,836              7,405            6,064
Long-term debt (Note 4)

Shareholders' equity:
                                                                            4,188
  Common shares                                                                                 4,179           4,241
                                                                             (126)
  Accumulated other comprehensive income (loss)                                                  (155)              9
                                                                            6,841
  Retained earnings                                                                             6,535           5,823
                                                                           10,903              10,559          10,073

Total liabilities and shareholders' equity                      $          27,511      $       26,720    $     24,164
See accompanying notes to unaudited consolidated financial statements.


                                                                2
CANADIAN NATIONAL RAILWAY COMPANY
CONSOLIDATED STATEMENT OF CHANGES IN SHAREHOLDERS’ EQUITY (U.S. GAAP)
(In millions)


                                                                                                                Three months ended
                                                                                                                     March 31
                                                                                                                  2009         2008
                                                                                                                     (Unaudited)
Common shares (1)

                                                                                                            $ 4,179
Balance, beginning of period                                                                                                  $    4,283
                                                                                                                  9
  Stock options exercised and other                                                                                                   23
                                                                                                                   -                 (65)
  Share repurchase programs (Note 4)
                                                                                                            $ 4,188
Balance, end of period                                                                                                        $    4,241

Accumulated other comprehensive income (loss)
                                                                                                            $     (155)
Balance, beginning of period                                                                                                  $      (31)
Other comprehensive income (loss):
Unrealized foreign exchange gain (loss) on:
                                                                                                                  251
  Translation of the net investment in foreign operations                                                                           187
  Translation of U.S. dollar-denominated long-term debt
                                                                                                                  (258)
    designated as a hedge of the net investment in U.S. subsidiaries                                                                (182)
Pension and other postretirement benefit plans:
   Amortization of net actuarial gain included in net
                                                                                                                      -
    periodic benefit cost                                                                                                             (1)
   Amortization of prior service cost included in net
                                                                                                                     1
    periodic benefit cost                                                                                                              6
                                                                                                                    (6)
Other comprehensive income (loss) before income taxes                                                                                 10
                                                                                                                    35
Income tax recovery                                                                                                                   30
                                                                                                                    29
Other comprehensive income                                                                                                            40
                                                                                                            $     (126)
Balance, end of period                                                                                                        $        9

Retained earnings

                                                                                                            $ 6,535
Balance, beginning of period                                                                                                  $    5,925
                                                                                                                   424
      Net income                                                                                                                     311
                                                                                                                      -
      Share repurchase programs                                                                                                     (302)
                                                                                                                  (118)
      Dividends                                                                                                                     (111)

                                                                                                            $ 6,841
Balance, end of period                                                                                                        $    5,823
See accompanying notes to unaudited consolidated financial statements.

(1)     During the three months ended March 31, 2009, the Company issued 0.2 million common shares as a result of stock options exercised. At
        March 31, 2009, the Company had 468.4 million common shares outstanding.


                                                                      3
CANADIAN NATIONAL RAILWAY COMPANY
CONSOLIDATED STATEMENT OF CASH FLOWS (U.S. GAAP)
(In millions)
                                                                             Three months ended
                                                                                  March 31
                                                                               2009          2008
                                                                                 (Unaudited)
Operating activities
                                                                         $      424
Net income                                                                              $        311
Adjustments to reconcile net income to net cash
 provided from operating activities:
                                                                                203
   Depreciation and amortization                                                                 175
                                                                                 10
   Deferred income taxes                                                                          25
                                                                               (157)
   Gain on disposal of property (Note 3)                                                            -
   Other changes in:
                                                                                  1
     Accounts receivable                                                                        (235)
                                                                                (53)
     Material and supplies                                                                       (48)
                                                                               (132)
     Accounts payable and other                                                                  (59)
                                                                                 36
     Other current assets                                                                         29
                                                                                (14)
   Other                                                                                         (33)
                                                                                318
Cash provided from operating activities                                                          165
Investing activities
                                                                               (187)
Property additions                                                                              (177)
                                                                               (373)                -
Acquisitions, net of cash acquired (Note 3)
                                                                                110                 -
Disposal of property (Note 3)
                                                                                  4
Other, net                                                                                        11
                                                                               (446)
Cash used by investing activities                                                               (166)

Financing activities
                                                                              1,440
Issuance of long-term debt                                                                     1,055
                                                                             (1,272)
Reduction of long-term debt                                                                     (580)
Issuance of common shares due to exercise of stock options and
                                                                                  2
  related excess tax benefits realized                                                            18
                                                                                   -
Repurchase of common shares                                                                     (367)
                                                                               (118)
Dividends paid                                                                                  (111)
                                                                                 52
Cash provided from financing activities                                                           15
Effect of foreign exchange fluctuations on U.S. dollar-
                                                                                 12
  denominated cash and cash equivalents                                                           10
Net increase (decrease) in cash and cash equivalents                            (64)              24
                                                                                413
Cash and cash equivalents, beginning of period                                                   310
Cash and cash equivalents, end of period                                 $      349     $        334

Supplemental cash flow information
                                                                         $    1,904
 Net cash receipts from customers and other                                             $      1,748
 Net cash payments for:
                                                                             (1,362)
     Employee services, suppliers and other expenses                                           (1,339)
                                                                               (106)
     Interest                                                                                    (100)
                                                                                 (4)
     Workforce reductions                                                                          (6)
                                                                                (30)
     Personal injury and other claims                                                             (26)
                                                                                   -
     Pensions                                                                                     (22)
                                                                                (84)
     Income taxes                                                                                 (90)
                                                                         $      318
Cash provided from operating activities                                                 $         165
See accompanying notes to unaudited consolidated financial statements.


                                                                4
CANADIAN NATIONAL RAILWAY COMPANY
NOTES TO UNAUDITED CONSOLIDATED FINANCIAL STATEMENTS (U.S. GAAP)
Note 1 - Basis of presentation

In management’s opinion, the accompanying unaudited Interim Consolidated Financial Statements and Notes thereto, expressed in
Canadian dollars, and prepared in accordance with U.S. generally accepted accounting principles (U.S. GAAP) for interim financial
statements, contain all adjustments (consisting of normal recurring accruals) necessary to present fairly Canadian National Railway
Company’s (the Company) financial position as at March 31, 2009, December 31, 2008, and March 31, 2008, and its results of
operations, changes in shareholders’ equity and cash flows for the three months ended March 31, 2009 and 2008.


These unaudited Interim Consolidated Financial Statements and Notes thereto have been prepared using accounting policies
consistent with those used in preparing the Company’s 2008 Annual Consolidated Financial Statements, except as disclosed in Note
2 – Accounting change. While management believes that the disclosures presented are adequate to make the information not
misleading, these unaudited Interim Consolidated Financial Statements and Notes thereto should be read in conjunction with the
Company’s Interim Management’s Discussion and Analysis (MD&A) and Annual Consolidated Financial Statements and Notes
thereto.


Note 2 – Accounting change


On January 1, 2009, the Company adopted Statement of Financial Accounting Standards (SFAS) No. 141 (R), “Business
Combinations,” which became effective for acquisitions with an acquisition date on or after the beginning of the first annual
reporting period beginning on or after December 15, 2008. Until December 31, 2008, the Company was subject to the requirements
of SFAS No. 141, “Business Combinations,” which required that acquisition-related costs be included as part of the purchase cost of
an acquired business. As such, the Company had reported acquisition-related costs in Other current assets pending the closing of its
acquisition of the Elgin, Joliet and Eastern Railway Company (EJ&E), which had been subject to an extensive U.S. Surface
Transportation Board (STB) approval process. On January 31, 2009, the Company completed its acquisition of the EJ&E and
accounted for the acquisition under SFAS No. 141 (R). The acquisition-related costs incurred to acquire the EJ&E of approximately
$46 million, including costs to obtain regulatory approval, were expensed and reported in Casualty and other in the Consolidated
Statement of Income for the three months ended March 31, 2009 pursuant to SFAS No. 141 (R) requirements. This change in
accounting policy had the effect of decreasing net income by $28 million ($0.06 per basic or diluted earnings per share) and Other
current assets by $46 million. This change had no effect on the Consolidated Statement of Cash Flows. Disclosures prescribed by
SFAS No. 141 (R) are presented in Note 3 – Acquisition and disposal of property.


Note 3 - Acquisition and disposal of property

Acquisition of Elgin, Joliet and Eastern Railway Company
On January 31, 2009, the Company acquired the principal rail lines of the EJ&E for a total cash consideration of U.S.$300 million
(Cdn$373 million), paid with cash on hand. The EJ&E is a short-line railway previously owned by U.S. Steel Corporation (U.S. Steel)
that operates over 198 miles of track and serves steel mills, petrochemical customers, utility plants and distribution centers in Illinois
and Indiana, as well as connects with all the major railroads entering Chicago. Under the terms of the acquisition agreement, the
Company acquired substantially all of the railroad operations of EJ&E, except those that support the Gary Works site in northwest
Indiana and the steelmaking operations of U.S. Steel. The acquisition is expected to drive new efficiencies and operating
improvements on CN’s network as a result of streamlined rail operations and reduced congestion in the Chicago area.
    The Company and EJ&E had entered into the acquisition agreement on September 25, 2007, and the Company had filed an
application for authorization of the transaction with the STB on October 30, 2007. Following an extensive regulatory approval
process, which included an Environmental Impact Statement (EIS) that resulted in conditions imposed to mitigate municipalities’
concerns regarding increased rail activity expected along the EJ&E line, the STB approved the transaction on December 24, 2008.
Over the next few years, the Company has committed to spend approximately U.S.$100 million for railroad infrastructure
improvements and over U.S.$60 million under a series of agreements with individual communities, a comprehensive voluntary


                                                                 5
CANADIAN NATIONAL RAILWAY COMPANY
NOTES TO UNAUDITED CONSOLIDATED FINANCIAL STATEMENTS (U.S. GAAP)
mitigation program that addresses municipalities’ concerns, and additional STB-imposed conditions that the Company has accepted
with one exception. The Company has filed an appeal challenging the STB's condition requiring the installation of grade separations
at two locations along the EJ&E at Company funding levels significantly beyond prior STB practice. Although the STB granted the
Company’s application to acquire control of the EJ&E on December 24, 2008, challenges have since been made by certain
communities as to the sufficiency of the STB’s EIS which, if successful, could result in reconsideration of the STB’s decision or further
consideration of the environmental impact of the transaction. The Company strongly disputes the merit of these challenges, and has
intervened in support of the STB’s defense against them. The final outcome of such challenges cannot be predicted with certainty,
and therefore, there can be no assurance that their resolution will not have a material adverse effect on the Company’s financial
position or results of operations.
     The Company has accounted for the acquisition using the purchase method of accounting pursuant to SFAS No. 141 (R),
“Business Combinations,” which the Company adopted on January 1, 2009. As such, the consolidated financial statements of the
Company include the assets, liabilities and results of operations of EJ&E as of January 31, 2009, the date of acquisition. The costs
incurred to acquire the EJ&E of approximately $46 million were expensed and reported in Casualty and other in the Consolidated
Statement of Income for the three-months ended March 31, 2009 (see Note 2 - Accounting change).
     The following table summarizes the consideration paid for EJ&E and the estimated fair value of the assets acquired and liabilities
assumed that were recognized at the acquisition date. The Company has not finalized its valuation of such assets and liabilities. As
such, the fair value is subject to change, although no material change is anticipated.

                                                                                                              At January 31, 2009
(In U.S. millions)


Consideration
Cash                                                                                                                    $     300
Fair value of total consideration transferred                                                                           $     300

Recognized amounts of identifiable assets acquired and liabilities assumed
Current assets                                                                                                          $       6
Other long-term assets                                                                                                          4
Property, plant and equipment                                                                                                 304
Current liabilities                                                                                                            (4)
Other long-term liabilities                                                                                                   (10)
Total identifiable net assets                                                                                           $     300


     The amount of revenues and net income of EJ&E included in the Company’s Consolidated Statement of Income from the
acquisition date to March 31, 2009, were $14 million and $3 million, respectively. The Company has not provided supplemental pro
forma information relating to the pre-acquisition period as it was not considered material to the results of operations of the
Company.


Disposal of Weston subdivision
In March 2009, the Company entered into an agreement with GO Transit to sell the property known as the Weston subdivision in
Toronto, Ontario, together with the rail fixtures and certain passenger agreements (collectively the “Rail Property”), for cash proceeds
of $110 million before transaction costs, with a balance on sale of about $50 million to be placed in escrow on the Company’s
behalf and released in accordance with the terms of the agreement but no later than December 31, 2009. Under the agreement, the
Company obtained the perpetual right to operate freight trains over the Rail Property at the current level of operating activity. The
transaction resulted in a gain on disposition of $157 million ($135 million after-tax), including amounts related to the real estate as
well as the retention of trackage and other rights. The Company accounted for the transaction in Other income (loss) under the full
accrual method of accounting for real estate transactions.


                                                                 6
CANADIAN NATIONAL RAILWAY COMPANY
NOTES TO UNAUDITED CONSOLIDATED FINANCIAL STATEMENTS (U.S. GAAP)
Note 4 - Financing activities

Shelf prospectus and registration statement
In February 2009, the Company issued U.S.$550 million (Cdn$684 million) of 5.55% Notes due 2019. The debt offering was made
under the Company’s currently effective shelf prospectus and registration statement, filed by the Company in December 2007.
Accordingly, the amount registered for offering under the shelf prospectus and registration statement has been reduced to U.S.$1.3
billion. The Company used the net proceeds of U.S.$540 million (Cdn$672 million) from the offering to repay a portion of its
outstanding commercial paper and to reduce a portion of its accounts receivable securitization program.


Revolving credit facility
As at March 31, 2009, the Company had letters of credit drawn on its U.S.$1 billion revolving credit facility, expiring in October
2011, of $193 million ($181 million as at December 31, 2008). The Company also had total borrowings under its commercial paper
program of $166 million, of which $155 million was denominated in Canadian dollars and $11 million was denominated in U.S.
dollars (U.S.$9 million). The weighted-average interest rate on these borrowings was 1.24%. As at December 31, 2008, total
borrowings under the Company’s commercial paper program were $626 million, of which $256 million was denominated in
Canadian dollars and $370 million was denominated in U.S. dollars (U.S.$303 million). The weighted-average interest rate on these
borrowings was 2.42%.


Accounts receivable securitization
The Company has a five-year agreement, expiring in May 2011, to sell an undivided co-ownership interest for maximum cash
proceeds of $600 million in a revolving pool of freight receivables to an unrelated trust. Pursuant to the agreement, the Company
sells an interest in its receivables and receives proceeds net of the required reserve as stipulated in the agreement. The required
reserve represents an amount set aside to allow for possible credit losses and is recognized by the Company as retained interest and
recorded in Other current assets in its Consolidated Balance Sheet. The eligible freight receivables as defined in the agreement may
not include delinquent or defaulted receivables, or receivables that do not meet certain obligor-specific criteria, including
concentrations in excess of prescribed limits with any one customer.
     During the first quarter of 2009, proceeds from collections reinvested in the securitization program were approximately $132
million and purchases of previously transferred accounts receivable were approximately $4 million. At March 31, 2009, the servicing
asset and liability were not significant.     Subject to customary indemnifications, the trust’s recourse is generally limited to the
receivables.
     As at March 31, 2009, the Company had sold receivables that resulted in proceeds of $2 million under this program ($71 million
at December 31, 2008), and recorded retained interest of approximately 10% of this amount in Other current assets (retained
interest of approximately 10% recorded as at December 31, 2008). The fair value of the retained interest approximated carrying
value as a result of the short collection cycle and negligible credit losses.


Share repurchase program
During the first quarter of 2009, the Company did not repurchase any common shares under its current 25.0 million share
repurchase program.
     The Company has repurchased a total of 6.1 million common shares since July 2008, the inception of the program, for $331
million, at a weighted-average price of $54.42 per share.


                                                                   7
CANADIAN NATIONAL RAILWAY COMPANY
NOTES TO UNAUDITED CONSOLIDATED FINANCIAL STATEMENTS (U.S. GAAP)
Note 5 - Stock plans

The Company has various stock-based incentive plans for eligible employees. A description of the plans is provided in Note 11 –
Stock plans, to the Company’s 2008 Annual Consolidated Financial Statements. For the three months ended March 31, 2009 and
2008, the Company recorded total compensation expense for awards under all plans of $15 million and $28 million, respectively. The
total tax benefit recognized in income in relation to stock-based compensation expense for the three months ended March 31, 2009
and 2008 was $4 million and $7 million, respectively.


Cash settled awards
Following approval by the Board of Directors in January 2009, the Company granted 0.8 million restricted share units (RSUs) to
designated management employees entitling them to receive payout in cash based on the Company’s share price. The RSUs granted
by the Company are generally scheduled for payout in cash after three years (“plan period”) and vest conditionally upon the
attainment of a target relating to return on invested capital over the plan period. Payout is conditional upon the attainment of a
minimum share price calculated using the average of the last three months of the plan period. As at March 31, 2009, 0.2 million
RSUs remained authorized for future issuance under this plan.
      The following table provides the 2009 activity for all cash settled awards:


                                                                                                        Voluntary Incentive
                                                                                     RSUs               Deferral Plan (VIDP)
                                                                              Nonvested     Vested      Nonvested         Vested
In millions

                                                                                              0.9 (1)
Outstanding at December 31, 2008                                                    1.3                       0.1           1.8
Granted                                                                             0.8         -               -             -
Transferred into plan                                                                 -         -               -           0.1
Payout                                                                                -      (0.9)              -          (0.1)
                                                                                    2.1         -             0.1           1.8
Outstanding at March 31, 2009
(1) Includes 0.1 million of 2004 time-vested RSUs.


                                                                  8
CANADIAN NATIONAL RAILWAY COMPANY
NOTES TO UNAUDITED CONSOLIDATED FINANCIAL STATEMENTS (U.S. GAAP)
      The following table provides valuation and expense information for all cash settled awards:

                                                                                         RSUs (1)                        Vision (1)         VIDP (2)       Total
In millions, unless otherwise indicated
                                                                                                                                             2003
Year of grant                                            2009         2008           2007           2006        2004            2005       onwards

Stock-based compensation expense (recovery)
   recognized over requisite service period
Three months ended March 31, 2009         $                 9$           1       $       -   $        (2)        N/A             N/A   $         -     $      8
Three months ended March 31, 2008                          N/A $         7       $      2    $         4    $     1     $         3    $         6     $     23

Liability outstanding
March 31, 2009                                       $      9$           9       $      9    $          -   $       -            N/A   $        88     $   115
December 31, 2008                                          N/A $         8       $      9    $        53    $      3    $          -   $        88     $   161

Fair value per unit
March 31, 2009 ($)                                   $   25.44 $   21.20         $   16.61           N/A         N/A             N/A   $     45.20          N/A

Fair value of awards vested during period
Three months ended March 31, 2009         $                  -$          -       $       -           N/A         N/A             N/A   $         1     $      1
Three months ended March 31, 2008                          N/A $         -       $       -   $         -    $      -    $          -   $         1     $      1

Nonvested awards at March 31, 2009
Unrecognized compensation cost                       $      10 $         4       $       2           N/A         N/A             N/A   $         3     $    19
Remaining recognition period (years)                      2.75        1.75            0.75           N/A         N/A             N/A          3.75          N/A

Assumptions (3)
Stock price ($)                                      $   45.20 $   45.20         $   45.20           N/A         N/A             N/A   $     45.20          N/A
                                   (4)
Expected stock price volatility                            29%       32%               37%           N/A         N/A             N/A           N/A          N/A
Expected term (years) (5)                                 2.75      1.75              0.75           N/A         N/A             N/A           N/A          N/A
Risk-free interest rate (6)                              1.28%     0.95%             0.53%           N/A         N/A             N/A           N/A          N/A
Dividend rate ($) (7)                                $    1.01 $    1.01         $    1.01           N/A         N/A             N/A           N/A          N/A

(1) Compensation cost is based on the fair value of the awards at period-end using the lattice-based valuation model that uses the assumptions as presented
    herein.
(2) Compensation cost is based on intrinsic value.
(3) Assumptions used to determine fair value are at March 31, 2009.
(4) Based on the historical volatility of the Company's stock over a period commensurate with the expected term of the award.
(5) Represents the remaining period of time that awards are expected to be outstanding.
(6) Based on the implied yield available on zero-coupon government issues with an equivalent term commensurate with the expected term of the awards.
(7) Based on the annualized dividend rate.


Stock option awards
Following approval by the Board of Directors in January 2009, the Company granted 1.2 million conventional stock options to
designated senior management employees. The stock option plan allows eligible employees to acquire common shares of the
Company upon vesting at a price equal to the market value of the common shares at the date of grant. The options are exercisable
during a period not exceeding 10 years. The right to exercise options generally accrues over a period of four years of continuous
employment. Options are not generally exercisable during the first 12 months after the date of grant. At March 31, 2009, 12.3
million common shares remained authorized for future issuances under this plan. The total number of options outstanding at March
31, 2009, including conventional, performance and performance-accelerated options, was 10.9 million, 0.1 million and 3.2 million,
respectively.


                                                                             9
CANADIAN NATIONAL RAILWAY COMPANY
NOTES TO UNAUDITED CONSOLIDATED FINANCIAL STATEMENTS (U.S. GAAP)
      The following table provides the activity of stock option awards in 2009. The table also provides the aggregate intrinsic value for
in-the-money stock options, which represents the amount that would have been received by option holders had they exercised their
options on March 31, 2009 at the Company’s closing stock price of $45.20.


                                                                                              Options outstanding
                                                                                         Weighted-
                                                                 Number                     average     Weighted-average                Aggregate
                                                              of options               exercise price   years to expiration       intrinsic value
                                                                In millions                                                              In millions
Outstanding at December 31, 2008(1)                                 13.2           $          29.05
Granted                                                               1.2          $          41.92
Exercised                                                            (0.2)         $          16.45
Outstanding at March 31, 2009 (1)                                   14.2           $          30.67                     4.6         $         233
                                   (1)
                                                                    11.6           $          26.51                     3.7         $         230
Exercisable at March 31, 2009

(1)    Stock options with a U.S. dollar exercise price have been translated to Canadian dollars using the foreign exchange rate in effect at the
       balance sheet date.


                                                                              10
CANADIAN NATIONAL RAILWAY COMPANY
NOTES TO UNAUDITED CONSOLIDATED FINANCIAL STATEMENTS (U.S. GAAP)

      The following table provides valuation and expense information for all stock option awards:


In millions, unless otherwise indicated
Year of grant                                                  2009                2008                2007                2006                2005                 Total


Stock-based compensation expense
  recognized over requisite service period (1)
Three months ended March 31, 2009                      $           5       $            -      $            1      $            1      $            -       $             7
Three months ended March 31, 2008                                N/A       $           3       $            1      $            -      $            1       $             5


Fair value per unit
At grant date ($)                                      $      12.51        $      12.44        $       13.36       $       13.80       $        9.19                     N/A


Fair value of awards vested during period
Three months ended March 31, 2009                      $             -     $           3       $            3      $            3      $            3       $            12
Three months ended March 31, 2008                                N/A       $             -     $            3      $            3      $            3       $             9


Nonvested awards at March 31, 2009
Unrecognized compensation cost                         $           9       $           4       $            2      $            1      $            -       $            16
Remaining recognition period (years)                             3.8                 2.8                 1.8                 0.8                    -                    N/A


Assumptions
Grant price ($)                                        $      41.92        $      48.51        $       52.79       $       51.51       $       36.33                     N/A
                                   (2)
Expected stock price volatility                                 39%                  27%                 24%                 25%                 25%                     N/A
Expected term (years) (3)                                        5.3                 5.3                 5.2                 5.2                  5.2                    N/A
                          (4)
Risk-free interest rate                                       1.95%               3.58%               4.12%                4.04%               3.50%                     N/A
Dividend rate ($) (5)                                  $        1.01       $        0.92       $        0.84       $        0.65       $        0.50                     N/A

(1) Compensation cost is based on the grant date fair value using the Black-Scholes option-pricing model that uses the assumptions at the grant date.
(2) Based on the average of the historical volatility of the Company's stock over a period commensurate with the expected term of the award and the implied volatility
    from traded options on the Company's stock.

(3) Represents the period of time that awards are expected to be outstanding. The Company uses historical data to estimate option exercise and employee termination,
    and groups of employees that have similar historical exercise behavior are considered separately.

(4) Based on the implied yield available on zero-coupon government issues with an equivalent term commensurate with the expected term of the awards.
(5) Based on the annualized dividend rate.


                                                                            11
CANADIAN NATIONAL RAILWAY COMPANY
NOTES TO UNAUDITED CONSOLIDATED FINANCIAL STATEMENTS (U.S. GAAP)
Note 6 - Pensions and other postretirement benefits

For the three months ended March 31, 2009 and 2008, the components of net periodic benefit cost (income) for pensions and other
postretirement benefits were as follows:


(a) Components of net periodic benefit income for pensions

                                                                                                    Three months ended
                                                                                                         March 31
                                                                                                      2009           2008
In millions
                                                                                                $        22
Service cost                                                                                                    $          35
                                                                                                        222
Interest cost                                                                                                             200
                                                                                                       (252)
Expected return on plan assets                                                                                           (251)
                                                                                                           -
Amortization of prior service cost                                                                                          5
                                                                                                           1
Recognized net actuarial loss                                                                                               -
                                                                                                $         (7)   $         (11)
Net periodic benefit income


(b) Components of net periodic benefit cost for other postretirement benefits

                                                                                                    Three months ended
                                                                                                         March 31
                                                                                                       2009             2008
In millions
                                                                                                $          1
Service cost                                                                                                    $           1
                                                                                                           4
Interest cost                                                                                                               4
                                                                                                          (3)
Curtailment gain                                                                                                           (2)
                                                                                                           1
Amortization of prior service cost                                                                                          1
                                                                                                          (1)
Recognized net actuarial gain                                                                                              (1)
                                                                                                $          2    $           3
Net periodic benefit cost


     In 2009, the Company expects to make total contributions of approximately $130 million for all its defined benefit plans.


Note 7 – Income taxes

In the first quarter of 2009, the Company recorded a deferred income tax recovery of $15 million in the Consolidated Statement of
Income resulting from the enactment of lower provincial corporate income tax rates.


In the first quarter of 2008, the Company recorded a deferred income tax recovery of $11 million in the Consolidated Statement of
Income that resulted from net capital losses arising from the reorganization of a subsidiary.


                                                                12
CANADIAN NATIONAL RAILWAY COMPANY
NOTES TO UNAUDITED CONSOLIDATED FINANCIAL STATEMENTS (U.S. GAAP)
Note 8 - Major commitments and contingencies

A. Commitments
As at March 31, 2009, the Company had commitments to acquire railroad ties, rail, freight cars, locomotives, and other equipment
and services, as well as outstanding information technology service contracts and licenses, at an aggregate cost of $917 million
($1,006 million at December 31, 2008). The Company also has agreements with fuel suppliers to purchase approximately 85% of the
estimated remaining 2009 volume, 50% of its anticipated 2010 volume, and 18% of its anticipated 2011 volume, at market prices
prevailing on the date of the purchase.


B. Contingencies
The Company becomes involved, from time to time, in various legal actions, including actions brought on behalf of various
purported classes of claimants and claims relating to personal injuries, occupational disease, and property damage, arising out of
harm to individuals or property allegedly caused by derailments or other accidents.

Canada
Employee injuries are governed by the workers’ compensation legislation in each province whereby employees may be awarded
either a lump sum or future stream of payments depending on the nature and severity of the injury. Accordingly, the Company
accounts for costs related to employee work-related injuries based on actuarially developed estimates of the ultimate cost associated
with such injuries, including compensation, health care and third-party administration costs. For all other legal actions, the Company
maintains, and regularly updates on a case-by-case basis, provisions for such items when the expected loss is both probable and can
be reasonably estimated based on currently available information.


United States
Employee work-related injuries, including occupational disease claims, are compensated according to the provisions of the Federal
Employers’ Liability Act (FELA), which requires either the finding of fault through the U.S. jury system or individual settlements, and
represent a major liability for the railroad industry. With limited exceptions where claims are evaluated on a case-by-case basis, the
Company follows an actuarial-based approach and accrues the expected cost for personal injury and property damage claims and
asserted and unasserted occupational disease claims, based on actuarial estimates of their ultimate cost. A comprehensive actuarial
study is conducted on an annual basis, in the fourth quarter, by an independent actuarial firm for occupational disease claims and
non-occupational disease claims. On an ongoing basis, management reviews and compares the assumptions inherent in the latest
actuarial study with the current claim experience and, if required, adjustments to the liability are recorded.


As at March 31, 2009, the Company had aggregate reserves for personal injury and other claims of $461 million, of which $121
million was recorded as a current liability ($454 million, of which $118 million was recorded as a current liability at December 31,
2008). Although the Company considers such provisions to be adequate for all its outstanding and pending claims, the final
outcome with respect to actions outstanding or pending at March 31, 2009, or with respect to future claims, cannot be predicted
with certainty, and therefore there can be no assurance that their resolution will not have a material adverse effect on the
Company’s results of operations, financial position or liquidity in a particular quarter or fiscal year.


C. Environmental matters
The Company’s operations are subject to numerous federal, provincial, state, municipal and local environmental laws and regulations
in Canada and the United States concerning, among other things, emissions into the air; discharges into waters; the generation,
handling, storage, transportation, treatment and disposal of waste, hazardous substances, and other materials; decommissioning of
underground and aboveground storage tanks; and soil and groundwater contamination. A risk of environmental liability is inherent
in railroad and related transportation operations; real estate ownership, operation or control; and other commercial activities of the
Company with respect to both current and past operations.


                                                                  13
CANADIAN NATIONAL RAILWAY COMPANY
NOTES TO UNAUDITED CONSOLIDATED FINANCIAL STATEMENTS (U.S. GAAP)
Known existing environmental concerns
The Company has identified approximately 340 sites at which it is or may be liable for remediation costs, in some cases along with
other potentially responsible parties, associated with alleged contamination and is subject to environmental clean-up and
enforcement actions, including those imposed by the United States Federal Comprehensive Environmental Response, Compensation
and Liability Act of 1980 (CERCLA), also known as the Superfund law, or analogous state laws. CERCLA and similar state laws, in
addition to other similar Canadian and U.S. laws generally impose joint and several liability for clean-up and enforcement costs on
current and former owners and operators of a site, as well as those whose waste is disposed of at the site, without regard to fault or
the legality of the original conduct. The Company has been notified that it is a potentially responsible party for study and clean-up
costs at approximately 10 sites governed by the Superfund law (and analogous state laws) for which investigation and remediation
payments are or will be made or are yet to be determined and, in many instances, is one of several potentially responsible parties.
    The ultimate cost of addressing these known contaminated sites cannot be definitely established given that the estimated
environmental liability for any given site may vary depending on the nature and extent of the contamination, the available clean-up
techniques, the Company’s share of the costs and evolving regulatory standards governing environmental liability. As a result, a
liability is initially recorded when environmental assessments occur and/or remedial efforts are probable, and when the costs, based
on a specific plan of action in terms of the technology to be used and the extent of the corrective action required, can be reasonably
estimated. Adjustments to initial estimates are recorded as additional information becomes available.
    The Company’s provision for specific environmental sites is undiscounted, is recorded net of potential and actual insurance
recoveries, and includes costs for remediation and restoration of sites, as well as significant monitoring costs.        Environmental
accruals, which are classified as Casualty and other in the Consolidated Statement of Income, include amounts for newly identified
sites or contaminants as well as adjustments to initial estimates.
    As at March 31, 2009, the Company had aggregate accruals for environmental costs of $125 million, of which $32 million was
recorded as a current liability ($125 million, of which $30 million was recorded as a current liability as at December 31, 2008). Based
on the information currently available, the Company considers its provisions to be adequate.


Unknown existing environmental concerns
While the Company believes that it has identified the costs likely to be incurred for environmental matters in the next several years,
based on known information, newly discovered facts, changes in law, the possibility of spills and releases of hazardous materials into
the environment and the Company’s ongoing efforts to identify potential environment liabilities that may be associated with its
properties may lead to future environmental investigations, which may result in the identification of additional environmental costs
and liabilities and related costs. The magnitude of such additional liabilities and the costs of complying with future environmental
laws and containing or remediating contamination cannot be reasonably estimated due to many factors including:


(i) the lack of specific technical information available with respect to many sites;
(ii) the absence of any government authority, third-party orders, or claims with respect to particular sites;
(iii) the potential for new or changed laws and regulations and for development of new remediation technologies and uncertainty
    regarding the timing of the work with respect to particular sites;
(iv) the ability to recover costs from any third parties with respect to particular sites; and


therefore, the likelihood of any such costs being incurred or whether such costs would be material to the Company cannot be
determined at this time. There can thus be no assurance that material liabilities or costs related to environmental matters will not be
incurred in the future, or will not have a material adverse effect on the Company’s financial position or results of operations in a
particular quarter or fiscal year, or that the Company’s liquidity will not be adversely impacted by such liabilities or costs, although
management believes, based on current information, that the costs to address environmental matters will not have a material
adverse effect on the Company’s financial condition or liquidity. Costs related to any unknown existing or future contamination
remediation will be accrued in the period in which they become probable and reasonably estimable.


                                                                   14
CANADIAN NATIONAL RAILWAY COMPANY
NOTES TO UNAUDITED CONSOLIDATED FINANCIAL STATEMENTS (U.S. GAAP)

D. Guarantees and indemnifications
In the normal course of business, the Company, including certain of its subsidiaries, enters into agreements that may involve
providing certain guarantees or indemnifications to third parties and others, which may extend beyond the term of the agreement.
These include, but are not limited to, residual value guarantees on operating leases, standby letters of credit and surety and other
bonds, and indemnifications that are customary for the type of transaction or for the railway business.
    The Company is required to recognize a liability for the fair value of the obligation undertaken in issuing certain guarantees on
the date the guarantee is issued or modified. In addition, where the Company expects to make a payment in respect of a guarantee,
a liability will be recognized to the extent that one has not yet been recognized.


(i) Guarantee of residual values of operating leases
The Company has guaranteed a portion of the residual values of certain of its assets under operating leases with expiry dates
between 2009 and 2020, for the benefit of the lessor. If the fair value of the assets, at the end of their respective lease term, is less
than the fair value, as estimated at the inception of the lease, then the Company must, under certain conditions, compensate the
lessor for the shortfall. At March 31, 2009, the maximum exposure in respect of these guarantees was $245 million. There are no
recourse provisions to recover any amounts from third parties.

(ii) Other guarantees
The Company, including certain of its subsidiaries, has granted irrevocable standby letters of credit and surety and other bonds,
issued by highly rated financial institutions, to third parties to indemnify them in the event the Company does not perform its
contractual obligations. As at March 31, 2009, the maximum potential liability under these guarantees was $466 million, of which
$409 million was for workers’ compensation and other employee benefits and $57 million was for equipment under leases and
other. During 2009, the Company has granted guarantees for which no liability has been recorded, as they relate to the Company’s
future performance.
    As at March 31, 2009, the Company had not recorded any additional liability with respect to these guarantees, as the Company
does not expect to make any additional payments associated with these guarantees. The majority of the guarantee instruments
mature at various dates between 2009 and 2012.


(iii) General indemnifications
In the normal course of business, the Company has provided indemnifications, customary for the type of transaction or for the
railway business, in various agreements with third parties, including indemnification provisions where the Company would be
required to indemnify third parties and others. Indemnifications are found in various types of contracts with third parties which
include, but are not limited to:
    (a) contracts granting the Company the right to use or enter upon property owned by third parties such as leases, easements,
          trackage rights and sidetrack agreements;
    (b) contracts granting rights to others to use the Company’s property, such as leases, licenses and easements;
    (c)   contracts for the sale of assets and securitization of accounts receivable;
    (d) contracts for the acquisition of services;
    (e) financing agreements;
    (f)   trust indentures, fiscal agency agreements, underwriting agreements or similar agreements relating to debt or equity
          securities of the Company and engagement agreements with financial advisors;
    (g) transfer agent and registrar agreements in respect of the Company’s securities;
    (h) trust and other agreements relating to pension plans and other plans, including those establishing trust funds to secure
          payment to certain officers and senior employees of special retirement compensation arrangements;
    (i)   pension transfer agreements;
    (j)   master agreements with financial institutions governing derivative transactions; and
    (k) settlement agreements with insurance companies or other third parties whereby such insurer or third party has been
          indemnified for any present or future claims relating to insurance policies, incidents or events covered by the settlement
          agreements.


                                                                 15
CANADIAN NATIONAL RAILWAY COMPANY
NOTES TO UNAUDITED CONSOLIDATED FINANCIAL STATEMENTS (U.S. GAAP)
    To the extent of any actual claims under these agreements, the Company maintains provisions for such items, which it considers
to be adequate. Due to the nature of the indemnification clauses, the maximum exposure for future payments may be material.
However, such exposure cannot be determined with certainty.
    The Company has entered into various indemnification contracts with third parties for which the maximum exposure for future
payments cannot be determined with certainty.        As a result, the Company was unable to determine the fair value of these
guarantees and accordingly, no liability was recorded. There are no recourse provisions to recover any amounts from third parties.


Note 9 – Earnings per share

The following table provides a reconciliation between basic and diluted earnings per share:


                                                                                                  Three months ended
                                                                                                        March 31
                                                                                                      2009              2008
In millions, except per share data


                                                                                              $        424
Net income                                                                                                    $          311


                                                                                                     468.3
Weighted-average shares outstanding                                                                                    482.8
                                                                                                       4.0
Effect of stock options                                                                                                   5.8
                                                                                                     472.3
Weighted-average diluted shares outstanding                                                                            488.6


                                                                                              $       0.91
Basic earnings per share                                                                                      $         0.64
                                                                                              $       0.90
Diluted earnings per share                                                                                    $         0.64


The weighted-average number of stock options that were not included in the calculation of diluted earnings per share, as their
inclusion would have had an anti-dilutive impact, was 1.1 million for the three months ended March 31, 2009, and 0.2 million for
the corresponding period in 2008.


Note 10 – Comparative figures


Certain figures, previously reported in 2008, have been reclassified to conform with the basis of presentation adopted in 2009.


                                                               16
CANADIAN NATIONAL RAILWAY COMPANY
SELECTED RAILROAD STATISTICS (1) (U.S. GAAP)

                                                                                              Three months ended
                                                                                                   March 31
                                                                                                   2009           2008
                                                                                                   (Unaudited)
Statistical operating data

                                                                                                  1,696
Rail freight revenues ($ millions)                                                                                1,760
                                                                                                 73,557
Gross ton miles (GTM) (millions)                                                                                 84,327
                                                                                                 38,691
Revenue ton miles (RTM) (millions)                                                                               44,959
                                                                                                    954
Carloads (thousands)                                                                                              1,132
                                                                                                 21,104
Route miles (includes Canada and the U.S.)                                                                       20,421
                                                                                                 22,083
Employees (end of period)                                                                                        22,703
                                                                                                 22,260
Employees (average for the period)                                                                               22,636

Productivity

                                                                                                   74.1
Operating ratio (%)                                                                                                72.9
                                                                                                   4.38
Rail freight revenue per RTM (cents)                                                                               3.91
                                                                                                  1,778
Rail freight revenue per carload ($)                                                                              1,555
                                                                                                   1.87
Operating expenses per GTM (cents)                                                                                 1.66
                                                                                                   0.62
Labor and fringe benefits expense per GTM (cents)                                                                  0.55
                                                                                                  3,304
GTMs per average number of employees (thousands)                                                                  3,725
                                                                                                     85
Diesel fuel consumed (U.S. gallons in millions)                                                                     99
                                                                                                   1.98
Average fuel price ($/U.S. gallon)                                                                                 3.02
                                                                                                    865
GTMs per U.S. gallon of fuel consumed                                                                              852


Safety indicators

Injury frequency rate per 200,000 person hours (2)                                                 1.29            2.11
Accident rate per million train miles (2)                                                          2.13            2.66

Financial ratio

                                                                                                   43.4
Debt to total capitalization ratio (% at end of period)                                                            38.6
(1) Includes data relating to companies acquired as of the date of acquisition.
(2) Based on Federal Railroad Administration (FRA) reporting criteria.


Certain statistical data and related productivity measures are based on estimated data available at such time and are subject to
change as more complete information becomes available.

                                                                              17
CANADIAN NATIONAL RAILWAY COMPANY
SUPPLEMENTARY INFORMATION (U.S. GAAP)
                                                                                      Three months ended March 31
                                                                                                              Variance
                                                                                        2009         2008   Fav (Unfav)
                                                                                              (Unaudited)
Revenues (millions of dollars)
                                                                                           340
Petroleum and chemicals                                                                                 319            7%
                                                                                           198
Metals and minerals                                                                                     205          (3%)
                                                                                           302
Forest products                                                                                         330          (8%)
                                                                                           103
Coal                                                                                                     99            4%
                                                                                           357
Grain and fertilizers                                                                                   340            5%
                                                                                           319
Intermodal                                                                                              351          (9%)
                                                                                            77
Automotive                                                                                              116         (34%)
                                                                                         1,696
Total rail freight revenue                                                                            1,760          (4%)
                                                                                           163
Other revenues                                                                                          167          (2%)
                                                                                         1,859
Total revenues                                                                                        1,927          (4%)

Revenue ton miles (millions)
                                                                                        7,527
Petroleum and chemicals                                                                               8,426         (11%)
                                                                                        3,252
Metals and minerals                                                                                   4,091         (21%)
                                                                                        6,614
Forest products                                                                                       8,458         (22%)
                                                                                        2,841
Coal                                                                                                  3,392         (16%)
                                                                                       10,558
Grain and fertilizers                                                                                11,829         (11%)
                                                                                        7,476
Intermodal                                                                                            8,089          (8%)
                                                                                          423
Automotive                                                                                              674         (37%)
                                                                                       38,691        44,959         (14%)
Rail freight revenue / RTM (cents)
Total rail freight revenue per RTM                                                        4.38          3.91         12%
Commodity groups:
                                                                                          4.52
Petroleum and chemicals                                                                                3.79          19%
                                                                                          6.09
Metals and minerals                                                                                    5.01          22%
                                                                                          4.57
Forest products                                                                                        3.90          17%
                                                                                          3.63
Coal                                                                                                   2.92          24%
                                                                                          3.38
Grain and fertilizers                                                                                  2.87          18%
                                                                                          4.27
Intermodal                                                                                             4.34          (2%)
                                                                                         18.20
Automotive                                                                                            17.21            6%

Carloads (thousands)
                                                                                          128
Petroleum and chemicals                                                                                 145         (12%)
                                                                                          180
Metals and minerals                                                                                     238         (24%)
                                                                                          100
Forest products                                                                                         127         (21%)
                                                                                           90
Coal                                                                                                     87            3%
                                                                                          132
Grain and fertilizers                                                                                   151         (13%)
                                                                                          292
Intermodal                                                                                              327         (11%)
                                                                                           32
Automotive                                                                                               57         (44%)
                                                                                          954         1,132         (16%)
Rail freight revenue / carload (dollars)
Total rail freight revenue per carload                                                   1,778        1,555          14%
Commodity groups:
                                                                                         2,656
Petroleum and chemicals                                                                               2,200          21%
                                                                                         1,100
Metals and minerals                                                                                     861          28%
                                                                                         3,020
Forest products                                                                                       2,598          16%
                                                                                         1,144
Coal                                                                                                  1,138           1%
                                                                                         2,705
Grain and fertilizers                                                                                 2,252          20%
                                                                                         1,092
Intermodal                                                                                            1,073           2%
                                                                                         2,406
Automotive                                                                                            2,035          18%

Such statistical data and related productivity measures are based on estimated data available at such time and are subject to change
as more complete information becomes available.


                                                              18
CANADIAN NATIONAL RAILWAY COMPANY
NON-GAAP MEASURES - unaudited

Adjusted performance measures


During the three months ended March 31, 2009, the Company reported adjusted net income of $302 million, or $0.64 per diluted
share. The adjusted figures exclude the EJ&E acquisition-related costs of $46 million or $28 million after-tax ($0.06 per diluted share),
the gain on sale of the Weston subdivision of $157 million or $135 million after-tax ($0.29 per diluted share) and a deferred income
tax recovery of $15 million ($0.03 per diluted share) resulting from the enactment of lower provincial corporate income tax rates.
During the three months ended March 31, 2008, the Company reported adjusted net income of $300 million, or $0.62 per diluted
share. The adjusted figures exclude a deferred income tax recovery of $11 million ($0.02 per diluted share) that resulted from net
capital losses arising from the reorganization of a subsidiary.
    Management believes that adjusted net income and adjusted earnings per share are useful measures of performance that can
facilitate period-to-period comparisons, as they exclude items that do not necessarily arise as part of the normal day-to-day
operations of the Company and could distort the analysis of trends in business performance. The exclusion of such items in adjusted
net income and adjusted earnings per share does not, however, imply that such items are necessarily non-recurring. These adjusted
measures do not have any standardized meaning prescribed by GAAP and may, therefore, not be comparable to similar measures
presented by other companies. The reader is advised to read all information provided in the Company’s 2009 unaudited Interim
Consolidated Financial Statements and Notes thereto. The following tables provide a reconciliation of net income and earnings per
share, as reported for the three months ended March 31, 2009 and 2008, to the adjusted performance measures presented herein.


                                                    Three months ended                                     Three months ended
                                                      March 31, 2009                                         March 31, 2008
                                         Reported       Adjustments          Adjusted         Reported         Adjustments         Adjusted
In millions, except per share data


Revenues                             $     1,859    $                -   $     1,859     $       1,927     $              -   $       1,927
Operating expenses                         1,378                  (46)         1,332             1,404                    -           1,404
Operating income                             481                  46             527               523                    -             523
Interest expense                            (112)                   -           (112)              (86)                   -             (86)
Other income (loss)                          161              (157)                4                 (6)                  -                 (6)
Income before income taxes                   530              (111)              419               431                    -             431

Income tax expense                          (106)                 (11)          (117)             (120)                (11)            (131)

Net income                           $       424    $         (122)      $       302     $         311     $           (11)   $         300

Operating ratio                            74.1%                               71.7%             72.9%                                72.9%

Basic earnings per share             $      0.91    $         (0.26)     $      0.65     $        0.64     $         (0.02)   $        0.62
Diluted earnings per share           $      0.90    $         (0.26)     $      0.64     $        0.64     $         (0.02)   $        0.62


                                                                    19
CANADIAN NATIONAL RAILWAY COMPANY
NON-GAAP MEASURES - unaudited

Free cash flow


The Company generated $207 million of free cash flow for the quarter ended March 31, 2009 compared to $61 million for the same
period in 2008. Free cash flow does not have any standardized meaning prescribed by GAAP and may, therefore, not be comparable
to similar measures presented by other companies. The Company believes that free cash flow is a useful measure of performance as
it demonstrates the Company’s ability to generate cash after the payment of capital expenditures and dividends. The Company
defines free cash flow as cash provided from operating activities, adjusted for changes in the accounts receivable securitization
program and in cash and cash equivalents resulting from foreign exchange fluctuations, less cash used by investing activities,
adjusted for the impact of major acquisitions, and the payment of dividends, calculated as follows:


                                                                                                      Three months ended
                                                                                                          March 31
                                                                                                        2009           2008
In millions


                                                                                               $         318
Cash provided from operating activities                                                                         $          165
                                                                                                        (446)
Cash used by investing activities                                                                                      (166)
                                                                                                        (128)
Cash used before financing activities                                                                                       (1)


Adjustments:
                                                                                                          68
  Change in accounts receivable securitization                                                                             163
                                                                                                        (118)
  Dividends paid                                                                                                       (111)
                                                                                                         373
  Acquisition of EJ&E                                                                                                         -
  Effect of foreign exchange fluctuations on U.S. dollar-denominated
                                                                                                          12
    cash and cash equivalents                                                                                              10
                                                                                               $         207
Free cash flow                                                                                                  $          61


                                                                  20

More Related Content

What's hot

dover Q308_Supplement
dover Q308_Supplementdover Q308_Supplement
dover Q308_Supplementfinance30
 
DTE_3Q07_Supp
DTE_3Q07_SuppDTE_3Q07_Supp
DTE_3Q07_Suppfinance41
 
dover Q208_Supplement_r232g32g32g
dover Q208_Supplement_r232g32g32gdover Q208_Supplement_r232g32g32g
dover Q208_Supplement_r232g32g32gfinance30
 
energy east 2Q08_EAS_release
energy east 2Q08_EAS_releaseenergy east 2Q08_EAS_release
energy east 2Q08_EAS_releasefinance40
 
bnsf 1Q_2005_Investors_Report
bnsf 1Q_2005_Investors_Reportbnsf 1Q_2005_Investors_Report
bnsf 1Q_2005_Investors_Reportfinance16
 
vppg industries 2Q2008EARNINGSTABLESPDF
vppg industries 2Q2008EARNINGSTABLESPDFvppg industries 2Q2008EARNINGSTABLESPDF
vppg industries 2Q2008EARNINGSTABLESPDFfinance22
 
Big_Lots_AR2003FSO
Big_Lots_AR2003FSOBig_Lots_AR2003FSO
Big_Lots_AR2003FSOfinance50
 
conoco phillips 2005First Quarter
conoco phillips 2005First Quarterconoco phillips 2005First Quarter
conoco phillips 2005First Quarterfinance1
 
conoco phillips 2007Third Quarter
conoco phillips 2007Third Quarterconoco phillips 2007Third Quarter
conoco phillips 2007Third Quarterfinance1
 
ppg industries 2QEARNINGSTABLES
ppg industries 2QEARNINGSTABLESppg industries 2QEARNINGSTABLES
ppg industries 2QEARNINGSTABLESfinance22
 
Dole 99 annrpt
Dole 99 annrptDole 99 annrpt
Dole 99 annrptfinance32
 

What's hot (13)

dover Q308_Supplement
dover Q308_Supplementdover Q308_Supplement
dover Q308_Supplement
 
DTE_3Q07_Supp
DTE_3Q07_SuppDTE_3Q07_Supp
DTE_3Q07_Supp
 
dover Q208_Supplement_r232g32g32g
dover Q208_Supplement_r232g32g32gdover Q208_Supplement_r232g32g32g
dover Q208_Supplement_r232g32g32g
 
energy east 2Q08_EAS_release
energy east 2Q08_EAS_releaseenergy east 2Q08_EAS_release
energy east 2Q08_EAS_release
 
bnsf 1Q_2005_Investors_Report
bnsf 1Q_2005_Investors_Reportbnsf 1Q_2005_Investors_Report
bnsf 1Q_2005_Investors_Report
 
NOR2000AR
NOR2000ARNOR2000AR
NOR2000AR
 
Amd Q308 Financials
Amd Q308 FinancialsAmd Q308 Financials
Amd Q308 Financials
 
vppg industries 2Q2008EARNINGSTABLESPDF
vppg industries 2Q2008EARNINGSTABLESPDFvppg industries 2Q2008EARNINGSTABLESPDF
vppg industries 2Q2008EARNINGSTABLESPDF
 
Big_Lots_AR2003FSO
Big_Lots_AR2003FSOBig_Lots_AR2003FSO
Big_Lots_AR2003FSO
 
conoco phillips 2005First Quarter
conoco phillips 2005First Quarterconoco phillips 2005First Quarter
conoco phillips 2005First Quarter
 
conoco phillips 2007Third Quarter
conoco phillips 2007Third Quarterconoco phillips 2007Third Quarter
conoco phillips 2007Third Quarter
 
ppg industries 2QEARNINGSTABLES
ppg industries 2QEARNINGSTABLESppg industries 2QEARNINGSTABLES
ppg industries 2QEARNINGSTABLES
 
Dole 99 annrpt
Dole 99 annrptDole 99 annrpt
Dole 99 annrpt
 

Viewers also liked

Viewers also liked (7)

Q1 2009 Earning Report of Illinois Tool Works
Q1 2009 Earning Report of Illinois Tool WorksQ1 2009 Earning Report of Illinois Tool Works
Q1 2009 Earning Report of Illinois Tool Works
 
Q3 2009 Earning Report of Fastenal Company
Q3 2009 Earning Report of Fastenal CompanyQ3 2009 Earning Report of Fastenal Company
Q3 2009 Earning Report of Fastenal Company
 
Q3 2009 Earning Report of Genuine Parts Co.
Q3 2009 Earning Report of Genuine Parts Co.Q3 2009 Earning Report of Genuine Parts Co.
Q3 2009 Earning Report of Genuine Parts Co.
 
Q1 2009 Financial Report of BB&T Corp
Q1 2009 Financial Report of BB&T CorpQ1 2009 Financial Report of BB&T Corp
Q1 2009 Financial Report of BB&T Corp
 
Q1 2009 Earning Report of Boston Scientific
Q1 2009 Earning Report of Boston ScientificQ1 2009 Earning Report of Boston Scientific
Q1 2009 Earning Report of Boston Scientific
 
Q1 2009 Earning Report of Duke Realty Corp.
Q1 2009 Earning Report of Duke Realty Corp.Q1 2009 Earning Report of Duke Realty Corp.
Q1 2009 Earning Report of Duke Realty Corp.
 
Q3 2009 Earning Report of RPM International Inc.
Q3 2009 Earning Report of RPM International Inc.Q3 2009 Earning Report of RPM International Inc.
Q3 2009 Earning Report of RPM International Inc.
 

Similar to Q1 2009 Financial Report of Canadian National Railway Co

advanced micro devices Q108Financials
advanced micro devices Q108Financialsadvanced micro devices Q108Financials
advanced micro devices Q108Financialsfinance34
 
Q1 2009 Earning Report of Advanced Micro Devices
Q1 2009 Earning Report of Advanced Micro DevicesQ1 2009 Earning Report of Advanced Micro Devices
Q1 2009 Earning Report of Advanced Micro Devicesearningreport earningreport
 
07/30/03_Reg_G
07/30/03_Reg_G07/30/03_Reg_G
07/30/03_Reg_Gfinance21
 
Duke Energy Non GAAP-Q203
 Duke Energy Non GAAP-Q203 Duke Energy Non GAAP-Q203
Duke Energy Non GAAP-Q203finance21
 
advanced micro devices Q107Results
advanced micro devices Q107Resultsadvanced micro devices Q107Results
advanced micro devices Q107Resultsfinance34
 
ppg industries 1Q06EarningsTablesPDF
ppg industries 1Q06EarningsTablesPDFppg industries 1Q06EarningsTablesPDF
ppg industries 1Q06EarningsTablesPDFfinance22
 
spectra energy TETLPQ22008
spectra energy TETLPQ22008spectra energy TETLPQ22008
spectra energy TETLPQ22008finance49
 
advanced micro devices Q207Financials
advanced micro devices Q207Financialsadvanced micro devices Q207Financials
advanced micro devices Q207Financialsfinance34
 
advanced micro devices Q308Financials
advanced micro devices Q308Financialsadvanced micro devices Q308Financials
advanced micro devices Q308Financialsfinance34
 
el paso 22758BEF-CBE8-4368-BDC6-D02434EE5C13_EP_4Q08OpStatsFinal
el paso 22758BEF-CBE8-4368-BDC6-D02434EE5C13_EP_4Q08OpStatsFinalel paso 22758BEF-CBE8-4368-BDC6-D02434EE5C13_EP_4Q08OpStatsFinal
el paso 22758BEF-CBE8-4368-BDC6-D02434EE5C13_EP_4Q08OpStatsFinalfinance49
 
el paso 22758BEF-CBE8-4368-BDC6-D02434EE5C13_EP_4Q08OpStatsFinal
el paso 22758BEF-CBE8-4368-BDC6-D02434EE5C13_EP_4Q08OpStatsFinalel paso 22758BEF-CBE8-4368-BDC6-D02434EE5C13_EP_4Q08OpStatsFinal
el paso 22758BEF-CBE8-4368-BDC6-D02434EE5C13_EP_4Q08OpStatsFinalfinance49
 
22758BEF-CBE8-4368-BDC6-D02434EE5C13_EP_4Q08OpStatsFinal
22758BEF-CBE8-4368-BDC6-D02434EE5C13_EP_4Q08OpStatsFinal22758BEF-CBE8-4368-BDC6-D02434EE5C13_EP_4Q08OpStatsFinal
22758BEF-CBE8-4368-BDC6-D02434EE5C13_EP_4Q08OpStatsFinalfinance49
 
el paso 160DAEF8-9761-4AE9-925F-15301F29A4B9_2008_Summary_Report
el paso 160DAEF8-9761-4AE9-925F-15301F29A4B9_2008_Summary_Reportel paso 160DAEF8-9761-4AE9-925F-15301F29A4B9_2008_Summary_Report
el paso 160DAEF8-9761-4AE9-925F-15301F29A4B9_2008_Summary_Reportfinance49
 
el paso 160DAEF8-9761-4AE9-925F-15301F29A4B9_2008_Summary_Report
el paso 160DAEF8-9761-4AE9-925F-15301F29A4B9_2008_Summary_Reportel paso 160DAEF8-9761-4AE9-925F-15301F29A4B9_2008_Summary_Report
el paso 160DAEF8-9761-4AE9-925F-15301F29A4B9_2008_Summary_Reportfinance49
 
el paso 160DAEF8-9761-4AE9-925F-15301F29A4B9_2008_Summary_Report
el paso 160DAEF8-9761-4AE9-925F-15301F29A4B9_2008_Summary_Reportel paso 160DAEF8-9761-4AE9-925F-15301F29A4B9_2008_Summary_Report
el paso 160DAEF8-9761-4AE9-925F-15301F29A4B9_2008_Summary_Reportfinance49
 
4Q07EarningsReleaseTABLESPDF
4Q07EarningsReleaseTABLESPDF4Q07EarningsReleaseTABLESPDF
4Q07EarningsReleaseTABLESPDFfinance22
 
Q4 2003 Earnings Release Financial Tables
Q4 2003 Earnings Release Financial TablesQ4 2003 Earnings Release Financial Tables
Q4 2003 Earnings Release Financial Tablesfinance7
 

Similar to Q1 2009 Financial Report of Canadian National Railway Co (20)

advanced micro devices Q108Financials
advanced micro devices Q108Financialsadvanced micro devices Q108Financials
advanced micro devices Q108Financials
 
Q1 2009 Earning Report of Advanced Micro Devices
Q1 2009 Earning Report of Advanced Micro DevicesQ1 2009 Earning Report of Advanced Micro Devices
Q1 2009 Earning Report of Advanced Micro Devices
 
07/30/03_Reg_G
07/30/03_Reg_G07/30/03_Reg_G
07/30/03_Reg_G
 
Duke Energy Non GAAP-Q203
 Duke Energy Non GAAP-Q203 Duke Energy Non GAAP-Q203
Duke Energy Non GAAP-Q203
 
advanced micro devices Q107Results
advanced micro devices Q107Resultsadvanced micro devices Q107Results
advanced micro devices Q107Results
 
Amd Q107 Results
Amd Q107 ResultsAmd Q107 Results
Amd Q107 Results
 
ppg industries 1Q06EarningsTablesPDF
ppg industries 1Q06EarningsTablesPDFppg industries 1Q06EarningsTablesPDF
ppg industries 1Q06EarningsTablesPDF
 
spectra energy TETLPQ22008
spectra energy TETLPQ22008spectra energy TETLPQ22008
spectra energy TETLPQ22008
 
advanced micro devices Q207Financials
advanced micro devices Q207Financialsadvanced micro devices Q207Financials
advanced micro devices Q207Financials
 
Amd Q207 Financials
Amd Q207 FinancialsAmd Q207 Financials
Amd Q207 Financials
 
advanced micro devices Q308Financials
advanced micro devices Q308Financialsadvanced micro devices Q308Financials
advanced micro devices Q308Financials
 
el paso 22758BEF-CBE8-4368-BDC6-D02434EE5C13_EP_4Q08OpStatsFinal
el paso 22758BEF-CBE8-4368-BDC6-D02434EE5C13_EP_4Q08OpStatsFinalel paso 22758BEF-CBE8-4368-BDC6-D02434EE5C13_EP_4Q08OpStatsFinal
el paso 22758BEF-CBE8-4368-BDC6-D02434EE5C13_EP_4Q08OpStatsFinal
 
el paso 22758BEF-CBE8-4368-BDC6-D02434EE5C13_EP_4Q08OpStatsFinal
el paso 22758BEF-CBE8-4368-BDC6-D02434EE5C13_EP_4Q08OpStatsFinalel paso 22758BEF-CBE8-4368-BDC6-D02434EE5C13_EP_4Q08OpStatsFinal
el paso 22758BEF-CBE8-4368-BDC6-D02434EE5C13_EP_4Q08OpStatsFinal
 
22758BEF-CBE8-4368-BDC6-D02434EE5C13_EP_4Q08OpStatsFinal
22758BEF-CBE8-4368-BDC6-D02434EE5C13_EP_4Q08OpStatsFinal22758BEF-CBE8-4368-BDC6-D02434EE5C13_EP_4Q08OpStatsFinal
22758BEF-CBE8-4368-BDC6-D02434EE5C13_EP_4Q08OpStatsFinal
 
el paso 160DAEF8-9761-4AE9-925F-15301F29A4B9_2008_Summary_Report
el paso 160DAEF8-9761-4AE9-925F-15301F29A4B9_2008_Summary_Reportel paso 160DAEF8-9761-4AE9-925F-15301F29A4B9_2008_Summary_Report
el paso 160DAEF8-9761-4AE9-925F-15301F29A4B9_2008_Summary_Report
 
el paso 160DAEF8-9761-4AE9-925F-15301F29A4B9_2008_Summary_Report
el paso 160DAEF8-9761-4AE9-925F-15301F29A4B9_2008_Summary_Reportel paso 160DAEF8-9761-4AE9-925F-15301F29A4B9_2008_Summary_Report
el paso 160DAEF8-9761-4AE9-925F-15301F29A4B9_2008_Summary_Report
 
el paso 160DAEF8-9761-4AE9-925F-15301F29A4B9_2008_Summary_Report
el paso 160DAEF8-9761-4AE9-925F-15301F29A4B9_2008_Summary_Reportel paso 160DAEF8-9761-4AE9-925F-15301F29A4B9_2008_Summary_Report
el paso 160DAEF8-9761-4AE9-925F-15301F29A4B9_2008_Summary_Report
 
4Q07EarningsReleaseTABLESPDF
4Q07EarningsReleaseTABLESPDF4Q07EarningsReleaseTABLESPDF
4Q07EarningsReleaseTABLESPDF
 
Q4 2003 Earnings Release Financial Tables
Q4 2003 Earnings Release Financial TablesQ4 2003 Earnings Release Financial Tables
Q4 2003 Earnings Release Financial Tables
 
4Q05OpStats
4Q05OpStats4Q05OpStats
4Q05OpStats
 

More from earningreport earningreport

Q3 2009 Earning Report of Boston Scientific Corporation
Q3 2009 Earning Report of Boston Scientific CorporationQ3 2009 Earning Report of Boston Scientific Corporation
Q3 2009 Earning Report of Boston Scientific Corporationearningreport earningreport
 
Q3 2009 Earning Report of Boston Scientific Corporation
Q3 2009 Earning Report of Boston Scientific CorporationQ3 2009 Earning Report of Boston Scientific Corporation
Q3 2009 Earning Report of Boston Scientific Corporationearningreport earningreport
 
Q3 2009 Earning Report of Atheros Communications, Inc.
Q3 2009 Earning Report of Atheros Communications, Inc.Q3 2009 Earning Report of Atheros Communications, Inc.
Q3 2009 Earning Report of Atheros Communications, Inc.earningreport earningreport
 
Q3 2009 Earning Report of Hancock Holding Company
Q3 2009 Earning Report of Hancock Holding CompanyQ3 2009 Earning Report of Hancock Holding Company
Q3 2009 Earning Report of Hancock Holding Companyearningreport earningreport
 
Q3 2009 Earning Report of Infosys Technologies Ltd.
Q3 2009 Earning Report of Infosys Technologies Ltd.Q3 2009 Earning Report of Infosys Technologies Ltd.
Q3 2009 Earning Report of Infosys Technologies Ltd.earningreport earningreport
 
Q3 2009 Earning Report of Marriott International
Q3 2009 Earning Report of Marriott InternationalQ3 2009 Earning Report of Marriott International
Q3 2009 Earning Report of Marriott Internationalearningreport earningreport
 
Q3 2009 Earning Report of Worthington Industries, Inc.
Q3 2009 Earning Report of Worthington Industries, Inc.Q3 2009 Earning Report of Worthington Industries, Inc.
Q3 2009 Earning Report of Worthington Industries, Inc.earningreport earningreport
 

More from earningreport earningreport (20)

Q3 2009 Earning Report of Banco Santander S.A.
Q3 2009 Earning Report of Banco Santander S.A.Q3 2009 Earning Report of Banco Santander S.A.
Q3 2009 Earning Report of Banco Santander S.A.
 
Q3 Earning report of Daimler AG
Q3 Earning report of Daimler AGQ3 Earning report of Daimler AG
Q3 Earning report of Daimler AG
 
Q3 Earning Report of BB&T Corporation
Q3 Earning Report of BB&T CorporationQ3 Earning Report of BB&T Corporation
Q3 Earning Report of BB&T Corporation
 
Q3 Earning Report of BB&T Corporation
Q3 Earning Report of BB&T CorporationQ3 Earning Report of BB&T Corporation
Q3 Earning Report of BB&T Corporation
 
Q3 2009 Earning Report of Brown & Brown
Q3 2009 Earning Report of Brown & BrownQ3 2009 Earning Report of Brown & Brown
Q3 2009 Earning Report of Brown & Brown
 
Q3 2009 Earning Report of Boston Scientific Corporation
Q3 2009 Earning Report of Boston Scientific CorporationQ3 2009 Earning Report of Boston Scientific Corporation
Q3 2009 Earning Report of Boston Scientific Corporation
 
Q3 2009 Earning Report of Boston Scientific Corporation
Q3 2009 Earning Report of Boston Scientific CorporationQ3 2009 Earning Report of Boston Scientific Corporation
Q3 2009 Earning Report of Boston Scientific Corporation
 
Q3 2009 Earning Report of Atheros Communications, Inc.
Q3 2009 Earning Report of Atheros Communications, Inc.Q3 2009 Earning Report of Atheros Communications, Inc.
Q3 2009 Earning Report of Atheros Communications, Inc.
 
Q3 2009 Earning Report of Apple Inc.
Q3 2009 Earning Report of Apple Inc.Q3 2009 Earning Report of Apple Inc.
Q3 2009 Earning Report of Apple Inc.
 
Q3 2009 Earning Report of Hancock Holding Company
Q3 2009 Earning Report of Hancock Holding CompanyQ3 2009 Earning Report of Hancock Holding Company
Q3 2009 Earning Report of Hancock Holding Company
 
Q3 2009 Earning Report of Walgreen Co.
Q3 2009 Earning Report of Walgreen Co.Q3 2009 Earning Report of Walgreen Co.
Q3 2009 Earning Report of Walgreen Co.
 
Q3 2009 Earning Report of Infosys Technologies Ltd.
Q3 2009 Earning Report of Infosys Technologies Ltd.Q3 2009 Earning Report of Infosys Technologies Ltd.
Q3 2009 Earning Report of Infosys Technologies Ltd.
 
Q3 2009 Earning Report of Marriott International
Q3 2009 Earning Report of Marriott InternationalQ3 2009 Earning Report of Marriott International
Q3 2009 Earning Report of Marriott International
 
Q3 2009 Earning Report of PepsiCo.
Q3 2009 Earning Report of PepsiCo.Q3 2009 Earning Report of PepsiCo.
Q3 2009 Earning Report of PepsiCo.
 
Q3 2009 Earning Report of Alcoa, Inc.
Q3 2009 Earning Report of Alcoa, Inc.Q3 2009 Earning Report of Alcoa, Inc.
Q3 2009 Earning Report of Alcoa, Inc.
 
Q3 2009 Earning Report of Pepsi Bottling Group
Q3 2009 Earning Report of Pepsi Bottling GroupQ3 2009 Earning Report of Pepsi Bottling Group
Q3 2009 Earning Report of Pepsi Bottling Group
 
Q3 2009 Earning Report of Jean Coutu Group
Q3 2009 Earning Report of Jean Coutu GroupQ3 2009 Earning Report of Jean Coutu Group
Q3 2009 Earning Report of Jean Coutu Group
 
Q3 2009 Earning Report of Minerva plc
Q3 2009 Earning Report of Minerva plcQ3 2009 Earning Report of Minerva plc
Q3 2009 Earning Report of Minerva plc
 
Q3 2009 Earning Report of Worthington Industries, Inc.
Q3 2009 Earning Report of Worthington Industries, Inc.Q3 2009 Earning Report of Worthington Industries, Inc.
Q3 2009 Earning Report of Worthington Industries, Inc.
 
Q3 2009 Earning Report of Walgreen
Q3 2009 Earning Report of WalgreenQ3 2009 Earning Report of Walgreen
Q3 2009 Earning Report of Walgreen
 

Recently uploaded

Business Principles, Tools, and Techniques in Participating in Various Types...
Business Principles, Tools, and Techniques  in Participating in Various Types...Business Principles, Tools, and Techniques  in Participating in Various Types...
Business Principles, Tools, and Techniques in Participating in Various Types...jeffreytingson
 
Pension dashboards forum 1 May 2024 (1).pdf
Pension dashboards forum 1 May 2024 (1).pdfPension dashboards forum 1 May 2024 (1).pdf
Pension dashboards forum 1 May 2024 (1).pdfHenry Tapper
 
VIP Independent Call Girls in Bandra West 🌹 9920725232 ( Call Me ) Mumbai Esc...
VIP Independent Call Girls in Bandra West 🌹 9920725232 ( Call Me ) Mumbai Esc...VIP Independent Call Girls in Bandra West 🌹 9920725232 ( Call Me ) Mumbai Esc...
VIP Independent Call Girls in Bandra West 🌹 9920725232 ( Call Me ) Mumbai Esc...dipikadinghjn ( Why You Choose Us? ) Escorts
 
Vasai-Virar High Profile Model Call Girls📞9833754194-Nalasopara Satisfy Call ...
Vasai-Virar High Profile Model Call Girls📞9833754194-Nalasopara Satisfy Call ...Vasai-Virar High Profile Model Call Girls📞9833754194-Nalasopara Satisfy Call ...
Vasai-Virar High Profile Model Call Girls📞9833754194-Nalasopara Satisfy Call ...priyasharma62062
 
VIP Call Girl in Mumbai Central 💧 9920725232 ( Call Me ) Get A New Crush Ever...
VIP Call Girl in Mumbai Central 💧 9920725232 ( Call Me ) Get A New Crush Ever...VIP Call Girl in Mumbai Central 💧 9920725232 ( Call Me ) Get A New Crush Ever...
VIP Call Girl in Mumbai Central 💧 9920725232 ( Call Me ) Get A New Crush Ever...dipikadinghjn ( Why You Choose Us? ) Escorts
 
Technology industry / Finnish economic outlook
Technology industry / Finnish economic outlookTechnology industry / Finnish economic outlook
Technology industry / Finnish economic outlookTechFinland
 
20240419-SMC-submission-Annual-Superannuation-Performance-Test-–-design-optio...
20240419-SMC-submission-Annual-Superannuation-Performance-Test-–-design-optio...20240419-SMC-submission-Annual-Superannuation-Performance-Test-–-design-optio...
20240419-SMC-submission-Annual-Superannuation-Performance-Test-–-design-optio...Henry Tapper
 
VIP Call Girl in Mira Road 💧 9920725232 ( Call Me ) Get A New Crush Everyday ...
VIP Call Girl in Mira Road 💧 9920725232 ( Call Me ) Get A New Crush Everyday ...VIP Call Girl in Mira Road 💧 9920725232 ( Call Me ) Get A New Crush Everyday ...
VIP Call Girl in Mira Road 💧 9920725232 ( Call Me ) Get A New Crush Everyday ...dipikadinghjn ( Why You Choose Us? ) Escorts
 
falcon-invoice-discounting-unlocking-prime-investment-opportunities
falcon-invoice-discounting-unlocking-prime-investment-opportunitiesfalcon-invoice-discounting-unlocking-prime-investment-opportunities
falcon-invoice-discounting-unlocking-prime-investment-opportunitiesFalcon Invoice Discounting
 
Q1 2024 Conference Call Presentation vF.pdf
Q1 2024 Conference Call Presentation vF.pdfQ1 2024 Conference Call Presentation vF.pdf
Q1 2024 Conference Call Presentation vF.pdfAdnet Communications
 
Call Girls Koregaon Park Call Me 7737669865 Budget Friendly No Advance Booking
Call Girls Koregaon Park Call Me 7737669865 Budget Friendly No Advance BookingCall Girls Koregaon Park Call Me 7737669865 Budget Friendly No Advance Booking
Call Girls Koregaon Park Call Me 7737669865 Budget Friendly No Advance Bookingroncy bisnoi
 
CBD Belapur Expensive Housewife Call Girls Number-📞📞9833754194 No 1 Vipp HIgh...
CBD Belapur Expensive Housewife Call Girls Number-📞📞9833754194 No 1 Vipp HIgh...CBD Belapur Expensive Housewife Call Girls Number-📞📞9833754194 No 1 Vipp HIgh...
CBD Belapur Expensive Housewife Call Girls Number-📞📞9833754194 No 1 Vipp HIgh...priyasharma62062
 
Vasai-Virar Fantastic Call Girls-9833754194-Call Girls MUmbai
Vasai-Virar Fantastic Call Girls-9833754194-Call Girls MUmbaiVasai-Virar Fantastic Call Girls-9833754194-Call Girls MUmbai
Vasai-Virar Fantastic Call Girls-9833754194-Call Girls MUmbaipriyasharma62062
 
Diva-Thane European Call Girls Number-9833754194-Diva Busty Professional Call...
Diva-Thane European Call Girls Number-9833754194-Diva Busty Professional Call...Diva-Thane European Call Girls Number-9833754194-Diva Busty Professional Call...
Diva-Thane European Call Girls Number-9833754194-Diva Busty Professional Call...priyasharma62062
 
Vip Call US 📞 7738631006 ✅Call Girls In Sakinaka ( Mumbai )
Vip Call US 📞 7738631006 ✅Call Girls In Sakinaka ( Mumbai )Vip Call US 📞 7738631006 ✅Call Girls In Sakinaka ( Mumbai )
Vip Call US 📞 7738631006 ✅Call Girls In Sakinaka ( Mumbai )Pooja Nehwal
 
Webinar on E-Invoicing for Fintech Belgium
Webinar on E-Invoicing for Fintech BelgiumWebinar on E-Invoicing for Fintech Belgium
Webinar on E-Invoicing for Fintech BelgiumFinTech Belgium
 

Recently uploaded (20)

Business Principles, Tools, and Techniques in Participating in Various Types...
Business Principles, Tools, and Techniques  in Participating in Various Types...Business Principles, Tools, and Techniques  in Participating in Various Types...
Business Principles, Tools, and Techniques in Participating in Various Types...
 
Pension dashboards forum 1 May 2024 (1).pdf
Pension dashboards forum 1 May 2024 (1).pdfPension dashboards forum 1 May 2024 (1).pdf
Pension dashboards forum 1 May 2024 (1).pdf
 
VIP Independent Call Girls in Bandra West 🌹 9920725232 ( Call Me ) Mumbai Esc...
VIP Independent Call Girls in Bandra West 🌹 9920725232 ( Call Me ) Mumbai Esc...VIP Independent Call Girls in Bandra West 🌹 9920725232 ( Call Me ) Mumbai Esc...
VIP Independent Call Girls in Bandra West 🌹 9920725232 ( Call Me ) Mumbai Esc...
 
Vasai-Virar High Profile Model Call Girls📞9833754194-Nalasopara Satisfy Call ...
Vasai-Virar High Profile Model Call Girls📞9833754194-Nalasopara Satisfy Call ...Vasai-Virar High Profile Model Call Girls📞9833754194-Nalasopara Satisfy Call ...
Vasai-Virar High Profile Model Call Girls📞9833754194-Nalasopara Satisfy Call ...
 
VIP Call Girl in Mumbai Central 💧 9920725232 ( Call Me ) Get A New Crush Ever...
VIP Call Girl in Mumbai Central 💧 9920725232 ( Call Me ) Get A New Crush Ever...VIP Call Girl in Mumbai Central 💧 9920725232 ( Call Me ) Get A New Crush Ever...
VIP Call Girl in Mumbai Central 💧 9920725232 ( Call Me ) Get A New Crush Ever...
 
(INDIRA) Call Girl Srinagar Call Now 8617697112 Srinagar Escorts 24x7
(INDIRA) Call Girl Srinagar Call Now 8617697112 Srinagar Escorts 24x7(INDIRA) Call Girl Srinagar Call Now 8617697112 Srinagar Escorts 24x7
(INDIRA) Call Girl Srinagar Call Now 8617697112 Srinagar Escorts 24x7
 
(INDIRA) Call Girl Mumbai Call Now 8250077686 Mumbai Escorts 24x7
(INDIRA) Call Girl Mumbai Call Now 8250077686 Mumbai Escorts 24x7(INDIRA) Call Girl Mumbai Call Now 8250077686 Mumbai Escorts 24x7
(INDIRA) Call Girl Mumbai Call Now 8250077686 Mumbai Escorts 24x7
 
Technology industry / Finnish economic outlook
Technology industry / Finnish economic outlookTechnology industry / Finnish economic outlook
Technology industry / Finnish economic outlook
 
20240419-SMC-submission-Annual-Superannuation-Performance-Test-–-design-optio...
20240419-SMC-submission-Annual-Superannuation-Performance-Test-–-design-optio...20240419-SMC-submission-Annual-Superannuation-Performance-Test-–-design-optio...
20240419-SMC-submission-Annual-Superannuation-Performance-Test-–-design-optio...
 
VIP Call Girl in Mira Road 💧 9920725232 ( Call Me ) Get A New Crush Everyday ...
VIP Call Girl in Mira Road 💧 9920725232 ( Call Me ) Get A New Crush Everyday ...VIP Call Girl in Mira Road 💧 9920725232 ( Call Me ) Get A New Crush Everyday ...
VIP Call Girl in Mira Road 💧 9920725232 ( Call Me ) Get A New Crush Everyday ...
 
falcon-invoice-discounting-unlocking-prime-investment-opportunities
falcon-invoice-discounting-unlocking-prime-investment-opportunitiesfalcon-invoice-discounting-unlocking-prime-investment-opportunities
falcon-invoice-discounting-unlocking-prime-investment-opportunities
 
From Luxury Escort Service Kamathipura : 9352852248 Make on-demand Arrangemen...
From Luxury Escort Service Kamathipura : 9352852248 Make on-demand Arrangemen...From Luxury Escort Service Kamathipura : 9352852248 Make on-demand Arrangemen...
From Luxury Escort Service Kamathipura : 9352852248 Make on-demand Arrangemen...
 
Q1 2024 Conference Call Presentation vF.pdf
Q1 2024 Conference Call Presentation vF.pdfQ1 2024 Conference Call Presentation vF.pdf
Q1 2024 Conference Call Presentation vF.pdf
 
W.D. Gann Theory Complete Information.pdf
W.D. Gann Theory Complete Information.pdfW.D. Gann Theory Complete Information.pdf
W.D. Gann Theory Complete Information.pdf
 
Call Girls Koregaon Park Call Me 7737669865 Budget Friendly No Advance Booking
Call Girls Koregaon Park Call Me 7737669865 Budget Friendly No Advance BookingCall Girls Koregaon Park Call Me 7737669865 Budget Friendly No Advance Booking
Call Girls Koregaon Park Call Me 7737669865 Budget Friendly No Advance Booking
 
CBD Belapur Expensive Housewife Call Girls Number-📞📞9833754194 No 1 Vipp HIgh...
CBD Belapur Expensive Housewife Call Girls Number-📞📞9833754194 No 1 Vipp HIgh...CBD Belapur Expensive Housewife Call Girls Number-📞📞9833754194 No 1 Vipp HIgh...
CBD Belapur Expensive Housewife Call Girls Number-📞📞9833754194 No 1 Vipp HIgh...
 
Vasai-Virar Fantastic Call Girls-9833754194-Call Girls MUmbai
Vasai-Virar Fantastic Call Girls-9833754194-Call Girls MUmbaiVasai-Virar Fantastic Call Girls-9833754194-Call Girls MUmbai
Vasai-Virar Fantastic Call Girls-9833754194-Call Girls MUmbai
 
Diva-Thane European Call Girls Number-9833754194-Diva Busty Professional Call...
Diva-Thane European Call Girls Number-9833754194-Diva Busty Professional Call...Diva-Thane European Call Girls Number-9833754194-Diva Busty Professional Call...
Diva-Thane European Call Girls Number-9833754194-Diva Busty Professional Call...
 
Vip Call US 📞 7738631006 ✅Call Girls In Sakinaka ( Mumbai )
Vip Call US 📞 7738631006 ✅Call Girls In Sakinaka ( Mumbai )Vip Call US 📞 7738631006 ✅Call Girls In Sakinaka ( Mumbai )
Vip Call US 📞 7738631006 ✅Call Girls In Sakinaka ( Mumbai )
 
Webinar on E-Invoicing for Fintech Belgium
Webinar on E-Invoicing for Fintech BelgiumWebinar on E-Invoicing for Fintech Belgium
Webinar on E-Invoicing for Fintech Belgium
 

Q1 2009 Financial Report of Canadian National Railway Co

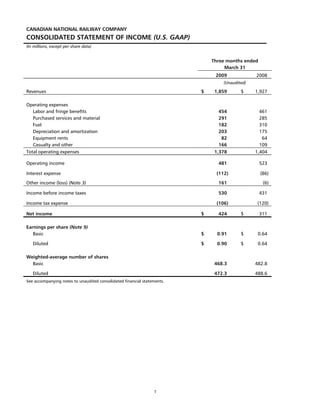
  • 1. CANADIAN NATIONAL RAILWAY COMPANY CONSOLIDATED STATEMENT OF INCOME (U.S. GAAP) (In millions, except per share data) Three months ended March 31 2009 2008 (Unaudited) $ 1,859 Revenues $ 1,927 Operating expenses 454 Labor and fringe benefits 461 291 Purchased services and material 285 182 Fuel 310 203 Depreciation and amortization 175 82 Equipment rents 64 166 Casualty and other 109 1,378 Total operating expenses 1,404 481 Operating income 523 (112) Interest expense (86) 161 (6) Other income (loss) (Note 3) 530 Income before income taxes 431 (106) Income tax expense (120) Net income $ 424 $ 311 Earnings per share (Note 9) $ 0.91 Basic $ 0.64 $ 0.90 Diluted $ 0.64 Weighted-average number of shares 468.3 Basic 482.8 472.3 Diluted 488.6 See accompanying notes to unaudited consolidated financial statements. 1
  • 2. CANADIAN NATIONAL RAILWAY COMPANY CONSOLIDATED BALANCE SHEET (U.S. GAAP) (In millions) March 31 December 31 March 31 2009 2008 2008 (Unaudited) (Unaudited) Assets Current assets: $ 349 Cash and cash equivalents $ 413 $ 334 940 913 621 Accounts receivable (Note 4) 273 Material and supplies 200 212 77 Deferred income taxes 98 67 138 Other 132 111 1,777 1,756 1,345 23,947 Properties 23,203 20,754 1,787 Intangible and other assets 1,761 2,065 Total assets $ 27,511 $ 26,720 $ 24,164 Liabilities and shareholders' equity Current liabilities: $ 1,280 Accounts payable and other $ 1,386 $ 1,333 527 506 269 Current portion of long-term debt (Note 4) 1,807 1,892 1,602 5,594 Deferred income taxes 5,511 5,021 1,371 Other liabilities and deferred credits 1,353 1,404 7,836 7,405 6,064 Long-term debt (Note 4) Shareholders' equity: 4,188 Common shares 4,179 4,241 (126) Accumulated other comprehensive income (loss) (155) 9 6,841 Retained earnings 6,535 5,823 10,903 10,559 10,073 Total liabilities and shareholders' equity $ 27,511 $ 26,720 $ 24,164 See accompanying notes to unaudited consolidated financial statements. 2
  • 3. CANADIAN NATIONAL RAILWAY COMPANY CONSOLIDATED STATEMENT OF CHANGES IN SHAREHOLDERS’ EQUITY (U.S. GAAP) (In millions) Three months ended March 31 2009 2008 (Unaudited) Common shares (1) $ 4,179 Balance, beginning of period $ 4,283 9 Stock options exercised and other 23 - (65) Share repurchase programs (Note 4) $ 4,188 Balance, end of period $ 4,241 Accumulated other comprehensive income (loss) $ (155) Balance, beginning of period $ (31) Other comprehensive income (loss): Unrealized foreign exchange gain (loss) on: 251 Translation of the net investment in foreign operations 187 Translation of U.S. dollar-denominated long-term debt (258) designated as a hedge of the net investment in U.S. subsidiaries (182) Pension and other postretirement benefit plans: Amortization of net actuarial gain included in net - periodic benefit cost (1) Amortization of prior service cost included in net 1 periodic benefit cost 6 (6) Other comprehensive income (loss) before income taxes 10 35 Income tax recovery 30 29 Other comprehensive income 40 $ (126) Balance, end of period $ 9 Retained earnings $ 6,535 Balance, beginning of period $ 5,925 424 Net income 311 - Share repurchase programs (302) (118) Dividends (111) $ 6,841 Balance, end of period $ 5,823 See accompanying notes to unaudited consolidated financial statements. (1) During the three months ended March 31, 2009, the Company issued 0.2 million common shares as a result of stock options exercised. At March 31, 2009, the Company had 468.4 million common shares outstanding. 3
  • 4. CANADIAN NATIONAL RAILWAY COMPANY CONSOLIDATED STATEMENT OF CASH FLOWS (U.S. GAAP) (In millions) Three months ended March 31 2009 2008 (Unaudited) Operating activities $ 424 Net income $ 311 Adjustments to reconcile net income to net cash provided from operating activities: 203 Depreciation and amortization 175 10 Deferred income taxes 25 (157) Gain on disposal of property (Note 3) - Other changes in: 1 Accounts receivable (235) (53) Material and supplies (48) (132) Accounts payable and other (59) 36 Other current assets 29 (14) Other (33) 318 Cash provided from operating activities 165 Investing activities (187) Property additions (177) (373) - Acquisitions, net of cash acquired (Note 3) 110 - Disposal of property (Note 3) 4 Other, net 11 (446) Cash used by investing activities (166) Financing activities 1,440 Issuance of long-term debt 1,055 (1,272) Reduction of long-term debt (580) Issuance of common shares due to exercise of stock options and 2 related excess tax benefits realized 18 - Repurchase of common shares (367) (118) Dividends paid (111) 52 Cash provided from financing activities 15 Effect of foreign exchange fluctuations on U.S. dollar- 12 denominated cash and cash equivalents 10 Net increase (decrease) in cash and cash equivalents (64) 24 413 Cash and cash equivalents, beginning of period 310 Cash and cash equivalents, end of period $ 349 $ 334 Supplemental cash flow information $ 1,904 Net cash receipts from customers and other $ 1,748 Net cash payments for: (1,362) Employee services, suppliers and other expenses (1,339) (106) Interest (100) (4) Workforce reductions (6) (30) Personal injury and other claims (26) - Pensions (22) (84) Income taxes (90) $ 318 Cash provided from operating activities $ 165 See accompanying notes to unaudited consolidated financial statements. 4
  • 5. CANADIAN NATIONAL RAILWAY COMPANY NOTES TO UNAUDITED CONSOLIDATED FINANCIAL STATEMENTS (U.S. GAAP) Note 1 - Basis of presentation In management’s opinion, the accompanying unaudited Interim Consolidated Financial Statements and Notes thereto, expressed in Canadian dollars, and prepared in accordance with U.S. generally accepted accounting principles (U.S. GAAP) for interim financial statements, contain all adjustments (consisting of normal recurring accruals) necessary to present fairly Canadian National Railway Company’s (the Company) financial position as at March 31, 2009, December 31, 2008, and March 31, 2008, and its results of operations, changes in shareholders’ equity and cash flows for the three months ended March 31, 2009 and 2008. These unaudited Interim Consolidated Financial Statements and Notes thereto have been prepared using accounting policies consistent with those used in preparing the Company’s 2008 Annual Consolidated Financial Statements, except as disclosed in Note 2 – Accounting change. While management believes that the disclosures presented are adequate to make the information not misleading, these unaudited Interim Consolidated Financial Statements and Notes thereto should be read in conjunction with the Company’s Interim Management’s Discussion and Analysis (MD&A) and Annual Consolidated Financial Statements and Notes thereto. Note 2 – Accounting change On January 1, 2009, the Company adopted Statement of Financial Accounting Standards (SFAS) No. 141 (R), “Business Combinations,” which became effective for acquisitions with an acquisition date on or after the beginning of the first annual reporting period beginning on or after December 15, 2008. Until December 31, 2008, the Company was subject to the requirements of SFAS No. 141, “Business Combinations,” which required that acquisition-related costs be included as part of the purchase cost of an acquired business. As such, the Company had reported acquisition-related costs in Other current assets pending the closing of its acquisition of the Elgin, Joliet and Eastern Railway Company (EJ&E), which had been subject to an extensive U.S. Surface Transportation Board (STB) approval process. On January 31, 2009, the Company completed its acquisition of the EJ&E and accounted for the acquisition under SFAS No. 141 (R). The acquisition-related costs incurred to acquire the EJ&E of approximately $46 million, including costs to obtain regulatory approval, were expensed and reported in Casualty and other in the Consolidated Statement of Income for the three months ended March 31, 2009 pursuant to SFAS No. 141 (R) requirements. This change in accounting policy had the effect of decreasing net income by $28 million ($0.06 per basic or diluted earnings per share) and Other current assets by $46 million. This change had no effect on the Consolidated Statement of Cash Flows. Disclosures prescribed by SFAS No. 141 (R) are presented in Note 3 – Acquisition and disposal of property. Note 3 - Acquisition and disposal of property Acquisition of Elgin, Joliet and Eastern Railway Company On January 31, 2009, the Company acquired the principal rail lines of the EJ&E for a total cash consideration of U.S.$300 million (Cdn$373 million), paid with cash on hand. The EJ&E is a short-line railway previously owned by U.S. Steel Corporation (U.S. Steel) that operates over 198 miles of track and serves steel mills, petrochemical customers, utility plants and distribution centers in Illinois and Indiana, as well as connects with all the major railroads entering Chicago. Under the terms of the acquisition agreement, the Company acquired substantially all of the railroad operations of EJ&E, except those that support the Gary Works site in northwest Indiana and the steelmaking operations of U.S. Steel. The acquisition is expected to drive new efficiencies and operating improvements on CN’s network as a result of streamlined rail operations and reduced congestion in the Chicago area. The Company and EJ&E had entered into the acquisition agreement on September 25, 2007, and the Company had filed an application for authorization of the transaction with the STB on October 30, 2007. Following an extensive regulatory approval process, which included an Environmental Impact Statement (EIS) that resulted in conditions imposed to mitigate municipalities’ concerns regarding increased rail activity expected along the EJ&E line, the STB approved the transaction on December 24, 2008. Over the next few years, the Company has committed to spend approximately U.S.$100 million for railroad infrastructure improvements and over U.S.$60 million under a series of agreements with individual communities, a comprehensive voluntary 5
  • 6. CANADIAN NATIONAL RAILWAY COMPANY NOTES TO UNAUDITED CONSOLIDATED FINANCIAL STATEMENTS (U.S. GAAP) mitigation program that addresses municipalities’ concerns, and additional STB-imposed conditions that the Company has accepted with one exception. The Company has filed an appeal challenging the STB's condition requiring the installation of grade separations at two locations along the EJ&E at Company funding levels significantly beyond prior STB practice. Although the STB granted the Company’s application to acquire control of the EJ&E on December 24, 2008, challenges have since been made by certain communities as to the sufficiency of the STB’s EIS which, if successful, could result in reconsideration of the STB’s decision or further consideration of the environmental impact of the transaction. The Company strongly disputes the merit of these challenges, and has intervened in support of the STB’s defense against them. The final outcome of such challenges cannot be predicted with certainty, and therefore, there can be no assurance that their resolution will not have a material adverse effect on the Company’s financial position or results of operations. The Company has accounted for the acquisition using the purchase method of accounting pursuant to SFAS No. 141 (R), “Business Combinations,” which the Company adopted on January 1, 2009. As such, the consolidated financial statements of the Company include the assets, liabilities and results of operations of EJ&E as of January 31, 2009, the date of acquisition. The costs incurred to acquire the EJ&E of approximately $46 million were expensed and reported in Casualty and other in the Consolidated Statement of Income for the three-months ended March 31, 2009 (see Note 2 - Accounting change). The following table summarizes the consideration paid for EJ&E and the estimated fair value of the assets acquired and liabilities assumed that were recognized at the acquisition date. The Company has not finalized its valuation of such assets and liabilities. As such, the fair value is subject to change, although no material change is anticipated. At January 31, 2009 (In U.S. millions) Consideration Cash $ 300 Fair value of total consideration transferred $ 300 Recognized amounts of identifiable assets acquired and liabilities assumed Current assets $ 6 Other long-term assets 4 Property, plant and equipment 304 Current liabilities (4) Other long-term liabilities (10) Total identifiable net assets $ 300 The amount of revenues and net income of EJ&E included in the Company’s Consolidated Statement of Income from the acquisition date to March 31, 2009, were $14 million and $3 million, respectively. The Company has not provided supplemental pro forma information relating to the pre-acquisition period as it was not considered material to the results of operations of the Company. Disposal of Weston subdivision In March 2009, the Company entered into an agreement with GO Transit to sell the property known as the Weston subdivision in Toronto, Ontario, together with the rail fixtures and certain passenger agreements (collectively the “Rail Property”), for cash proceeds of $110 million before transaction costs, with a balance on sale of about $50 million to be placed in escrow on the Company’s behalf and released in accordance with the terms of the agreement but no later than December 31, 2009. Under the agreement, the Company obtained the perpetual right to operate freight trains over the Rail Property at the current level of operating activity. The transaction resulted in a gain on disposition of $157 million ($135 million after-tax), including amounts related to the real estate as well as the retention of trackage and other rights. The Company accounted for the transaction in Other income (loss) under the full accrual method of accounting for real estate transactions. 6
  • 7. CANADIAN NATIONAL RAILWAY COMPANY NOTES TO UNAUDITED CONSOLIDATED FINANCIAL STATEMENTS (U.S. GAAP) Note 4 - Financing activities Shelf prospectus and registration statement In February 2009, the Company issued U.S.$550 million (Cdn$684 million) of 5.55% Notes due 2019. The debt offering was made under the Company’s currently effective shelf prospectus and registration statement, filed by the Company in December 2007. Accordingly, the amount registered for offering under the shelf prospectus and registration statement has been reduced to U.S.$1.3 billion. The Company used the net proceeds of U.S.$540 million (Cdn$672 million) from the offering to repay a portion of its outstanding commercial paper and to reduce a portion of its accounts receivable securitization program. Revolving credit facility As at March 31, 2009, the Company had letters of credit drawn on its U.S.$1 billion revolving credit facility, expiring in October 2011, of $193 million ($181 million as at December 31, 2008). The Company also had total borrowings under its commercial paper program of $166 million, of which $155 million was denominated in Canadian dollars and $11 million was denominated in U.S. dollars (U.S.$9 million). The weighted-average interest rate on these borrowings was 1.24%. As at December 31, 2008, total borrowings under the Company’s commercial paper program were $626 million, of which $256 million was denominated in Canadian dollars and $370 million was denominated in U.S. dollars (U.S.$303 million). The weighted-average interest rate on these borrowings was 2.42%. Accounts receivable securitization The Company has a five-year agreement, expiring in May 2011, to sell an undivided co-ownership interest for maximum cash proceeds of $600 million in a revolving pool of freight receivables to an unrelated trust. Pursuant to the agreement, the Company sells an interest in its receivables and receives proceeds net of the required reserve as stipulated in the agreement. The required reserve represents an amount set aside to allow for possible credit losses and is recognized by the Company as retained interest and recorded in Other current assets in its Consolidated Balance Sheet. The eligible freight receivables as defined in the agreement may not include delinquent or defaulted receivables, or receivables that do not meet certain obligor-specific criteria, including concentrations in excess of prescribed limits with any one customer. During the first quarter of 2009, proceeds from collections reinvested in the securitization program were approximately $132 million and purchases of previously transferred accounts receivable were approximately $4 million. At March 31, 2009, the servicing asset and liability were not significant. Subject to customary indemnifications, the trust’s recourse is generally limited to the receivables. As at March 31, 2009, the Company had sold receivables that resulted in proceeds of $2 million under this program ($71 million at December 31, 2008), and recorded retained interest of approximately 10% of this amount in Other current assets (retained interest of approximately 10% recorded as at December 31, 2008). The fair value of the retained interest approximated carrying value as a result of the short collection cycle and negligible credit losses. Share repurchase program During the first quarter of 2009, the Company did not repurchase any common shares under its current 25.0 million share repurchase program. The Company has repurchased a total of 6.1 million common shares since July 2008, the inception of the program, for $331 million, at a weighted-average price of $54.42 per share. 7
  • 8. CANADIAN NATIONAL RAILWAY COMPANY NOTES TO UNAUDITED CONSOLIDATED FINANCIAL STATEMENTS (U.S. GAAP) Note 5 - Stock plans The Company has various stock-based incentive plans for eligible employees. A description of the plans is provided in Note 11 – Stock plans, to the Company’s 2008 Annual Consolidated Financial Statements. For the three months ended March 31, 2009 and 2008, the Company recorded total compensation expense for awards under all plans of $15 million and $28 million, respectively. The total tax benefit recognized in income in relation to stock-based compensation expense for the three months ended March 31, 2009 and 2008 was $4 million and $7 million, respectively. Cash settled awards Following approval by the Board of Directors in January 2009, the Company granted 0.8 million restricted share units (RSUs) to designated management employees entitling them to receive payout in cash based on the Company’s share price. The RSUs granted by the Company are generally scheduled for payout in cash after three years (“plan period”) and vest conditionally upon the attainment of a target relating to return on invested capital over the plan period. Payout is conditional upon the attainment of a minimum share price calculated using the average of the last three months of the plan period. As at March 31, 2009, 0.2 million RSUs remained authorized for future issuance under this plan. The following table provides the 2009 activity for all cash settled awards: Voluntary Incentive RSUs Deferral Plan (VIDP) Nonvested Vested Nonvested Vested In millions 0.9 (1) Outstanding at December 31, 2008 1.3 0.1 1.8 Granted 0.8 - - - Transferred into plan - - - 0.1 Payout - (0.9) - (0.1) 2.1 - 0.1 1.8 Outstanding at March 31, 2009 (1) Includes 0.1 million of 2004 time-vested RSUs. 8
  • 9. CANADIAN NATIONAL RAILWAY COMPANY NOTES TO UNAUDITED CONSOLIDATED FINANCIAL STATEMENTS (U.S. GAAP) The following table provides valuation and expense information for all cash settled awards: RSUs (1) Vision (1) VIDP (2) Total In millions, unless otherwise indicated 2003 Year of grant 2009 2008 2007 2006 2004 2005 onwards Stock-based compensation expense (recovery) recognized over requisite service period Three months ended March 31, 2009 $ 9$ 1 $ - $ (2) N/A N/A $ - $ 8 Three months ended March 31, 2008 N/A $ 7 $ 2 $ 4 $ 1 $ 3 $ 6 $ 23 Liability outstanding March 31, 2009 $ 9$ 9 $ 9 $ - $ - N/A $ 88 $ 115 December 31, 2008 N/A $ 8 $ 9 $ 53 $ 3 $ - $ 88 $ 161 Fair value per unit March 31, 2009 ($) $ 25.44 $ 21.20 $ 16.61 N/A N/A N/A $ 45.20 N/A Fair value of awards vested during period Three months ended March 31, 2009 $ -$ - $ - N/A N/A N/A $ 1 $ 1 Three months ended March 31, 2008 N/A $ - $ - $ - $ - $ - $ 1 $ 1 Nonvested awards at March 31, 2009 Unrecognized compensation cost $ 10 $ 4 $ 2 N/A N/A N/A $ 3 $ 19 Remaining recognition period (years) 2.75 1.75 0.75 N/A N/A N/A 3.75 N/A Assumptions (3) Stock price ($) $ 45.20 $ 45.20 $ 45.20 N/A N/A N/A $ 45.20 N/A (4) Expected stock price volatility 29% 32% 37% N/A N/A N/A N/A N/A Expected term (years) (5) 2.75 1.75 0.75 N/A N/A N/A N/A N/A Risk-free interest rate (6) 1.28% 0.95% 0.53% N/A N/A N/A N/A N/A Dividend rate ($) (7) $ 1.01 $ 1.01 $ 1.01 N/A N/A N/A N/A N/A (1) Compensation cost is based on the fair value of the awards at period-end using the lattice-based valuation model that uses the assumptions as presented herein. (2) Compensation cost is based on intrinsic value. (3) Assumptions used to determine fair value are at March 31, 2009. (4) Based on the historical volatility of the Company's stock over a period commensurate with the expected term of the award. (5) Represents the remaining period of time that awards are expected to be outstanding. (6) Based on the implied yield available on zero-coupon government issues with an equivalent term commensurate with the expected term of the awards. (7) Based on the annualized dividend rate. Stock option awards Following approval by the Board of Directors in January 2009, the Company granted 1.2 million conventional stock options to designated senior management employees. The stock option plan allows eligible employees to acquire common shares of the Company upon vesting at a price equal to the market value of the common shares at the date of grant. The options are exercisable during a period not exceeding 10 years. The right to exercise options generally accrues over a period of four years of continuous employment. Options are not generally exercisable during the first 12 months after the date of grant. At March 31, 2009, 12.3 million common shares remained authorized for future issuances under this plan. The total number of options outstanding at March 31, 2009, including conventional, performance and performance-accelerated options, was 10.9 million, 0.1 million and 3.2 million, respectively. 9
  • 10. CANADIAN NATIONAL RAILWAY COMPANY NOTES TO UNAUDITED CONSOLIDATED FINANCIAL STATEMENTS (U.S. GAAP) The following table provides the activity of stock option awards in 2009. The table also provides the aggregate intrinsic value for in-the-money stock options, which represents the amount that would have been received by option holders had they exercised their options on March 31, 2009 at the Company’s closing stock price of $45.20. Options outstanding Weighted- Number average Weighted-average Aggregate of options exercise price years to expiration intrinsic value In millions In millions Outstanding at December 31, 2008(1) 13.2 $ 29.05 Granted 1.2 $ 41.92 Exercised (0.2) $ 16.45 Outstanding at March 31, 2009 (1) 14.2 $ 30.67 4.6 $ 233 (1) 11.6 $ 26.51 3.7 $ 230 Exercisable at March 31, 2009 (1) Stock options with a U.S. dollar exercise price have been translated to Canadian dollars using the foreign exchange rate in effect at the balance sheet date. 10
  • 11. CANADIAN NATIONAL RAILWAY COMPANY NOTES TO UNAUDITED CONSOLIDATED FINANCIAL STATEMENTS (U.S. GAAP) The following table provides valuation and expense information for all stock option awards: In millions, unless otherwise indicated Year of grant 2009 2008 2007 2006 2005 Total Stock-based compensation expense recognized over requisite service period (1) Three months ended March 31, 2009 $ 5 $ - $ 1 $ 1 $ - $ 7 Three months ended March 31, 2008 N/A $ 3 $ 1 $ - $ 1 $ 5 Fair value per unit At grant date ($) $ 12.51 $ 12.44 $ 13.36 $ 13.80 $ 9.19 N/A Fair value of awards vested during period Three months ended March 31, 2009 $ - $ 3 $ 3 $ 3 $ 3 $ 12 Three months ended March 31, 2008 N/A $ - $ 3 $ 3 $ 3 $ 9 Nonvested awards at March 31, 2009 Unrecognized compensation cost $ 9 $ 4 $ 2 $ 1 $ - $ 16 Remaining recognition period (years) 3.8 2.8 1.8 0.8 - N/A Assumptions Grant price ($) $ 41.92 $ 48.51 $ 52.79 $ 51.51 $ 36.33 N/A (2) Expected stock price volatility 39% 27% 24% 25% 25% N/A Expected term (years) (3) 5.3 5.3 5.2 5.2 5.2 N/A (4) Risk-free interest rate 1.95% 3.58% 4.12% 4.04% 3.50% N/A Dividend rate ($) (5) $ 1.01 $ 0.92 $ 0.84 $ 0.65 $ 0.50 N/A (1) Compensation cost is based on the grant date fair value using the Black-Scholes option-pricing model that uses the assumptions at the grant date. (2) Based on the average of the historical volatility of the Company's stock over a period commensurate with the expected term of the award and the implied volatility from traded options on the Company's stock. (3) Represents the period of time that awards are expected to be outstanding. The Company uses historical data to estimate option exercise and employee termination, and groups of employees that have similar historical exercise behavior are considered separately. (4) Based on the implied yield available on zero-coupon government issues with an equivalent term commensurate with the expected term of the awards. (5) Based on the annualized dividend rate. 11
  • 12. CANADIAN NATIONAL RAILWAY COMPANY NOTES TO UNAUDITED CONSOLIDATED FINANCIAL STATEMENTS (U.S. GAAP) Note 6 - Pensions and other postretirement benefits For the three months ended March 31, 2009 and 2008, the components of net periodic benefit cost (income) for pensions and other postretirement benefits were as follows: (a) Components of net periodic benefit income for pensions Three months ended March 31 2009 2008 In millions $ 22 Service cost $ 35 222 Interest cost 200 (252) Expected return on plan assets (251) - Amortization of prior service cost 5 1 Recognized net actuarial loss - $ (7) $ (11) Net periodic benefit income (b) Components of net periodic benefit cost for other postretirement benefits Three months ended March 31 2009 2008 In millions $ 1 Service cost $ 1 4 Interest cost 4 (3) Curtailment gain (2) 1 Amortization of prior service cost 1 (1) Recognized net actuarial gain (1) $ 2 $ 3 Net periodic benefit cost In 2009, the Company expects to make total contributions of approximately $130 million for all its defined benefit plans. Note 7 – Income taxes In the first quarter of 2009, the Company recorded a deferred income tax recovery of $15 million in the Consolidated Statement of Income resulting from the enactment of lower provincial corporate income tax rates. In the first quarter of 2008, the Company recorded a deferred income tax recovery of $11 million in the Consolidated Statement of Income that resulted from net capital losses arising from the reorganization of a subsidiary. 12
  • 13. CANADIAN NATIONAL RAILWAY COMPANY NOTES TO UNAUDITED CONSOLIDATED FINANCIAL STATEMENTS (U.S. GAAP) Note 8 - Major commitments and contingencies A. Commitments As at March 31, 2009, the Company had commitments to acquire railroad ties, rail, freight cars, locomotives, and other equipment and services, as well as outstanding information technology service contracts and licenses, at an aggregate cost of $917 million ($1,006 million at December 31, 2008). The Company also has agreements with fuel suppliers to purchase approximately 85% of the estimated remaining 2009 volume, 50% of its anticipated 2010 volume, and 18% of its anticipated 2011 volume, at market prices prevailing on the date of the purchase. B. Contingencies The Company becomes involved, from time to time, in various legal actions, including actions brought on behalf of various purported classes of claimants and claims relating to personal injuries, occupational disease, and property damage, arising out of harm to individuals or property allegedly caused by derailments or other accidents. Canada Employee injuries are governed by the workers’ compensation legislation in each province whereby employees may be awarded either a lump sum or future stream of payments depending on the nature and severity of the injury. Accordingly, the Company accounts for costs related to employee work-related injuries based on actuarially developed estimates of the ultimate cost associated with such injuries, including compensation, health care and third-party administration costs. For all other legal actions, the Company maintains, and regularly updates on a case-by-case basis, provisions for such items when the expected loss is both probable and can be reasonably estimated based on currently available information. United States Employee work-related injuries, including occupational disease claims, are compensated according to the provisions of the Federal Employers’ Liability Act (FELA), which requires either the finding of fault through the U.S. jury system or individual settlements, and represent a major liability for the railroad industry. With limited exceptions where claims are evaluated on a case-by-case basis, the Company follows an actuarial-based approach and accrues the expected cost for personal injury and property damage claims and asserted and unasserted occupational disease claims, based on actuarial estimates of their ultimate cost. A comprehensive actuarial study is conducted on an annual basis, in the fourth quarter, by an independent actuarial firm for occupational disease claims and non-occupational disease claims. On an ongoing basis, management reviews and compares the assumptions inherent in the latest actuarial study with the current claim experience and, if required, adjustments to the liability are recorded. As at March 31, 2009, the Company had aggregate reserves for personal injury and other claims of $461 million, of which $121 million was recorded as a current liability ($454 million, of which $118 million was recorded as a current liability at December 31, 2008). Although the Company considers such provisions to be adequate for all its outstanding and pending claims, the final outcome with respect to actions outstanding or pending at March 31, 2009, or with respect to future claims, cannot be predicted with certainty, and therefore there can be no assurance that their resolution will not have a material adverse effect on the Company’s results of operations, financial position or liquidity in a particular quarter or fiscal year. C. Environmental matters The Company’s operations are subject to numerous federal, provincial, state, municipal and local environmental laws and regulations in Canada and the United States concerning, among other things, emissions into the air; discharges into waters; the generation, handling, storage, transportation, treatment and disposal of waste, hazardous substances, and other materials; decommissioning of underground and aboveground storage tanks; and soil and groundwater contamination. A risk of environmental liability is inherent in railroad and related transportation operations; real estate ownership, operation or control; and other commercial activities of the Company with respect to both current and past operations. 13
  • 14. CANADIAN NATIONAL RAILWAY COMPANY NOTES TO UNAUDITED CONSOLIDATED FINANCIAL STATEMENTS (U.S. GAAP) Known existing environmental concerns The Company has identified approximately 340 sites at which it is or may be liable for remediation costs, in some cases along with other potentially responsible parties, associated with alleged contamination and is subject to environmental clean-up and enforcement actions, including those imposed by the United States Federal Comprehensive Environmental Response, Compensation and Liability Act of 1980 (CERCLA), also known as the Superfund law, or analogous state laws. CERCLA and similar state laws, in addition to other similar Canadian and U.S. laws generally impose joint and several liability for clean-up and enforcement costs on current and former owners and operators of a site, as well as those whose waste is disposed of at the site, without regard to fault or the legality of the original conduct. The Company has been notified that it is a potentially responsible party for study and clean-up costs at approximately 10 sites governed by the Superfund law (and analogous state laws) for which investigation and remediation payments are or will be made or are yet to be determined and, in many instances, is one of several potentially responsible parties. The ultimate cost of addressing these known contaminated sites cannot be definitely established given that the estimated environmental liability for any given site may vary depending on the nature and extent of the contamination, the available clean-up techniques, the Company’s share of the costs and evolving regulatory standards governing environmental liability. As a result, a liability is initially recorded when environmental assessments occur and/or remedial efforts are probable, and when the costs, based on a specific plan of action in terms of the technology to be used and the extent of the corrective action required, can be reasonably estimated. Adjustments to initial estimates are recorded as additional information becomes available. The Company’s provision for specific environmental sites is undiscounted, is recorded net of potential and actual insurance recoveries, and includes costs for remediation and restoration of sites, as well as significant monitoring costs. Environmental accruals, which are classified as Casualty and other in the Consolidated Statement of Income, include amounts for newly identified sites or contaminants as well as adjustments to initial estimates. As at March 31, 2009, the Company had aggregate accruals for environmental costs of $125 million, of which $32 million was recorded as a current liability ($125 million, of which $30 million was recorded as a current liability as at December 31, 2008). Based on the information currently available, the Company considers its provisions to be adequate. Unknown existing environmental concerns While the Company believes that it has identified the costs likely to be incurred for environmental matters in the next several years, based on known information, newly discovered facts, changes in law, the possibility of spills and releases of hazardous materials into the environment and the Company’s ongoing efforts to identify potential environment liabilities that may be associated with its properties may lead to future environmental investigations, which may result in the identification of additional environmental costs and liabilities and related costs. The magnitude of such additional liabilities and the costs of complying with future environmental laws and containing or remediating contamination cannot be reasonably estimated due to many factors including: (i) the lack of specific technical information available with respect to many sites; (ii) the absence of any government authority, third-party orders, or claims with respect to particular sites; (iii) the potential for new or changed laws and regulations and for development of new remediation technologies and uncertainty regarding the timing of the work with respect to particular sites; (iv) the ability to recover costs from any third parties with respect to particular sites; and therefore, the likelihood of any such costs being incurred or whether such costs would be material to the Company cannot be determined at this time. There can thus be no assurance that material liabilities or costs related to environmental matters will not be incurred in the future, or will not have a material adverse effect on the Company’s financial position or results of operations in a particular quarter or fiscal year, or that the Company’s liquidity will not be adversely impacted by such liabilities or costs, although management believes, based on current information, that the costs to address environmental matters will not have a material adverse effect on the Company’s financial condition or liquidity. Costs related to any unknown existing or future contamination remediation will be accrued in the period in which they become probable and reasonably estimable. 14
  • 15. CANADIAN NATIONAL RAILWAY COMPANY NOTES TO UNAUDITED CONSOLIDATED FINANCIAL STATEMENTS (U.S. GAAP) D. Guarantees and indemnifications In the normal course of business, the Company, including certain of its subsidiaries, enters into agreements that may involve providing certain guarantees or indemnifications to third parties and others, which may extend beyond the term of the agreement. These include, but are not limited to, residual value guarantees on operating leases, standby letters of credit and surety and other bonds, and indemnifications that are customary for the type of transaction or for the railway business. The Company is required to recognize a liability for the fair value of the obligation undertaken in issuing certain guarantees on the date the guarantee is issued or modified. In addition, where the Company expects to make a payment in respect of a guarantee, a liability will be recognized to the extent that one has not yet been recognized. (i) Guarantee of residual values of operating leases The Company has guaranteed a portion of the residual values of certain of its assets under operating leases with expiry dates between 2009 and 2020, for the benefit of the lessor. If the fair value of the assets, at the end of their respective lease term, is less than the fair value, as estimated at the inception of the lease, then the Company must, under certain conditions, compensate the lessor for the shortfall. At March 31, 2009, the maximum exposure in respect of these guarantees was $245 million. There are no recourse provisions to recover any amounts from third parties. (ii) Other guarantees The Company, including certain of its subsidiaries, has granted irrevocable standby letters of credit and surety and other bonds, issued by highly rated financial institutions, to third parties to indemnify them in the event the Company does not perform its contractual obligations. As at March 31, 2009, the maximum potential liability under these guarantees was $466 million, of which $409 million was for workers’ compensation and other employee benefits and $57 million was for equipment under leases and other. During 2009, the Company has granted guarantees for which no liability has been recorded, as they relate to the Company’s future performance. As at March 31, 2009, the Company had not recorded any additional liability with respect to these guarantees, as the Company does not expect to make any additional payments associated with these guarantees. The majority of the guarantee instruments mature at various dates between 2009 and 2012. (iii) General indemnifications In the normal course of business, the Company has provided indemnifications, customary for the type of transaction or for the railway business, in various agreements with third parties, including indemnification provisions where the Company would be required to indemnify third parties and others. Indemnifications are found in various types of contracts with third parties which include, but are not limited to: (a) contracts granting the Company the right to use or enter upon property owned by third parties such as leases, easements, trackage rights and sidetrack agreements; (b) contracts granting rights to others to use the Company’s property, such as leases, licenses and easements; (c) contracts for the sale of assets and securitization of accounts receivable; (d) contracts for the acquisition of services; (e) financing agreements; (f) trust indentures, fiscal agency agreements, underwriting agreements or similar agreements relating to debt or equity securities of the Company and engagement agreements with financial advisors; (g) transfer agent and registrar agreements in respect of the Company’s securities; (h) trust and other agreements relating to pension plans and other plans, including those establishing trust funds to secure payment to certain officers and senior employees of special retirement compensation arrangements; (i) pension transfer agreements; (j) master agreements with financial institutions governing derivative transactions; and (k) settlement agreements with insurance companies or other third parties whereby such insurer or third party has been indemnified for any present or future claims relating to insurance policies, incidents or events covered by the settlement agreements. 15
  • 16. CANADIAN NATIONAL RAILWAY COMPANY NOTES TO UNAUDITED CONSOLIDATED FINANCIAL STATEMENTS (U.S. GAAP) To the extent of any actual claims under these agreements, the Company maintains provisions for such items, which it considers to be adequate. Due to the nature of the indemnification clauses, the maximum exposure for future payments may be material. However, such exposure cannot be determined with certainty. The Company has entered into various indemnification contracts with third parties for which the maximum exposure for future payments cannot be determined with certainty. As a result, the Company was unable to determine the fair value of these guarantees and accordingly, no liability was recorded. There are no recourse provisions to recover any amounts from third parties. Note 9 – Earnings per share The following table provides a reconciliation between basic and diluted earnings per share: Three months ended March 31 2009 2008 In millions, except per share data $ 424 Net income $ 311 468.3 Weighted-average shares outstanding 482.8 4.0 Effect of stock options 5.8 472.3 Weighted-average diluted shares outstanding 488.6 $ 0.91 Basic earnings per share $ 0.64 $ 0.90 Diluted earnings per share $ 0.64 The weighted-average number of stock options that were not included in the calculation of diluted earnings per share, as their inclusion would have had an anti-dilutive impact, was 1.1 million for the three months ended March 31, 2009, and 0.2 million for the corresponding period in 2008. Note 10 – Comparative figures Certain figures, previously reported in 2008, have been reclassified to conform with the basis of presentation adopted in 2009. 16
  • 17. CANADIAN NATIONAL RAILWAY COMPANY SELECTED RAILROAD STATISTICS (1) (U.S. GAAP) Three months ended March 31 2009 2008 (Unaudited) Statistical operating data 1,696 Rail freight revenues ($ millions) 1,760 73,557 Gross ton miles (GTM) (millions) 84,327 38,691 Revenue ton miles (RTM) (millions) 44,959 954 Carloads (thousands) 1,132 21,104 Route miles (includes Canada and the U.S.) 20,421 22,083 Employees (end of period) 22,703 22,260 Employees (average for the period) 22,636 Productivity 74.1 Operating ratio (%) 72.9 4.38 Rail freight revenue per RTM (cents) 3.91 1,778 Rail freight revenue per carload ($) 1,555 1.87 Operating expenses per GTM (cents) 1.66 0.62 Labor and fringe benefits expense per GTM (cents) 0.55 3,304 GTMs per average number of employees (thousands) 3,725 85 Diesel fuel consumed (U.S. gallons in millions) 99 1.98 Average fuel price ($/U.S. gallon) 3.02 865 GTMs per U.S. gallon of fuel consumed 852 Safety indicators Injury frequency rate per 200,000 person hours (2) 1.29 2.11 Accident rate per million train miles (2) 2.13 2.66 Financial ratio 43.4 Debt to total capitalization ratio (% at end of period) 38.6 (1) Includes data relating to companies acquired as of the date of acquisition. (2) Based on Federal Railroad Administration (FRA) reporting criteria. Certain statistical data and related productivity measures are based on estimated data available at such time and are subject to change as more complete information becomes available. 17
  • 18. CANADIAN NATIONAL RAILWAY COMPANY SUPPLEMENTARY INFORMATION (U.S. GAAP) Three months ended March 31 Variance 2009 2008 Fav (Unfav) (Unaudited) Revenues (millions of dollars) 340 Petroleum and chemicals 319 7% 198 Metals and minerals 205 (3%) 302 Forest products 330 (8%) 103 Coal 99 4% 357 Grain and fertilizers 340 5% 319 Intermodal 351 (9%) 77 Automotive 116 (34%) 1,696 Total rail freight revenue 1,760 (4%) 163 Other revenues 167 (2%) 1,859 Total revenues 1,927 (4%) Revenue ton miles (millions) 7,527 Petroleum and chemicals 8,426 (11%) 3,252 Metals and minerals 4,091 (21%) 6,614 Forest products 8,458 (22%) 2,841 Coal 3,392 (16%) 10,558 Grain and fertilizers 11,829 (11%) 7,476 Intermodal 8,089 (8%) 423 Automotive 674 (37%) 38,691 44,959 (14%) Rail freight revenue / RTM (cents) Total rail freight revenue per RTM 4.38 3.91 12% Commodity groups: 4.52 Petroleum and chemicals 3.79 19% 6.09 Metals and minerals 5.01 22% 4.57 Forest products 3.90 17% 3.63 Coal 2.92 24% 3.38 Grain and fertilizers 2.87 18% 4.27 Intermodal 4.34 (2%) 18.20 Automotive 17.21 6% Carloads (thousands) 128 Petroleum and chemicals 145 (12%) 180 Metals and minerals 238 (24%) 100 Forest products 127 (21%) 90 Coal 87 3% 132 Grain and fertilizers 151 (13%) 292 Intermodal 327 (11%) 32 Automotive 57 (44%) 954 1,132 (16%) Rail freight revenue / carload (dollars) Total rail freight revenue per carload 1,778 1,555 14% Commodity groups: 2,656 Petroleum and chemicals 2,200 21% 1,100 Metals and minerals 861 28% 3,020 Forest products 2,598 16% 1,144 Coal 1,138 1% 2,705 Grain and fertilizers 2,252 20% 1,092 Intermodal 1,073 2% 2,406 Automotive 2,035 18% Such statistical data and related productivity measures are based on estimated data available at such time and are subject to change as more complete information becomes available. 18
  • 19. CANADIAN NATIONAL RAILWAY COMPANY NON-GAAP MEASURES - unaudited Adjusted performance measures During the three months ended March 31, 2009, the Company reported adjusted net income of $302 million, or $0.64 per diluted share. The adjusted figures exclude the EJ&E acquisition-related costs of $46 million or $28 million after-tax ($0.06 per diluted share), the gain on sale of the Weston subdivision of $157 million or $135 million after-tax ($0.29 per diluted share) and a deferred income tax recovery of $15 million ($0.03 per diluted share) resulting from the enactment of lower provincial corporate income tax rates. During the three months ended March 31, 2008, the Company reported adjusted net income of $300 million, or $0.62 per diluted share. The adjusted figures exclude a deferred income tax recovery of $11 million ($0.02 per diluted share) that resulted from net capital losses arising from the reorganization of a subsidiary. Management believes that adjusted net income and adjusted earnings per share are useful measures of performance that can facilitate period-to-period comparisons, as they exclude items that do not necessarily arise as part of the normal day-to-day operations of the Company and could distort the analysis of trends in business performance. The exclusion of such items in adjusted net income and adjusted earnings per share does not, however, imply that such items are necessarily non-recurring. These adjusted measures do not have any standardized meaning prescribed by GAAP and may, therefore, not be comparable to similar measures presented by other companies. The reader is advised to read all information provided in the Company’s 2009 unaudited Interim Consolidated Financial Statements and Notes thereto. The following tables provide a reconciliation of net income and earnings per share, as reported for the three months ended March 31, 2009 and 2008, to the adjusted performance measures presented herein. Three months ended Three months ended March 31, 2009 March 31, 2008 Reported Adjustments Adjusted Reported Adjustments Adjusted In millions, except per share data Revenues $ 1,859 $ - $ 1,859 $ 1,927 $ - $ 1,927 Operating expenses 1,378 (46) 1,332 1,404 - 1,404 Operating income 481 46 527 523 - 523 Interest expense (112) - (112) (86) - (86) Other income (loss) 161 (157) 4 (6) - (6) Income before income taxes 530 (111) 419 431 - 431 Income tax expense (106) (11) (117) (120) (11) (131) Net income $ 424 $ (122) $ 302 $ 311 $ (11) $ 300 Operating ratio 74.1% 71.7% 72.9% 72.9% Basic earnings per share $ 0.91 $ (0.26) $ 0.65 $ 0.64 $ (0.02) $ 0.62 Diluted earnings per share $ 0.90 $ (0.26) $ 0.64 $ 0.64 $ (0.02) $ 0.62 19
  • 20. CANADIAN NATIONAL RAILWAY COMPANY NON-GAAP MEASURES - unaudited Free cash flow The Company generated $207 million of free cash flow for the quarter ended March 31, 2009 compared to $61 million for the same period in 2008. Free cash flow does not have any standardized meaning prescribed by GAAP and may, therefore, not be comparable to similar measures presented by other companies. The Company believes that free cash flow is a useful measure of performance as it demonstrates the Company’s ability to generate cash after the payment of capital expenditures and dividends. The Company defines free cash flow as cash provided from operating activities, adjusted for changes in the accounts receivable securitization program and in cash and cash equivalents resulting from foreign exchange fluctuations, less cash used by investing activities, adjusted for the impact of major acquisitions, and the payment of dividends, calculated as follows: Three months ended March 31 2009 2008 In millions $ 318 Cash provided from operating activities $ 165 (446) Cash used by investing activities (166) (128) Cash used before financing activities (1) Adjustments: 68 Change in accounts receivable securitization 163 (118) Dividends paid (111) 373 Acquisition of EJ&E - Effect of foreign exchange fluctuations on U.S. dollar-denominated 12 cash and cash equivalents 10 $ 207 Free cash flow $ 61 20