
Recommended
More Related Content
What's hot
Viewers also liked
Viewers also liked (20)
Similar to 3rd_qtr_2002
Similar to 3rd_qtr_2002 (20)
More from finance50
More from finance50 (20)
Recently uploaded
Recently uploaded (20)
3rd_qtr_2002
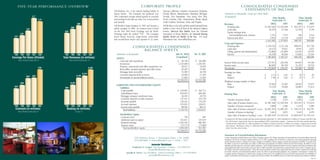
- 1. CONSOLIDATED CONDENSED CORPORATE PROFILE FIVE-YEAR PERFORMANCE OVERVIEW STATEMENTS OF INCOME Toll Brothers, Inc. is the nation’s leading builder of Arizona, California, Colorado, Connecticut, Delaware, (Amounts in thousands, except per share data) luxury homes. The Company has produced over Florida, Illinois, Massachusetts, Maryland, Michigan, 20% compound average annual growth in revenues Nevada, New Hampshire, New Jersey, New York, $584 $.77 $581 (Unaudited) Nine Months Three Months and earnings for the last one, three, five, seven and ten North Carolina, Ohio, Pennsylvania, Rhode Island, $.70 Ended July 31 Ended July 31 year periods. South Carolina, Tennessee, Texas, and Virginia. 2002 2001 2002 2001 $465 Revenues: Toll Brothers began business in 1967 and became a Toll Brothers is the only publicly traded national home Housing sales $1,587,168 $1,529,394 $ 565,355 $ 573,479 $406 public company in 1986. Its common stock is listed builder to have won all three of the industry’s highest $.50 Land sales 26,519 25,166 12,478 2,749 on the New York Stock Exchange and the Pacific honors: America’s Best Builder from the National $342 Equity earnings from Exchange under the symbol “TOL”. The Company Association of Home Builders, the National Housing $.40 unconsolidated joint ventures 1,743 7,575 246 2,314 $.34 serves luxury move-up, empty-nester, active-adult, Quality Award and Builder of the Year. For more Interest and other 7,952 11,718 2,628 5,526 and second-home buyers and operates in 22 states: information visit www.tollbrothers.com. 1,623,382 1,573,853 580,707 584,068 Costs and Expenses: Housing sales 1,149,720 1,131,136 409,657 417,756 CONSOLIDATED CONDENSED Land sales 18,125 19,611 8,947 2,073 BALANCE SHEETS Selling, general and administrative 172,866 152,894 61,874 54,555 July 31, 2002 Oct. 31, 2001 (Amounts in thousands) Interest 45,258 40,506 15,626 15,524 1998 1999 2000 2001 2002 1998 1999 2000 2001 2002 (Unaudited) 1,385,969 1,344,147 496,104 489,908 Earnings Per Share (Diluted) Total Revenues (in millions) ASSETS Three Months Ended July 31 Three Months Ended July 31 Cash and cash equivalents $ 50,744 $ 182,840 Income before income taxes 237,413 229,706 84,603 94,160 Inventories 2,525,660 2,183,541 Income taxes 86,909 84,559 31,103 34,716 Property, construction and office equipment, net 36,917 33,095 $704 $1,905 Net income $ 150,504 $ 145,147 $ 53,500 $ 59,444 Receivables, prepaid expenses and other assets 82,287 74,481 Mortgage loans receivable 31,585 26,758 Earnings per share $1,579 Customer deposits held in escrow 25,048 17,303 Basic $ 2.13 $ 2.01 $ .76 $ .83 $1,468 $543 $532 Investments in unconsolidated entities 17,692 14,182 Diluted $ 1.99 $ 1.85 $ .70 $ .77 $2,769,933 $2,532,200 Weighted average number of shares $1,093 $399 Basic 70,562 72,287 70,835 71,677 LIABILITIES AND STOCKHOLDERS’ EQUITY $333 Diluted 75,722 78,269 76,685 77,413 Liabilities: $844 Loans payable $ 254,601 $ 362,712 Nine Months Three Months Subordinated notes 819,643 669,581 Ended July 31 Ended July 31 Housing Data Mortgage company warehouse loans 26,434 24,754 2002 2001 2002 2001 Customer deposits on sales contracts 137,411 101,778 Number of homes closed 3,158 3,079 1,093 1,129 Accounts payable 130,241 132,970 Sales value of homes closed (in 000’s) $1,587,168 $1,529,394 $ 565,355 $ 573,479 Accrued expenses 253,832 229,671 Number of homes contracted* 3,908 3,396 1,274 1,085 1998 1999 2000 2001 2002 1998 1999 2000 2001 2002 Income taxes payable 88,581 98,151 Contracts (in millions) Backlog (in millions) Sales value of homes contracted* (in 000’s) $2,091,593 $1,685,197 $ 704,170 $ 542,792 Total liabilities 1,710,743 1,619,617 Three Months Ended July 31 At July 31 Number of homes in backlog* 3,441 3,055 3,441 3,055 Stockholders’ Equity: Sales value of homes in backlog* (in 000’s) $1,904,539 $1,579,110 $1,904,539 $1,579,110 Common stock 740 369 *Contracts for the three-month and nine-month periods ended July 31, 2002 included $4.2 million (12 homes) and $8.9 mil- Additional paid-in capital 101,811 107,014 lion (26 homes), respectively, from an unconsolidated 50% owned joint venture. Contracts for the three-month and nine- Retained earnings 1,032,416 882,281 month periods ended July 31, 2001 included $1.9 million (6 homes) and $11.6 million (41 homes), respectively, from this Treasury stock (75,777) (77,081) joint venture. Backlog as of July 31, 2002 and 2001 included $5.4 million (15 homes) and $9.1 million (30 homes), respec- Total stockholders’ equity 1,059,190 912,583 tively, from this joint venture. $2,769,933 $2,532,200 Statement on Forward-looking Information Certain information included herein and in other Company reports, SEC filings, statements and presentations is forward-looking within the 3103 Philmont Avenue • Huntingdon Valley • PA 19006 meaning of the Private Securities Litigation Reform Act of 1995, including, but not limited to, statements concerning anticipated operating 215-938-8000 • www.tollbrothers.com • NYSE – “TOL” results, financial resources, changes in revenues, changes in profitability, interest expense, growth and expansion, the ability to acquire land, the ability to open new communities, the ability to sell homes and properties, the ability to deliver homes from backlog, the ability to secure Investor Relations materials and subcontractors, and stock market valuations. Such forward-looking information involves important risks and uncertainties that Frederick N. Cooper, Vice President - Finance – 215-938-8312 could significantly affect actual results and cause them to differ materially from expectations expressed herein and in other Company reports, fcooper@tollbrothersinc.com SEC filings, statements and presentations. These risks and uncertainties include local, regional and national economic conditions, the demand for homes, domestic and international political events, the effects of governmental regulation, the competitive environment in which the Joseph R. Sicree, Vice President - Chief Accounting Officer – 215-938-8045 Company operates, fluctuations in interest rates, changes in home prices, the availability and cost of land for future growth, the availability of jsicree@tollbrothersinc.com capital, uncertainties and fluctuations in capital and securities markets, the availability and cost of labor and materials, and weather conditions. mkt-573
- 2. Huntingdon Valley, PA 19006-4298 A LETTER TO OUR SHAREHOLDERS: T H I R D Q U A RT E R R E P O RT FOR THE THREE MONTHS E N D E D J U LY 3 1 , 2 0 0 2 3rd Quarter Report 3103 Philmont Avenue With demand for new luxury homes outstripping communities by October 31st, our fiscal year-end supply, we are enjoying strong sales activity at our – an increase of 10% versus FYE 2001 – and move-up, empty-nester and active-adult commu- approximately 185 by FYE 2003. Based on this nities. Since February, the start of our second community growth and the strength of current quarter, our deposits, traffic and contracts have demand, we foresee record deliveries of substantially exceeded last year’s record results. approximately 5,000 homes in 2003 and approximately 6,000 homes in 2004. And with Record third quarter contracts of $704.2 million nearly 42,000 home sites under control in affluent grew 30% and record nine month contracts of markets nationwide, we are well-positioned for $2.09 billion increased 24% versus 2001. The further growth in this decade. Company’s record third quarter backlog of $1.90 billion rose 21% and was the highest backlog for After pursuing approvals for the last ten years, we any quarter-end in Toll Brothers’ history. recently received a favorable ruling from the New Jersey Supreme Court allowing us to proceed with The combination of increasing numbers of affluent development of 1,165 for-sale homes and rental households, the maturing of the baby boomers and units in Princeton Junction. Our decade-long a shortage of new home sites are fueling this strong struggle, although extraordinary in time and demand. We believe the impact of attractive expense, highlights the difficulty in bringing new mortgage rates and the appeal of a home as a stable lots to market in many parts of the United States. investment in this period of financial uncertainty Generally, only the large builders, such as Toll are also contributing to healthy demand. Brothers, with the expertise, capital and resources to persevere, can bring projects of this scale to Because of the lead time from the signing of a fruition. Increasing regulation and anti-growth contract to the delivery of a home, our third politics continue to constrict the pipeline of quarter revenues and earnings were impacted by approved home sites. The result is an undersupply the slowdown in demand in late Summer 2001 of new homes, despite growing demand; this is a and the further decline in contracts in the primary reason for rising home prices. aftermath of the tragedies of September 11th. Third quarter earnings of $0.70 per share diluted In its June, 2002 issue, Professional Builder were down 9% versus 2001 as net income of $53.5 magazine rated Toll Brothers among the top places million declined 10%. Record nine month to work in the residential construction industry. earnings of $1.99 per share diluted rose 8% as Even though we have grown extremely rapidly in record nine month net income of $150.5 million the past decade, we’ve sought to preserve our rose 4%. Third quarter revenues of $580.7 million “small company” atmosphere; this is a constant were 1% below last year’s third quarter record challenge now that we have over 3,000 employees while record nine month revenues of $1.62 billion in 22 states, but it is one we believe is well worth increased 3% versus 2001. The Hampton at Brier Creek Country Club, Raleigh, NC maintaining – the result is greater value created for our shareholders, our home buyers and our Third quarter 2002 earnings were also impacted associates. We wish to thank them all for their by declines of $2.1 million in joint venture income continued support. and $2.9 million in other income versus 2001. In addition, while the Company’s selling and administrative costs increased, due primarily to continued growth in new selling communities, revenues for the quarter did not rise comparably Robert I. Toll Bruce E. Toll due to the late Summer 2001 and September 11th Chairman of the Board Vice Chairman effects on third quarter home deliveries. Even with and Chief Executive Officer of the Board the Company’s continuing expansion plans, the relationship between SG&A and revenue growth should become more balanced as these new communities start to deliver more homes. Permit No. 1726 PAID First-Class Mail Zvi Barzilay Brooklyn, NY U.S. Postage President and Chief Operating Officer Our record backlog of 3,441 homes presages strong results for at least the next nine months. We August 27, 2002 expect to have open approximately 170 selling