1. The Clorox Company
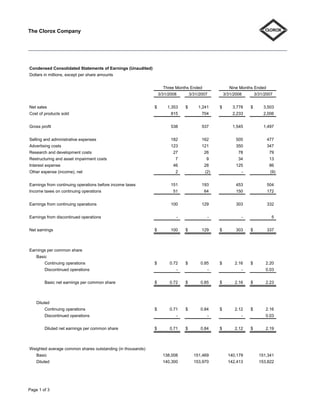
Condensed Consolidated Statements of Earnings (Unaudited)
Dollars in millions, except per share amounts
Three Months Ended Nine Months Ended
3/31/2008 3/31/2007 3/31/2008 3/31/2007
Net sales $ 1,353 $ 1,241 $ 3,778 $ 3,503
Cost of products sold 815 704 2,233 2,006
Gross profit 538 537 1,545 1,497
Selling and administrative expenses 182 162 505 477
Advertising costs 123 121 350 347
Research and development costs 27 26 78 79
Restructuring and asset impairment costs 7 9 34 13
Interest expense 46 28 125 86
Other expense (income), net 2 (2) - (9)
Earnings from continuing operations before income taxes 151 193 453 504
Income taxes on continuing operations 51 64 150 172
Earnings from continuing operations 100 129 303 332
Earnings from discontinued operations - - - 5
Net earnings $ 100 $ 129 $ 303 $ 337
Earnings per common share
Basic
Continuing operations $ 0.72 $ 0.85 $ 2.16 $ 2.20
Discontinued operations - - - 0.03
Basic net earnings per common share $ 0.72 $ 0.85 $ 2.16 $ 2.23
Diluted
Continuing operations $ 0.71 $ 0.84 $ 2.12 $ 2.16
Discontinued operations - - - 0.03
Diluted net earnings per common share $ 0.71 $ 0.84 $ 2.12 $ 2.19
Weighted average common shares outstanding (in thousands)
Basic 138,008 151,469 140,179 151,341
Diluted 140,300 153,970 142,413 153,822
Page 1 of 3
2. The Clorox Company
Segment Information
(Unaudited)
Dollars in millions
Third Quarter
Earnings/(Losses) from Continuing
Net Sales Operations Before Income Taxes
Three Months Ended % Three Months Ended %
(1) (1)
3/31/2008 3/31/2007 Change 3/31/2008 3/31/2007 Change
North America $ $ 8% $ $ -3%
1,143 1,056 296 306
International 210 185 14% 32 38 -16%
Corporate - - - (177) (151) 17%
Total Company $ 1,353 $ 1,241 9% $ 151 $ 193 -22%
Year To Date Earnings/(Losses) from Continuing
Net Sales Operations Before Income Taxes
Nine Months Ended % Nine Months Ended %
(1) (1)
3/31/2008 3/31/2007 Change 3/31/2008 3/31/2007 Change
North America $ $ 6% $ $ -1%
3,169 2,979 839 847
International 16% 1%
609 524 107 106
Corporate - - - (493) (449) 10%
Total Company $ 3,778 $ 3,503 8% $ 453 $ 504 -10%
(1)
Percentages based on rounded numbers.
Page 2 of 3
3. The Clorox Company
Condensed Consolidated Balance Sheets (Unaudited)
Dollars in millions
3/31/2008 6/30/2007 3/31/2007
Assets
Current assets
$ $ $
Cash and cash equivalents 282 182 171
Receivables, net 456 460 426
Inventories, net 423 309 346
Other current assets 108 81 75
Total current assets 1,269 1,032 1,018
Property, plant and equipment, net 943 976 965
Goodwill 1,664 1,025 1,007
Trademarks, net 563 254 250
Other intangible assets, net 125 94 106
186 200 253
Other assets
$ 4,750 $ 3,581 $ 3,599
Total assets
Liabilities and Stockholders’ (Deficit) Equity
Current liabilities
$ $ $
Notes and loans payable 959 74 206
Current maturities of long-term debt - 500 501
Accounts payable 340 329 292
Accrued liabilities 406 507 460
Income taxes payable 70 17 24
Total current liabilities 1,775 1,427 1,483
Long-term debt 2,721 1,462 1,463
Other liabilities 596 516 556
Deferred income taxes 130 5 5
5,222 3,410 3,507
Total liabilities
Contingencies
Stockholders’ (deficit) equity
159 159 159
Common stock
518 481 452
Additional paid-in capital
295 185 85
Retained earnings
(1,282) (445) (404)
Treasury shares
(162) (209) (200)
Accumulated other comprehensive net losses
(472) 171 92
Stockholders’ (deficit) equity
$ 4,750 $ 3,581 $ 3,599
Total liabilities and stockholders’ (deficit) equity
Page 3 of 3