
Recommended
More Related Content
What's hot
What's hot (16)
Viewers also liked
Viewers also liked (14)
Similar to Whole Foods Market Cash Flow Statement Analysis
Similar to Whole Foods Market Cash Flow Statement Analysis (20)
More from finance44
More from finance44 (20)
Recently uploaded
Recently uploaded (20)
Whole Foods Market Cash Flow Statement Analysis
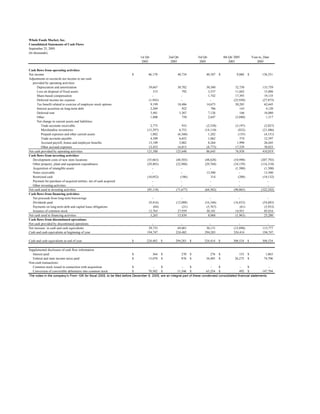
- 1. Whole Foods Market, Inc. Consolidated Statements of Cash Flows September 25, 2005 (In thousands) 1st Qtr 2nd Qtr 3rd Qtr 4th Qtr 2005 Year-to_Date 2005 2005 2005 2005 2005 Cash flows from operating activities: Net income $ 46,170 40,734 40,387 $ 9,060 $ 136,351 Adjustments to reconcile net income to net cash provided by operating activities: Depreciation and amortization 39,667 30,782 30,560 32,750 133,759 Loss on disposal of fixed assets 515 792 3,537 11,042 15,886 Share-based compensation - - 1,742 17,393 19,135 Deferred income tax expense (1,943) - - (25,930) (27,873) Tax benefit related to exercise of employee stock options 9,199 18,486 14,673 20,285 62,643 Interest accretion on long-term debt 2,269 922 786 143 4,120 Deferred rent 3,481 5,307 7,126 166 16,080 Other 1,800 750 2,647 (3,880) 1,317 Net change in current assets and liabilities: Trade accounts receivable 2,775 933 (2,538) (3,197) (2,027) Merchandise inventories (13,297) 6,753 (14,110) (832) (21,486) Prepaid expenses and other current assets 1,082 (6,360) 1,282 (155) (4,151) Trade accounts payable 4,309 6,652 1,062 574 12,597 Accrued payroll, bonus and employee benefits 13,109 3,082 8,264 1,990 26,445 Other accrued expenses 12,452 16,815 (8,773) 17,529 38,023 Net cash provided by operating activities 121,588 125,648 86,645 76,938 410,819 Cash flows from investing activities: Development costs of new store locations (55,663) (48,503) (48,628) (54,998) (207,792) Other property, plant and equipment expenditures (29,403) (22,988) (29,768) (34,159) (116,318) Acquisition of intangible assets - - - (1,500) (1,500) Notes receivable - - 13,500 - 13,500 Restricted cash (10,052) (186) 314 (208) (10,132) Payment for purchase of acquired entities, net of cash acquired - - - - - Other investing activities - - - - - Net cash used in investing activities (95,118) (71,677) (64,582) (90,865) (322,242) Cash flows from financing activities: Net proceeds from long-term borrowings - - - - - Dividends paid (9,416) (12,088) (16,346) (16,833) (54,683) Payments on long-term debt and capital lease obligations (84) (21) (5,767) (61) (5,933) Issuance of common stock 12,765 27,939 30,181 14,931 85,816 Net cash used in financing activities 3,265 15,830 8,068 (1,963) 25,200 Cash flows from discontinued operations: Net cash provided by discontinued operations - - - - - Net increase in cash and cash equivalents 29,735 69,801 30,131 (15,890) 113,777 Cash and cash equivalents at beginning of year 194,747 224,482 294,283 324,414 194,747 Cash and cash equivalents at end of year $ 224,482 $ 294,283 $ 324,414 $ 308,524 $ 308,524 Supplemental disclosure of cash flow information Interest paid $ 364 $ 270 $ 276 $ 153 $ 1,063 Federal and state income taxes paid $ 13,070 $ 876 $ 34,485 $ 26,275 $ 74,706 Non-cash transactions: Common stock issued in connection with acquisition $ - $ - $ - $ - $ - Conversion of convertible debentures into common stock $ 70,502 $ 11,546 $ 65,254 $ 492 $ 147,794 The notes in the company's From 10K for fiscal 2005, to be filed before December 9, 2005, are an integral part of these condensed consolidated financial statements.