Resume
• Real GDP growth slowed down due to problems with access to electricity caused by the destruction of manoeuvrable electricity generation by Russian drones and missiles.
• Exports and imports continued growing due to better logistics through the Ukrainian sea corridor and road. Polish farmers and drivers stopped blocking borders at the end of April.
• In April, both the Tax and Customs Services over-executed the revenue plan. Moreover, the NBU transferred twice the planned profit to the budget.
• The European side approved the Ukraine Plan, which the government adopted to determine indicators for the Ukraine Facility. That approval will allow Ukraine to receive a EUR 1.9 bn loan from the EU in May. At the same time, the EU provided Ukraine with a EUR 1.5 bn loan in April, as the government fulfilled five indicators under the Ukraine Plan.
• The USA has finally approved an aid package for Ukraine, which includes USD 7.8 bn of budget support; however, the conditions and timing of the assistance are still unknown.
• As in March, annual consumer inflation amounted to 3.2% yoy in April.
• At the April monetary policy meeting, the NBU again reduced the key policy rate from 14.5% to 13.5% per annum.
• Over the past four weeks, the hryvnia exchange rate has stabilized in the UAH 39-40 per USD range.
The secret way to sell pi coins effortlessly.DOT TECH
Well as we all know pi isn't launched yet. But you can still sell your pi coins effortlessly because some whales in China are interested in holding massive pi coins. And they are willing to pay good money for it. If you are interested in selling I will leave a contact for you. Just telegram this number below. I sold about 3000 pi coins to him and he paid me immediately.
Telegram: @Pi_vendor_247
Falcon stands out as a top-tier P2P Invoice Discounting platform in India, bridging esteemed blue-chip companies and eager investors. Our goal is to transform the investment landscape in India by establishing a comprehensive destination for borrowers and investors with diverse profiles and needs, all while minimizing risk. What sets Falcon apart is the elimination of intermediaries such as commercial banks and depository institutions, allowing investors to enjoy higher yields.
how to sell pi coins in all Africa Countries.DOT TECH
Yes. You can sell your pi network for other cryptocurrencies like Bitcoin, usdt , Ethereum and other currencies And this is done easily with the help from a pi merchant.
What is a pi merchant ?
Since pi is not launched yet in any exchange. The only way you can sell right now is through merchants.
A verified Pi merchant is someone who buys pi network coins from miners and resell them to investors looking forward to hold massive quantities of pi coins before mainnet launch in 2026.
I will leave the telegram contact of my personal pi merchant to trade with.
@Pi_vendor_247
NO1 Uk Black Magic Specialist Expert In Sahiwal, Okara, Hafizabad, Mandi Bah...Amil Baba Dawood bangali
Contact with Dawood Bhai Just call on +92322-6382012 and we'll help you. We'll solve all your problems within 12 to 24 hours and with 101% guarantee and with astrology systematic. If you want to take any personal or professional advice then also you can call us on +92322-6382012 , ONLINE LOVE PROBLEM & Other all types of Daily Life Problem's.Then CALL or WHATSAPP us on +92322-6382012 and Get all these problems solutions here by Amil Baba DAWOOD BANGALI
#vashikaranspecialist #astrologer #palmistry #amliyaat #taweez #manpasandshadi #horoscope #spiritual #lovelife #lovespell #marriagespell#aamilbabainpakistan #amilbabainkarachi #powerfullblackmagicspell #kalajadumantarspecialist #realamilbaba #AmilbabainPakistan #astrologerincanada #astrologerindubai #lovespellsmaster #kalajaduspecialist #lovespellsthatwork #aamilbabainlahore#blackmagicformarriage #aamilbaba #kalajadu #kalailam #taweez #wazifaexpert #jadumantar #vashikaranspecialist #astrologer #palmistry #amliyaat #taweez #manpasandshadi #horoscope #spiritual #lovelife #lovespell #marriagespell#aamilbabainpakistan #amilbabainkarachi #powerfullblackmagicspell #kalajadumantarspecialist #realamilbaba #AmilbabainPakistan #astrologerincanada #astrologerindubai #lovespellsmaster #kalajaduspecialist #lovespellsthatwork #aamilbabainlahore #blackmagicforlove #blackmagicformarriage #aamilbaba #kalajadu #kalailam #taweez #wazifaexpert #jadumantar #vashikaranspecialist #astrologer #palmistry #amliyaat #taweez #manpasandshadi #horoscope #spiritual #lovelife #lovespell #marriagespell#aamilbabainpakistan #amilbabainkarachi #powerfullblackmagicspell #kalajadumantarspecialist #realamilbaba #AmilbabainPakistan #astrologerincanada #astrologerindubai #lovespellsmaster #kalajaduspecialist #lovespellsthatwork #aamilbabainlahore #Amilbabainuk #amilbabainspain #amilbabaindubai #Amilbabainnorway #amilbabainkrachi #amilbabainlahore #amilbabaingujranwalan #amilbabainislamabad
how to sell pi coins on Bitmart crypto exchangeDOT TECH
Yes. Pi network coins can be exchanged but not on bitmart exchange. Because pi network is still in the enclosed mainnet. The only way pioneers are able to trade pi coins is by reselling the pi coins to pi verified merchants.
A verified merchant is someone who buys pi network coins and resell it to exchanges looking forward to hold till mainnet launch.
I will leave the telegram contact of my personal pi merchant to trade with.
@Pi_vendor_247
Currently pi network is not tradable on binance or any other exchange because we are still in the enclosed mainnet.
Right now the only way to sell pi coins is by trading with a verified merchant.
What is a pi merchant?
A pi merchant is someone verified by pi network team and allowed to barter pi coins for goods and services.
Since pi network is not doing any pre-sale The only way exchanges like binance/huobi or crypto whales can get pi is by buying from miners. And a merchant stands in between the exchanges and the miners.
I will leave the telegram contact of my personal pi merchant. I and my friends has traded more than 6000pi coins successfully
Tele-gram
@Pi_vendor_247
US Economic Outlook - Being Decided - M Capital Group August 2021.pdfpchutichetpong
The U.S. economy is continuing its impressive recovery from the COVID-19 pandemic and not slowing down despite re-occurring bumps. The U.S. savings rate reached its highest ever recorded level at 34% in April 2020 and Americans seem ready to spend. The sectors that had been hurt the most by the pandemic specifically reduced consumer spending, like retail, leisure, hospitality, and travel, are now experiencing massive growth in revenue and job openings.
Could this growth lead to a “Roaring Twenties”? As quickly as the U.S. economy contracted, experiencing a 9.1% drop in economic output relative to the business cycle in Q2 2020, the largest in recorded history, it has rebounded beyond expectations. This surprising growth seems to be fueled by the U.S. government’s aggressive fiscal and monetary policies, and an increase in consumer spending as mobility restrictions are lifted. Unemployment rates between June 2020 and June 2021 decreased by 5.2%, while the demand for labor is increasing, coupled with increasing wages to incentivize Americans to rejoin the labor force. Schools and businesses are expected to fully reopen soon. In parallel, vaccination rates across the country and the world continue to rise, with full vaccination rates of 50% and 14.8% respectively.
However, it is not completely smooth sailing from here. According to M Capital Group, the main risks that threaten the continued growth of the U.S. economy are inflation, unsettled trade relations, and another wave of Covid-19 mutations that could shut down the world again. Have we learned from the past year of COVID-19 and adapted our economy accordingly?
“In order for the U.S. economy to continue growing, whether there is another wave or not, the U.S. needs to focus on diversifying supply chains, supporting business investment, and maintaining consumer spending,” says Grace Feeley, a research analyst at M Capital Group.
While the economic indicators are positive, the risks are coming closer to manifesting and threatening such growth. The new variants spreading throughout the world, Delta, Lambda, and Gamma, are vaccine-resistant and muddy the predictions made about the economy and health of the country. These variants bring back the feeling of uncertainty that has wreaked havoc not only on the stock market but the mindset of people around the world. MCG provides unique insight on how to mitigate these risks to possibly ensure a bright economic future.
what is the best method to sell pi coins in 2024DOT TECH
The best way to sell your pi coins safely is trading with an exchange..but since pi is not launched in any exchange, and second option is through a VERIFIED pi merchant.
Who is a pi merchant?
A pi merchant is someone who buys pi coins from miners and pioneers and resell them to Investors looking forward to hold massive amounts before mainnet launch in 2026.
I will leave the telegram contact of my personal pi merchant to trade pi coins with.
@Pi_vendor_247
Empowering the Unbanked: The Vital Role of NBFCs in Promoting Financial Inclu...Vighnesh Shashtri
In India, financial inclusion remains a critical challenge, with a significant portion of the population still unbanked. Non-Banking Financial Companies (NBFCs) have emerged as key players in bridging this gap by providing financial services to those often overlooked by traditional banking institutions. This article delves into how NBFCs are fostering financial inclusion and empowering the unbanked.
how to swap pi coins to foreign currency withdrawable.DOT TECH
As of my last update, Pi is still in the testing phase and is not tradable on any exchanges.
However, Pi Network has announced plans to launch its Testnet and Mainnet in the future, which may include listing Pi on exchanges.
The current method for selling pi coins involves exchanging them with a pi vendor who purchases pi coins for investment reasons.
If you want to sell your pi coins, reach out to a pi vendor and sell them to anyone looking to sell pi coins from any country around the globe.
Below is the contact information for my personal pi vendor.
Telegram: @Pi_vendor_247
What price will pi network be listed on exchangesDOT TECH
The rate at which pi will be listed is practically unknown. But due to speculations surrounding it the predicted rate is tends to be from 30$ — 50$.
So if you are interested in selling your pi network coins at a high rate tho. Or you can't wait till the mainnet launch in 2026. You can easily trade your pi coins with a merchant.
A merchant is someone who buys pi coins from miners and resell them to Investors looking forward to hold massive quantities till mainnet launch.
I will leave the telegram contact of my personal pi vendor to trade with.
@Pi_vendor_247
how to sell pi coins at high rate quickly.DOT TECH
Where can I sell my pi coins at a high rate.
Pi is not launched yet on any exchange. But one can easily sell his or her pi coins to investors who want to hold pi till mainnet launch.
This means crypto whales want to hold pi. And you can get a good rate for selling pi to them. I will leave the telegram contact of my personal pi vendor below.
A vendor is someone who buys from a miner and resell it to a holder or crypto whale.
Here is the telegram contact of my vendor:
@Pi_vendor_247
how to sell pi coins effectively (from 50 - 100k pi)DOT TECH
Anywhere in the world, including Africa, America, and Europe, you can sell Pi Network Coins online and receive cash through online payment options.
Pi has not yet been launched on any exchange because we are currently using the confined Mainnet. The planned launch date for Pi is June 28, 2026.
Reselling to investors who want to hold until the mainnet launch in 2026 is currently the sole way to sell.
Consequently, right now. All you need to do is select the right pi network provider.
Who is a pi merchant?
An individual who buys coins from miners on the pi network and resells them to investors hoping to hang onto them until the mainnet is launched is known as a pi merchant.
debuts.
I'll provide you the Telegram username
@Pi_vendor_247
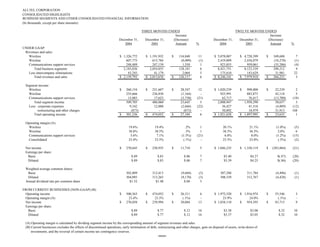
1. ALLTEL CORPORATION
CONSOLIDATED HIGHLIGHTS
BUSINESS SEGMENTS AND OTHER CONSOLIDATED FINANCIAL INFORMATION
(In thousands, except per share amounts)
TWELVE MONTHS ENDED
THREE MONTHS ENDED
Increase Increase
December 31, December 31, (Decrease) December 31, December 31, (Decrease)
2004 2003 Amount % 2004 2003 Amount %
UNDER GAAP:
Revenues and sales:
Wireless $ 1,326,772 $ 1,191,932 $ 134,840 11 $ 5,078,087 $ 4,728,399 $ 349,688 7
Wireline 607,775 615,784 (8,009) (1) 2,419,809 2,436,079 (16,270) (1)
Communications support services 248,489 247,139 1,350 1 923,855 959,061 (35,206) (4)
Total business segments 2,183,036 2,054,855 128,181 6 8,421,751 8,123,539 298,212 4
Less intercompany eliminations 43,243 41,179 2,064 5 175,610 143,629 31,981 22
Total revenues and sales $ 2,139,793 $ 2,013,676 $ 126,117 6 $ 8,246,141 $ 7,979,910 $ 266,231 3
Segment income:
Wireless $ 260,154 $ 231,607 $ 28,547 12 $ 1,020,239 $ 998,000 $ 22,239 2
Wireline 235,666 236,830 (1,164) - 925,991 883,873 42,118 5
Communications support services 13,885 17,623 (3,738) (21) 62,717 76,417 (13,700) (18)
Total segment income 509,705 486,060 23,645 5 2,008,947 1,958,290 50,657 3
Less: corporate expenses 9,342 12,008 (2,666) (22) 36,427 41,316 (4,889) (12)
restructuring and other charges (873) - (873) - 50,892 18,979 31,913 168
Total operating income $ 501,236 $ 474,052 $ 27,184 6 $ 1,921,628 $ 1,897,995 $ 23,633 1
Operating margin (A):
Wireless 19.6% 19.4% .2% 1 20.1% 21.1% (1.0%) (5)
Wireline 38.8% 38.5% .3% 1 38.3% 36.3% 2.0% 6
Communications support services 5.6% 7.1% (1.5%) (21) 6.8% 8.0% (1.2%) (15)
Consolidated 23.4% 23.5% (.1%) - 23.3% 23.8% (.5%) (2)
Net income $ 270,645 $ 258,935 $ 11,710 5 $ 1,046,235 $ 1,330,119 $ (283,884) (21)
Earnings per share:
Basic $.89 $.83 $.06 7 $3.40 $4.27 $(.87) (20)
Diluted $.89 $.83 $.06 7 $3.39 $4.25 $(.86) (20)
Weighted average common shares:
Basic 302,809 312,413 (9,604) (3) 307,288 311,784 (4,496) (1)
Diluted 304,095 313,265 (9,170) (3) 308,339 312,767 (4,428) (1)
Annual dividend rate per common share $1.52 $1.48 $.04 3
FROM CURRENT BUSINESSES (NON-GAAP) (B):
Operating income $ 500,363 $ 474,052 $ 26,311 6 $ 1,972,520 $ 1,916,974 $ 55,546 3
Operating margin (A) 23.4% 23.5% (.1%) - 23.9% 24.0% (.1%) -
Net income $ 270,058 $ 239,994 $ 30,064 13 $ 1,038,110 $ 954,395 $ 83,715 9
Earnings per share:
Basic $.89 $.77 $.12 16 $3.38 $3.06 $.32 10
Diluted $.89 $.77 $.12 16 $3.37 $3.05 $.32 10
(A) Operating margin is calculated by dividing segment income by the corresponding amount of segment revenues and sales.
(B) Current businesses excludes the effects of discontinued operations, early termination of debt, restructuring and other charges, gain on disposal of assets, write-down of
investments, and the reversal of certain income tax contingency reserves.
-more-
2. ALLTEL CORPORATION
CONSOLIDATED STATEMENTS OF INCOME UNDER GAAP-Page 2
(In thousands, except per share amounts)
THREE MONTHS ENDED TWELVE MONTHS ENDED
December 31, December 31, December 31, December 31,
2004 2003 2004 2003
Revenues and sales:
Service revenues $ 1,897,402 $ 1,806,026 $ 7,374,279 $ 7,156,067
Product sales 242,391 207,650 871,862 823,843
Total revenues and sales 2,139,793 2,013,676 8,246,141 7,979,910
Costs and expenses:
Cost of services 604,818 567,946 2,374,220 2,273,598
Cost of products sold 299,603 262,058 1,075,545 1,043,468
Selling, general, administrative and other 402,489 388,290 1,524,165 1,498,122
Depreciation and amortization 332,520 321,330 1,299,691 1,247,748
Restructuring and other charges (873) - 50,892 18,979
Total costs and expenses 1,638,557 1,539,624 6,324,513 6,081,915
Operating income 501,236 474,052 1,921,628 1,897,995
Equity earnings in unconsolidated partnerships 14,970 16,401 68,486 64,373
Minority interest in consolidated partnerships (19,227) (17,093) (80,096) (78,604)
Other income, net 11,360 3,596 34,500 11,068
Interest expense (87,512) (90,881) (352,490) (378,627)
Gain on disposal of assets, write-down of investments and other - 30,999 - 17,933
Income from continuing operations before income taxes 420,827 417,074 1,592,028 1,534,138
Income taxes 150,182 158,139 565,331 580,609
Income from continuing operations 270,645 258,935 1,026,697 953,529
Discontinued operations:
Income from discontinued operations (net of income taxes) - - 19,538 37,072
Gain on sale of discontinued operations (net of income taxes) - - - 323,927
Income before cumulative effect of accounting change 270,645 258,935 1,046,235 1,314,528
Cumulative effect of accounting change (net of income taxes) - - - 15,591
Net income 270,645 258,935 1,046,235 1,330,119
Preferred dividends 25 27 103 111
Net income applicable to common shares $ 270,620 $ 258,908 $ 1,046,132 $ 1,330,008
Basic earnings per share:
Income from continuing operations $.89 $.83 $3.34 $3.06
Income from discontinued operations - - .06 1.16
Cumulative effect of accounting change - - - .05
Net income $.89 $.83 $3.40 $4.27
Diluted earnings per share:
Income from continuing operations $.89 $.83 $3.33 $3.05
Income from discontinued operations - - .06 1.15
Cumulative effect of accounting change - - - .05
Net income $.89 $.83 $3.39 $4.25
-more-
3. ALLTEL CORPORATION
RECONCILIATION OF RESULTS OF OPERATIONS UNDER GAAP TO RESULTS OF OPERATIONS FROM CURRENT BUSINESSES (NON-GAAP)-Page 3
for the three months ended December 31, 2004
(In thousands, except per share amounts)
Corporate
Results of Items Results of Operations
Segment Information
Operations Excluded from Operations Communications and
Under Current from Current Support Intercompany
GAAP Businesses Businesses Wireless Wireline Services Eliminations
Revenues and sales:
Service revenues $ 1,897,402 $ - $ 1,897,402 $ 1,252,773 $ 597,315 $ 81,462 $ (34,148)
Product sales 242,391 - 242,391 73,999 10,460 167,027 (9,095)
Total revenues and sales 2,139,793 - 2,139,793 1,326,772 607,775 248,489 (43,243)
Costs and expenses:
Cost of services 604,818 - 604,818 399,114 173,146 64,297 (31,739)
Cost of products sold 299,603 - 299,603 154,747 8,576 146,997 (10,717)
Selling, general, administrative and other 402,489 - 402,489 318,968 62,466 14,856 6,199
Depreciation and amortization 332,520 - 332,520 193,789 127,921 8,454 2,356
Restructuring and other charges (873) 873 (A) - - - - -
Total costs and expenses 1,638,557 873 1,639,430 1,066,618 372,109 234,604 (33,901)
Operating income 501,236 (873) 500,363 $ 260,154 $ 235,666 $ 13,885 $ (9,342)
Equity earnings in unconsolidated partnerships 14,970 - 14,970
Minority interest in consolidated partnerships (19,227) - (19,227)
Other income, net 11,360 - 11,360
Interest expense (87,512) - (87,512)
Gain on disposal of assets, write-down of investments and other - - -
Income from continuing operations before income taxes 420,827 (873) 419,954
Income taxes 150,182 (286) (F) 149,896
Income from continuing operations 270,645 (587) 270,058
Discontinued operations:
Income from discontinued operations (net of income taxes) - - -
Gain on sale of discontinued operations (net of income taxes) - - -
Income before cumulative effect of accounting change 270,645 (587) 270,058
Cumulative effect of accounting change (net of income taxes) - - -
Net income 270,645 (587) 270,058
Preferred dividends 25 - 25
Net income applicable to common shares $ 270,620 $ (587) $ 270,033
Basic earnings per share:
Income from continuing operations $.89 $- $.89
Income from discontinued operations - - -
Cumulative effect of accounting change - - -
Net income $.89 $- $.89
Diluted earnings per share:
Income from continuing operations $.89 $- $.89
Income from discontinued operations - - -
Cumulative effect of accounting change - - -
Net income $.89 $- $.89
See notes on pages 7 and 8 for a description of the line items marked (A) - (I).
-more-
4. ALLTEL CORPORATION
RECONCILIATION OF RESULTS OF OPERATIONS UNDER GAAP TO RESULTS OF OPERATIONS FROM CURRENT BUSINESSES (NON-GAAP)-Page 4
for the three months ended December 31, 2003
(In thousands, except per share amounts)
Corporate
Results of Items Results of Operations
Segment Information
Operations Excluded from Operations Communications and
Under Current from Current Support Intercompany
GAAP Businesses Businesses Wireless Wireline Services Eliminations
Revenues and sales:
Service revenues $ 1,806,026 $ - $ 1,806,026 $ 1,128,024 $ 605,665 $ 105,910 $ (33,573)
Product sales 207,650 - 207,650 63,908 10,119 141,229 (7,606)
Total revenues and sales 2,013,676 - 2,013,676 1,191,932 615,784 247,139 (41,179)
Costs and expenses:
Cost of services 567,946 - 567,946 350,603 173,751 74,876 (31,284)
Cost of products sold 262,058 - 262,058 131,243 7,495 131,568 (8,248)
Selling, general, administrative and other 388,290 - 388,290 303,033 65,644 13,896 5,717
Depreciation and amortization 321,330 - 321,330 175,446 132,064 9,176 4,644
Restructuring and other charges - - - - - - -
Total costs and expenses 1,539,624 - 1,539,624 960,325 378,954 229,516 (29,171)
Operating income 474,052 - 474,052 $ 231,607 $ 236,830 $ 17,623 $ (12,008)
Equity earnings in unconsolidated partnerships 16,401 - 16,401
Minority interest in consolidated partnerships (17,093) - (17,093)
Other income, net 3,596 - 3,596
Interest expense (90,881) - (90,881)
Gain on disposal of assets, write-down of investments and other 30,999 (30,999) (C) -
Income from continuing operations before income taxes 417,074 (30,999) 386,075
Income taxes 158,139 (12,058) (F) 146,081
Income from continuing operations 258,935 (18,941) 239,994
Discontinued operations:
Income from discontinued operations (net of income taxes) - - -
Gain on sale of discontinued operations (net of income taxes) - - -
Income before cumulative effect of accounting change 258,935 (18,941) 239,994
Cumulative effect of accounting change (net of income taxes) - - -
Net income 258,935 (18,941) 239,994
Preferred dividends 27 - 27
Net income applicable to common shares $ 258,908 $ (18,941) $ 239,967
Basic earnings per share:
Income from continuing operations $.83 $(.06) $.77
Income from discontinued operations - - -
Cumulative effect of accounting change - - -
Net income $.83 $(.06) $.77
Diluted earnings per share:
Income from continuing operations $.83 $(.06) $.77
Income from discontinued operations - - -
Cumulative effect of accounting change - - -
Net income $.83 $(.06) $.77
See notes on pages 7 and 8 for a description of the line items marked (A) - (I).
-more-
5. ALLTEL CORPORATION
RECONCILIATION OF RESULTS OF OPERATIONS UNDER GAAP TO RESULTS OF OPERATIONS FROM CURRENT BUSINESSES (NON-GAAP)-Page 5
for the twelve months ended December 31, 2004
(In thousands, except per share amounts)
Corporate
Results of Items Results of Operations
Segment Information
Operations Excluded from Operations Communications and
Under Current from Current Support Intercompany
GAAP Businesses Businesses Wireless Wireline Services Eliminations
Revenues and sales:
Service revenues $ 7,374,279 $ - $ 7,374,279 $ 4,791,235 $ 2,380,788 $ 346,662 $ (144,406)
Product sales 871,862 - 871,862 286,852 39,021 577,193 (31,204)
Total revenues and sales 8,246,141 - 8,246,141 5,078,087 2,419,809 923,855 (175,610)
Costs and expenses:
Cost of services 2,374,220 - 2,374,220 1,543,576 704,335 257,845 (131,536)
Cost of products sold 1,075,545 - 1,075,545 573,646 28,711 514,239 (41,051)
Selling, general, administrative and other 1,524,165 - 1,524,165 1,201,789 244,327 54,729 23,320
Depreciation and amortization 1,299,691 - 1,299,691 738,837 516,445 34,325 10,084
Restructuring and other charges 50,892 (50,892) (A)(B) - - - - -
Total costs and expenses 6,324,513 (50,892) 6,273,621 4,057,848 1,493,818 861,138 (139,183)
Operating income 1,921,628 50,892 1,972,520 $ 1,020,239 $ 925,991 $ 62,717 $ (36,427)
Equity earnings in unconsolidated partnerships 68,486 - 68,486
Minority interest in consolidated partnerships (80,096) - (80,096)
Other income, net 34,500 - 34,500
Interest expense (352,490) - (352,490)
Gain on disposal of assets, write-down of investments and other - - -
Income from continuing operations before income taxes 1,592,028 50,892 1,642,920
Income taxes 565,331 39,479 (F)(G) 604,810
Income from continuing operations 1,026,697 11,413 1,038,110
Discontinued operations:
Income from discontinued operations (net of income taxes) 19,538 (19,538) (G) -
Gain on sale of discontinued operations (net of income taxes) - - -
Income before cumulative effect of accounting change 1,046,235 (8,125) 1,038,110
Cumulative effect of accounting change (net of income taxes) - - -
Net income 1,046,235 (8,125) 1,038,110
Preferred dividends 103 - 103
Net income applicable to common shares $ 1,046,132 $ (8,125) $ 1,038,007
Basic earnings per share:
Income from continuing operations $3.34 $ .04 $3.38
Income from discontinued operations .06 (.06) -
Cumulative effect of accounting change - - -
Net income $3.40 $(.02) $3.38
Diluted earnings per share:
Income from continuing operations $3.33 $ .04 $3.37
Income from discontinued operations .06 (.06) -
Cumulative effect of accounting change - - -
Net income $3.39 $(.02) $3.37
See notes on pages 7 and 8 for a description of the line items marked (A) - (I).
-more-
6. ALLTEL CORPORATION
RECONCILIATION OF RESULTS OF OPERATIONS UNDER GAAP TO RESULTS OF OPERATIONS FROM CURRENT BUSINESSES (NON-GAAP)-Page 6
for the twelve months ended December 31, 2003
(In thousands, except per share amounts)
Corporate
Results of Items Results of Operations
Segment Information
Operations Excluded from Operations Communications and
Under Current from Current Support Intercompany
GAAP Businesses Businesses Wireless Wireline Services Eliminations
Revenues and sales:
Service revenues $ 7,156,067 $ - $ 7,156,067 $ 4,466,462 $ 2,395,625 $ 428,983 $ (135,003)
Product sales 823,843 - 823,843 261,937 40,454 530,078 (8,626)
Total revenues and sales 7,979,910 - 7,979,910 4,728,399 2,436,079 959,061 (143,629)
Costs and expenses:
Cost of services 2,273,598 - 2,273,598 1,367,812 737,161 299,006 (130,381)
Cost of products sold 1,043,468 - 1,043,468 536,648 29,131 486,936 (9,247)
Selling, general, administrative and other 1,498,122 - 1,498,122 1,154,961 259,406 60,511 23,244
Depreciation and amortization 1,247,748 - 1,247,748 670,978 526,508 36,191 14,071
Restructuring and other charges 18,979 (18,979) (D) - - - - -
Total costs and expenses 6,081,915 (18,979) 6,062,936 3,730,399 1,552,206 882,644 (102,313)
Operating income 1,897,995 18,979 1,916,974 $ 998,000 $ 883,873 $ 76,417 $ (41,316)
Equity earnings in unconsolidated partnerships 64,373 - 64,373
Minority interest in consolidated partnerships (78,604) - (78,604)
Other income, net 11,068 - 11,068
Interest expense (378,627) - (378,627)
Gain on disposal of assets, write-down of investments and other 17,933 (17,933) (C)(E) -
Income from continuing operations before income taxes 1,534,138 1,046 1,535,184
Income taxes 580,609 180 (F) 580,789
Income from continuing operations 953,529 866 954,395
Discontinued operations:
Income from discontinued operations (net of income taxes) 37,072 (37,072) (H) -
Gain on sale of discontinued operations (net of income taxes) 323,927 (323,927) (H) -
Income before cumulative effect of accounting change 1,314,528 (360,133) 954,395
Cumulative effect of accounting change (net of income taxes) 15,591 (15,591) (I) -
Net income 1,330,119 (375,724) 954,395
Preferred dividends 111 - 111
Net income applicable to common shares $ 1,330,008 $ (375,724) $ 954,284
Basic earnings per share:
Income from continuing operations $3.06 $- $3.06
Income from discontinued operations 1.16 (1.16) -
Cumulative effect of accounting change .05 (.05) -
Net income $4.27 $(1.21) $3.06
Diluted earnings per share:
Income from continuing operations $3.05 $- $3.05
Income from discontinued operations 1.15 (1.15) -
Cumulative effect of accounting change .05 (.05) -
Net income $4.25 $(1.20) $3.05
See notes on pages 7 and 8 for a description of the line items marked (A) - (I).
-more-
7. ALLTEL CORPORATION
NOTES TO RECONCILIATIONS OF RESULTS OF OPERATIONS UNDER GAAP TO RESULTS OF OPERATIONS FROM CURRENT BUSINESSES (NON-GAAP)-Page 7
As disclosed in the Company's Form 8-K filed on January 21, 2005, ALLTEL has presented in this earnings release results of operations from current businesses which exclude
the effects of discontinued operations, early termination of debt, restructuring and other charges, gain on disposal of assets, write-down of investments, and the reversal of certain
income tax contingency reserves. ALLTEL’s purpose for excluding items from the current business measures is to focus on ALLTEL’s true earnings capacity associated with
providing telecommunication services. Management believes the items excluded from the current business measures are related to strategic activities or other events, specific to
the time and opportunity available, and, accordingly, should be excluded when evaluating the trends of the Company’s operations.
ALLTEL believes that presenting the current business measures assists investors in assessing the true business performance of the Company by clarifying for investors the
effects that certain items such as asset sales, restructuring expenses and other business consolidation costs arising from past acquisition and restructuring activities had on the
Company’s GAAP consolidated results of operations. The Company uses results from current businesses as management’s primary measure of the performance of its business
segments. ALLTEL management, including the chief operating decision-maker, uses the current business measures consistently for all purposes, including internal reporting
purposes, the evaluation of business objectives, opportunities and performance and the determination of management compensation.
As the Company evaluates segment performance based on segment income, which is computed as revenues and sales less operating expenses, the restructuring and other
charges, gain on disposal of assets, write-down of investments and debt prepayment penalties have not been allocated to the business segments. In addition, none of the non-
operating items such as equity earnings in unconsolidated partnerships, minority interest expense, other income, net, interest expense and income taxes have been allocated to
the segments.
(A) The Company recorded a $0.9 million reduction in the liabilities associated with the restructuring efforts initiated in the first quarter of 2004 (see Note B), consisting of $0.7 million
in employee relocation expenses and $0.2 million in severance and employee benefit costs.
(B) The Company announced its plans to reorganize its operating structure and exit its CLEC operations in the Jacksonville, Florida market. In connection with these activities, the
Company recorded a restructuring charge of $29.3 million consisting of severance and employee benefit costs related to a planned workforce reduction, employee relocation
costs, lease termination and other restructuring-related costs. The Company also recorded a $2.3 million reduction in the liabilities associated with various restructuring activities
initiated prior to 2003. In addition, the Company recorded a write-down of $24.8 million in the carrying value of certain corporate and regional facilities to fair value in conjunction
with the proposed leasing or sale of those facilities.
(C) The Company recorded a pretax gain of $31.0 million from the sale of certain assets and related liabilities, including selected customer contracts and capitalized software
development costs, associated with the Company's telecommunications information services operations.
(D) These charges included severance and employee benefit costs of $8.5 million related to a planned workforce reduction, primarily resulting from the closing of certain call center
locations. The Company also recorded a $2.7 million reduction in the liabilities associated with various restructuring activities initiated prior to 2003. ALLTEL also wrote off $13.2
million of certain capitalized software development costs that had no alternative future use or functionality.
(E) ALLTEL recorded pretax write-downs totaling $6.0 million to reflect other-than-temporary declines in the fair value of certain investments in unconsolidated limited partnerships.
In addition, the Company retired, prior to its stated maturity dates, $249.1 million of long-term debt, representing all of the long-term debt outstanding under the Rural Utilities
Services, Rural Telephone Bank and Federal Financing Bank programs. In connection with the early retirement of the debt, the Company incurred pretax termination fees of $7.1
million.
(F) Tax-related effect of the items discussed in Notes A - E above.
-more-
8. ALLTEL CORPORATION
NOTES TO RECONCILIATIONS OF RESULTS OF OPERATIONS UNDER GAAP TO RESULTS OF OPERATIONS FROM CURRENT BUSINESSES (NON-GAAP)-Page 8
(G) During the third quarter of 2004, the Internal Revenue Service (“IRS”) completed its fieldwork related to the audits of the Company’s consolidated federal income tax returns for the
fiscal years 1997 through 2001. As a result of the IRS completing this phase of their audits, ALLTEL reassessed its income tax contingency reserves related to the periods under
examination. Based upon this reassessment, ALLTEL recorded a $129.3 million reduction in its income tax contingency reserves in the third quarter of 2004. The corresponding
effects of the reversal of these tax contingencies resulted in a reduction in goodwill of $94.5 million and a reduction in income tax expense associated with continuing operations of
$19.7 million. In addition, $15.1 million of the income tax contingency reserves reversed related to the financial services division of ALLTEL’s information services subsidiary,
ALLTEL Information Services, Inc., that was sold to Fidelity National Financial Inc. (“Fidelity National”) on April 1, 2003. (See Note H.) Pursuant to the terms of the sale
agreement, ALLTEL retained, as of the date of sale, all income tax liabilities related to the sold operations and agreed to indemnify Fidelity National from any future tax liability
imposed on the financial services division for periods prior to the date of sale. The adjustment of the tax contingency reserves related to the disposed financial services division
has been reported as “discontinued operations” in the Company’s consolidated financial statements for the twelve months ended December 31, 2004. Discontinued operations for
the twelve months ended December 31, 2004 also included a tax benefit of $4.4 million attributable to a foreign tax credit carryback recognized as a result of the IRS audits.
(H) Eliminates the effects of discontinued operations. On April 1, 2003, ALLTEL completed the sale of the financial services division of its information services subsidiary, ALLTEL
Information Services, Inc., to Fidelity National, for $1.05 billion received as $775.0 million in cash and $275.0 million in Fidelity National common stock. As part of this transaction,
Fidelity National acquired ALLTEL’s mortgage servicing, retail and wholesale banking and commercial lending operations, as well as the community/regional bank division.
(I) Represents the cumulative effect of the change in accounting resulting from the Company's adoption of Statement of Financial Accounting Standards (quot;SFASquot;) No. 143,
“Accounting for Asset Retirement Obligationsquot;. In accordance with federal and state regulations, depreciation expense for ALLTEL’s wireline operations historically included an
additional provision for cost of removal. For ALLTEL's wireline operations in Kentucky and Nebraska not subject to SFAS No. 71, “Accounting for the Effects of Certain Types of
Regulation”, effective with the adoption of SFAS No. 143, the Company ceased recognition of the cost of removal provision in depreciation expense and eliminated the cumulative
cost of removal included in accumulated depreciation because it did not meet the recognition and measurement principles of an asset retirement obligation under SFAS No. 143.
As a result of a Federal Communications Commission ruling, ALLTEL continues to record a regulatory liability for cost of removal for its wireline subsidiaries that follow the
accounting prescribed by SFAS No. 71.
-more-
9. ALLTEL CORPORATION
SUPPLEMENTAL OPERATING INFORMATION-Page 9
(Dollars in thousands, except per customer amounts)
THREE MONTHS ENDED TWELVE MONTHS ENDED
Increase Increase
December 31, December 31, (Decrease) December 31, December 31, (Decrease)
2004 2003 Amount % 2004 2003 Amount %
Wireless:
Controlled POPs 62,313,192 60,368,281 1,944,911 3
Customers 8,626,487 8,023,425 603,062 8
Penetration rate 13.8% 13.3% .5% 4
Average customers 8,481,561 7,956,723 524,838 7 8,295,939 7,834,470 461,469 6
Gross customer additions:
Internal 690,811 696,888 (6,077) (1) 2,720,339 2,709,369 10,970 -
Acquired 92,345 - 92,345 - 92,345 147,462 (55,117) (37)
Total 783,156 696,888 86,268 12 2,812,684 2,856,831 (44,147) (2)
Net customer additions:
Internal 139,415 95,374 44,041 46 510,717 274,365 236,352 86
Acquired 92,345 - 92,345 - 92,345 147,462 (55,117) (37)
Total 231,760 95,374 136,386 143 603,062 421,827 181,235 43
Customer acquisition costs:
Product sales $ (50,530) $ (45,486) $ (5,044) (11) $ (209,874) $ (176,429) $ (33,445) (19)
Cost of products sold 80,557 76,980 3,577 5 322,737 296,757 25,980 9
Selling and marketing expenses 198,572 190,854 7,718 4 743,889 714,026 29,863 4
Total $ 228,599 $ 222,348 $ 6,251 3 $ 856,752 $ 834,354 $ 22,398 3
Cost to acquire a new customer (A) $331 $319 $12 4 $315 $308 $7 2
Cash costs:
Product sales $ (73,999) $ (63,908) $ (10,091) (16) $ (286,852) $ (261,937) $ (24,915) (10)
Cost of services 399,114 350,603 48,511 14 1,543,576 1,367,812 175,764 13
Cost of products sold 154,747 131,243 23,504 18 573,646 536,648 36,998 7
Selling, general, administrative and other 318,968 303,033 15,935 5 1,201,789 1,154,961 46,828 4
Total 798,830 720,971 77,859 11 3,032,159 2,797,484 234,675 8
Less customer acquisition costs 228,599 222,348 6,251 3 856,752 834,354 22,398 3
Total $ 570,231 $ 498,623 $ 71,608 14 $ 2,175,407 $ 1,963,130 $ 212,277 11
Cash cost per unit per month, excluding
customer acquisition costs (B) $22.41 $20.89 $1.52 7 $21.85 $20.88 $.97 5
Revenues:
Service revenues $ 1,252,773 $ 1,128,024 $ 124,749 11 $ 4,791,235 $ 4,466,462 $ 324,773 7
Less wholesale revenues 94,748 91,584 3,164 3 372,446 387,471 (15,025) (4)
Retail revenues $ 1,158,025 $ 1,036,440 $ 121,585 12 $ 4,418,789 $ 4,078,991 $ 339,798 8
Average revenue per customer per month (C) $49.24 $47.26 $1.98 4 $48.13 $47.51 $.62 1
Retail revenue per customer per month (D) $45.51 $43.42 $2.09 5 $44.39 $43.39 $1.00 2
Retail minutes of use per customer per month (E) 534 406 128 32 494 375 119 32
Postpay churn 1.68% 1.96% (.28%) (14) 1.74% 2.09% (.35%) (17)
Total churn 2.17% 2.53% (.36%) (14) 2.23% 2.59% (.36%) (14)
Service revenue operating margin (F) 20.8% 20.5% .3% 1 21.3% 22.3% (1.0%) (4)
Capital expenditures (G) $270,236 $223,242 $46,994 21 $797,106 $788,430 $8,676 1
(A) Cost to acquire a new customer is calculated by dividing the sum of the GAAP reported product sales, cost of products sold and sales and marketing expenses (included within quot;Selling, general,
administrative and otherquot;), as reported in the Consolidated Statements of Income, by the number of internal gross customer additions in the period. Customer acquisition costs exclude amounts
related to the Company's customer retention efforts.
(B) Cash cost per unit per month, excluding customer acquisition costs, is calculated by dividing the sum of the GAAP reported product sales, cost of services, cost of products sold, selling, general,
administrative and other expenses as reported in the Consolidated Statements of Income, less customer acquisition costs, by the number of average customers for the period.
(C) Average revenue per customer per month is calculated by dividing wireless service revenues by average customers for the period.
(D) Retail revenue per customer per month is calculated by dividing wireless retail revenues (service revenues less wholesale revenues) by average customers for the period.
(E) Retail minutes of use per customer per month represents the average monthly minutes that ALLTEL's customers use on both the Company's network and while roaming on other carriers' networks.
(F) Service revenue operating margin is calculated by dividing wireless segment income by wireless service revenues.
(G) Includes capitalized software development costs.
-more-
10. ALLTEL CORPORATION
SUPPLEMENTAL OPERATING INFORMATION-Page 10
(Dollars in thousands, except per customer amounts)
THREE MONTHS ENDED TWELVE MONTHS ENDED
Increase Increase
December 31, December 31, (Decrease) December 31, December 31, (Decrease)
2004 2003 Amount % 2004 2003 Amount %
Wireline:
Customers 3,009,388 3,095,635 (86,247) (3)
Average customers 3,024,635 3,108,589 (83,954) (3) 3,061,529 3,136,777 (75,248) (2)
DSL customers 243,325 153,028 90,297 59
Average revenue per customer per month (H) $66.98 $66.03 $.95 1 $65.87 $64.72 $1.15 2
Capital expenditures (G) $100,730 $115,964 $(15,234) (13) $336,498 $386,235 $(49,737) (13)
Communications support services:
Long-distance customers 1,770,852 1,680,181 90,671 5
Capital expenditures (G) $5,738 $3,738 $2,000 54 $15,150 $18,999 $(3,849) (20)
Consolidated:
Equity free cash flow (I) $225,693 $218,043 $7,650 4 $1,180,072 $1,007,733 $172,339 17
Capital expenditures (G) $376,885 $343,281 $33,604 10 $1,157,729 $1,194,410 $(36,681) (3)
Total assets $16,603,736 $16,661,138 $(57,402) -
(G) Includes capitalized software development costs.
(H) Average revenue per customer per month is calculated by dividing total wireline revenues by average customers for the period.
(I) Equity free cash flow is calculated as the sum of net income from current businesses plus depreciation and amortization less capital expenditures which includes capitalized software
development costs as indicated in Note G.
-more-
11. ALLTEL CORPORATION
CONSOLIDATED BALANCE SHEETS UNDER GAAP-Page 11
(In thousands)
ASSETS LIABILITIES AND SHAREHOLDERS' EQUITY
December 31, December 31, December 31, December 31,
2004 2003 2004 2003
CURRENT ASSETS: CURRENT LIABILITIES:
Cash and short-term investments $ 484,934 $ 657,764 Current maturities of long-term debt $ 224,958 $ 277,235
Accounts receivable (less allowance for Accounts payable 448,161 479,786
doubtful accounts of $53,606 and Advance payments and customer deposits 219,338 205,277
$46,333, respectively) 912,665 890,015 Accrued taxes 158,197 114,618
Inventories 156,785 122,133 Accrued dividends 105,922 116,162
Prepaid expenses and other 62,383 59,210 Accrued interest 120,259 107,085
Other current liabilities 183,523 192,504
Total current assets 1,616,767 1,729,122
Total current liabilities 1,460,358 1,492,667
Investments 804,861 722,698
Goodwill 4,875,718 4,854,263
Other intangibles 1,306,140 1,336,956
Long-term debt 5,352,422 5,581,243
Deferred income taxes 1,715,119 1,417,667
PROPERTY, PLANT AND EQUIPMENT: Other liabilities 947,172 1,147,364
Land 278,084 259,180
Buildings and improvements 1,134,824 1,052,994
Wireline 6,735,748 6,514,694
Wireless 5,763,965 5,255,820
Information processing 1,048,446 946,749 SHAREHOLDERS' EQUITY:
Other 489,936 482,255 Preferred stock 307 348
Under construction 385,283 398,232 Common stock 302,268 312,644
Additional paid-in capital 197,902 750,131
Total property, plant and equipment 15,836,286 14,909,924 Unrealized holding gain on investments 153,926 73,634
Less accumulated depreciation 8,288,195 7,289,145 Foreign currency translation adjustment 482 569
Retained earnings 6,473,780 5,884,871
Net property, plant and equipment 7,548,091 7,620,779
Total shareholders' equity 7,128,665 7,022,197
Other assets 452,159 397,320
TOTAL LIABILITIES AND
TOTAL ASSETS $ 16,603,736 $ 16,661,138 SHAREHOLDERS' EQUITY $ 16,603,736 $ 16,661,138
-more-
12. ALLTEL CORPORATION
CONSOLIDATED STATEMENTS OF CASH FLOWS UNDER GAAP-Page 12
(In thousands)
THREE MONTHS ENDED TWELVE MONTHS ENDED
December 31, December 31, December 31, December 31,
2004 2003 2004 2003
Net Cash Provided from Operations:
Net income $ 270,645 $ 258,935 $ 1,046,235 $ 1,330,119
Adjustments to reconcile net income to net cash provided from operations:
Income from discontinued operations - - (19,538) (360,999)
Cumulative effect of accounting change - - - (15,591)
Depreciation and amortization 332,520 321,330 1,299,691 1,247,748
Provision for doubtful accounts 47,601 42,152 184,871 184,670
Non-cash portion of restructuring and other charges - - 25,569 13,245
Non-cash portion of gain on disposal of assets, write-down of
investments and other - (30,999) - (25,035)
Increase in deferred income taxes 74,794 83,536 263,390 225,021
Reversal of income tax contingency reserves - - (19,656) -
Other, net (5,861) (9,903) (14,336) (11,403)
Changes in operating assets and liabilities, net of the effects of
acquisitions and dispositions:
Accounts receivable (41,856) 9,877 (206,132) (79,681)
Inventories (44,750) 21,817 (33,842) 17,141
Accounts payable 65,854 53,692 (27,174) 21,803
Other current liabilities 6,490 (12,708) 70,602 30,177
Other, net (82,646) (113,555) (102,831) (102,461)
Net cash provided from operations 622,791 624,174 2,466,849 2,474,754
Cash Flows from Investing Activities:
Additions to property, plant and equipment (368,122) (331,221) (1,125,402) (1,137,716)
Additions to capitalized software development costs (8,763) (12,060) (32,327) (56,694)
Additions to investments (423) (2,705) (3,228) (13,532)
Purchases of property, net of cash acquired (185,136) - (185,136) (160,560)
Proceeds from the sale of assets - 46,072 - 46,072
Proceeds from the return on or sale of investments 21,497 14,046 88,612 48,348
Other, net (313) (7,833) (907) 8,140
Net cash used in investing activities (541,260) (293,701) (1,258,388) (1,265,942)
Cash Flows from Financing Activities:
Dividends on preferred and common stock (122,223) (109,214) (467,570) (436,391)
Reductions in long-term debt (22,246) (19,146) (277,240) (763,429)
Distributions to minority investors (17,240) (23,085) (66,917) (67,551)
Repurchases of common stock (88,419) - (595,350) -
Common stock issued 5,146 18,205 25,873 49,131
Net cash used in financing activities (244,982) (133,240) (1,381,204) (1,218,240)
Net cash provided from (used in) discontinued operations - (106,376) - 531,791
Effect of exchange rate changes on cash and short-term investments - 5 (87) 760
Increase (decrease) in cash and short-term investments (163,451) 90,862 (172,830) 523,123
Cash and Short-term Investments:
Beginning of the period 648,385 566,902 657,764 134,641
End of the period $ 484,934 $ 657,764 $ 484,934 $ 657,764
-more-
13. ALLTEL CORPORATION
RECONCILIATIONS OF RESULTS OF OPERATIONS UNDER GAAP TO RESULTS OF OPERATIONS FROM CURRENT BUSINESSES (NON-GAAP)-Page 13
(In thousands)
THREE MONTHS ENDED TWELVE MONTHS ENDED
December 31, December 31, December 31, December 31,
2004 2003 2004 2003
Net cash provided from operations $ 622,791 $ 624,174 $ 2,466,849 $ 2,474,754
Adjustments to reconcile to net income under GAAP:
Income from discontinued operations - - 19,538 360,999
Cumulative effect of accounting change - - - 15,591
Depreciation and amortization expense (332,520) (321,330) (1,299,691) (1,247,748)
Provision for doubtful accounts (47,601) (42,152) (184,871) (184,670)
Non-cash portion of restructuring and other charges - - (25,569) (13,245)
Non-cash portion of gain on disposal of assets, write-down of
investments and other - 30,999 - 25,035
Increase in deferred income taxes (74,794) (83,536) (263,390) (225,021)
Reversal of income tax contingency reserves - - 19,656 -
Other non-cash changes, net 5,861 9,903 14,336 11,403
Changes in operating assets and liabilities, net of the
effects of acquisitions and dispositions 96,908 40,877 299,377 113,021
Net income under GAAP 270,645 258,935 1,046,235 1,330,119
Adjustments to reconcile to net income from current businesses:
Restructuring and other charges, net of tax (587) - 31,069 9,449
Gain on disposal of assets, write-down of investments and other, net of tax - (18,941) - (8,583)
Reversal of income tax contingency reserves - - (19,656) -
Cumulative effect of accounting change - - - (15,591)
Income from discontinued operations - - (19,538) (360,999)
Net income from current businesses 270,058 239,994 1,038,110 954,395
Adjustments to reconcile to equity free cash flow from current businesses:
Depreciation and amortization expense 332,520 321,330 1,299,691 1,247,748
Capital expenditures (376,885) (343,281) (1,157,729) (1,194,410)
Equity free cash flow from current businesses $ 225,693 $ 218,043 $ 1,180,072 $ 1,007,733
-end-