1. Financial Review
Consolidated Statements of Income and Comprehensive Income.......................................................................................19
Consolidated Balance Sheet .................................................................................................................................................................................21
Consolidated Statement of Cash Flows......................................................................................................................................................23
Business Segment Information...........................................................................................................................................................................25
Notes to Financial Statements............................................................................................................................................................................26
Eleven-Year Financial Summary .........................................................................................................................................................................36
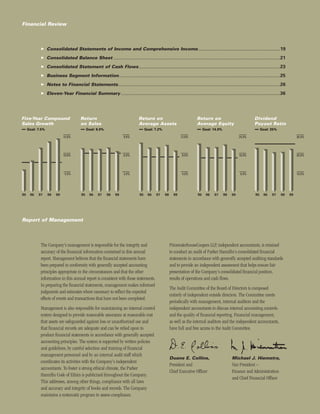
Five-Year Compound Return Return on Return on Dividend
Sales Growth on Sales Average Assets Average Equity Payout Ratio
Goal: 7.5% Goal: 6.0% Goal: 7.2% Goal: 14.0% Goal: 25%
15.0% 9.0% 12.0% 24.0% 30.0%
10.0% 6.0% 8.0% 16.0% 20.0%
5.0% 3.0% 4.0% 8.0% 10.0%
95 96 97 98 99 95 96 97 98 99 95 96 97 98 99 95 96 97 98 99 95 96 97 98 99
Report of Management
The Company's management is responsible for the integrity and PricewaterhouseCoopers LLP, independent accountants, is retained
accuracy of the financial information contained in this annual to conduct an audit of Parker Hannifin's consolidated financial
report. Management believes that the financial statements have statements in accordance with generally accepted auditing standards
been prepared in conformity with generally accepted accounting and to provide an independent assessment that helps ensure fair
principles appropriate in the circumstances and that the other presentation of the Company's consolidated financial position,
information in this annual report is consistent with those statements. results of operations and cash flows.
In preparing the financial statements, management makes informed
The Audit Committee of the Board of Directors is composed
judgments and estimates where necessary to reflect the expected
entirely of independent outside directors. The Committee meets
effects of events and transactions that have not been completed.
periodically with management, internal auditors and the
Management is also responsible for maintaining an internal control independent accountants to discuss internal accounting controls
system designed to provide reasonable assurance at reasonable cost and the quality of financial reporting. Financial management,
that assets are safeguarded against loss or unauthorized use and as well as the internal auditors and the independent accountants,
that financial records are adequate and can be relied upon to have full and free access to the Audit Committee.
produce financial statements in accordance with generally accepted
accounting principles. The system is supported by written policies
and guidelines, by careful selection and training of financial
management personnel and by an internal audit staff which
Duane E. Collins, Michael J. Hiemstra,
coordinates its activities with the Company's independent
President and Vice President –
accountants. To foster a strong ethical climate, the Parker
Chief Executive Officer Finance and Administration
Hannifin Code of Ethics is publicized throughout the Company.
and Chief Financial Officer
This addresses, among other things, compliance with all laws
and accuracy and integrity of books and records. The Company
maintains a systematic program to assess compliance.
2. M A N A G E M E N T ’ S D I S C U S S I O N & A N A LY S I S A N D F I N A N C I A L S TAT E M E N T S
Discussion of Statement of Income
The Consolidated Statement of Income summarizes the Interest and other income, net was $5.1 million in 1999
Company’s operating performance over the last three fiscal years. compared to $6.8 million in 1998 and $5.6 million in 1997. Fiscal 1999
includes $1.7 million in interest income related to an IRS refund and fiscal
Net Sales of $4.96 billion for 1999 were 7.0 percent higher than the
1998 included $3.8 million of interest income from a settlement with the IRS.
$4.63 billion for 1998. Acquisitions accounted for approximately one-half of
this increase. The Aerospace operations experienced continued strong demand (Loss) gain on disposal of assets was a $2.4 million loss in
in commercial aircraft build rates while the Industrial operations experienced 1999, a $.1 million gain in 1998 and a $3.0 million gain in 1997. The 1997
reduced order demand within most of its markets. Within the Industrial gain includes $17.1 million income from the sale of real estate in California.
operations, the European markets weakened in the latter part of 1999 while the This income was substantially offset by $13.3 million accrued for exit costs and
Latin American markets operated in a weak economy throughout most of 1999. charges for impaired assets related to the relocation of the corporate headquarters.
The Company continued to penetrate markets in the Asia Pacific region.
Income taxes decreased to an effective rate of 35.0 percent in 1999,
Volume increases within International operations were partially offset by
compared to 35.9 percent in 1998 and 35.5 percent in 1997. The decrease in the
currency rate changes.
rate from 1998 to 1999 was the result of increased tax benefits based on the
Net sales of $4.63 billion for 1998 were 13.2 percent higher than the export of products manufactured in the U.S. The increase in the rate from 1997
$4.09 billion for 1997. Acquisitions accounted for approximately one-fifth of to 1998 was the result of receiving no tax benefit for one of the R&D charges.
this increase. The Industrial operations experienced continued strong order
Extraordinary item - extinguishment of debt —
demand within the heavy-duty truck, construction equipment, factory
On June 30, 1998 the Company called for redemption all of its outstanding
automation, telecommunications and refrigeration markets. The European
$100 million, 10.375 percent debentures due 1999-2018.
operations continued to grow and the Company continued to penetrate markets
Net Income of $310.5 million for 1999 was 2.8 percent lower than 1998.
in Asia Pacific and Latin American regions. Volume increases within
Net income of $319.6 million for 1998 was 16.6 percent higher than 1997.
International operations were partially offset by currency rate changes.
Net income as a percentage of sales was 6.3 percent in 1999, compared to
The Aerospace operations experienced strong demand within the commercial
6.9 percent in 1998 and 6.7 percent in 1997.
transport, business jet and general aviation markets.
Year 2000 considerations — The Company has been taking
The Company is anticipating the North American industrial economy for the
actions to assure that its computerized products and systems and all external
next year will stay relatively flat. European and Latin American markets are
interfaces are year 2000 compliant. These actions are part of a formal
expected to be weak in the first half of fiscal 2000 while the Company expects
information technology initiative that the Company began several years ago.
to continue to penetrate markets in the Asia Pacific region. The Aerospace
The cost for these actions is not material to the Company’s results of operations.
operations expect the commercial aviation OEM business to decline while the
As of July 31, 1999, virtually all internal standard application systems, including
defense business is expected to remain relatively constant.
all information systems plus any equipment or embedded systems, are year
Gross profit margin was 22.0 percent in 1999 compared to 23.4
2000 compliant. The few systems that are currently not compliant consist of
percent in 1998 and 22.9 percent in 1997. Cost of sales for 1998 included a
noncritical data processing systems, which are expected to be compliant by the
non-cash, non-recurring charge of $15.8 million for in-process R&D purchased
end of the first quarter of fiscal 2000.
as part of two acquisitions. The margin decline in 1999 is primarily the result of
In addition, the Company contacted its key suppliers, customers, distributors
the underabsorption of overhead costs and pricing pressure. In addition, gross
and financial service providers regarding their year 2000 status. Follow-up
margins continue to be affected by recently acquired operations contributing
inquiries and audits with such key third parties were conducted as warranted.
lower margins.
The results of the inquiries and audits indicate that substantially all key third
The improvement in 1998 is primarily the result of better absorption of fixed
parties will be year 2000 compliant on a timely basis. The Company does not
costs due to higher volume and the benefits of continued integration of prior-
anticipate altering its purchasing or production levels as a result of any key third
year acquisitions. The improvement was partially offset by recently acquired
parties year 2000 noncompliance.
operations contributing lower margins, as their integration continues. In
While management does not expect that the consequences of any unsuccessful
addition, gross margins were affected by the Asian financial crisis and the
modifications would significantly affect the financial position, liquidity, or
depressed worldwide semiconductor market.
results of operations of the Company, there can be no assurance that failure to
Selling, general and administrative expenses as a percent
be fully compliant by 2000 would not have an impact on the Company.
of sales decreased to 11.1 percent, from 11.5 percent in 1998, and 11.6 percent
Euro preparations — The Company upgraded its systems to
in 1997. As volume increased these expenses remained relatively unchanged,
accommodate the Euro currency in 1999. The cost of this upgrade was
except for decreased costs from incentive programs.
immaterial to the Company's financial results.
Interest expense increased by $10.9 million in 1999 and $6.1 million
in 1998 due to increased borrowings to complete acquisitions.
18
3. Consolidated Statement of Income (Dollars in thousands, except per share amounts)
For the years ended June 30, 1998 1997
1999
$ 4,633,023 $ 4,091,081
Net Sales $ 4,958,800
Cost of sales 3,550,992 3,152,988
3,869,370
Gross profit 1,082,031 938,093
1,089,430
Selling, general and administrative expenses 532,134 475,180
550,681
549,897 462,913
Income from Operations 538,749
Other income (deductions):
Interest expense (52,787) (46,659)
(63,697)
Interest and other income, net 6,783 5,623
5,056
(Loss) gain on disposal of assets 95 2,990
(2,414)
(45,909) (38,046)
(61,055)
Income before income taxes 503,988 424,867
477,694
Income taxes (Note 3) 180,762 150,828
167,193
Income before extraordinary item 323,226 274,039
310,501
Extraordinary item - extinguishment of debt (Note 7) (3,675)
$ 319,551 $ 274,039
Net Income $ 310,501
Earnings per Share (Note 4)
Basic earnings per share before extraordinary item $ 2.91 $ 2.46
$ 2.85
Extraordinary item – extinguishment of debt (.03)
Basic earnings per share $ 2.88 $ 2.46
$ 2.85
Diluted earnings per share before extraordinary item $ 2.88 $ 2.44
$ 2.83
Extraordinary item – extinguishment of debt (.03)
Diluted earnings per share $ 2.85 $ 2.44
$ 2.83
The accompanying notes are an integral part of the financial statements.
Consolidated Statement of Comprehensive Income (Dollars in thousands)
For the years ended June 30, 1998 1997
1999
$ 319,551 $ 274,039
Net Income $ 310,501
Other comprehensive income (loss), net of taxes:
Foreign currency translation adjustment (32,681) (48,070)
(32,832)
$ 286,870 $ 225,969
Comprehensive Income $ 277,669
The accompanying notes are an integral part of the financial statements.
19
4. M A N A G E M E N T ’ S D I S C U S S I O N & A N A LY S I S A N D F I N A N C I A L S TAT E M E N T S
Discussion of Balance Sheet
Accounts payable, trade decreased $25.1 million in 1999 due
The Consolidated Balance Sheet shows the Company's financial
primarily to the timing of payments made at the Corporate level as well as lower
position at year end, compared with the previous year end. This statement
balances in the International Industrial operations due to lower production levels.
provides information to assist in assessing factors such as the Company's
liquidity and financial resources.
Accrued payrolls and other compensation decreased
$18.1 million in 1999 primarily as a result of decreased headcount and
The effect of currency rate changes during the year caused a $32.8 million
incentive plans which are based on sales and earnings.
decrease in Shareholders’ equity. These rate changes also caused significant
decreases in accounts receivable, inventories, goodwill and plant and
Accrued domestic and foreign taxes increased to
equipment, as well as significant decreases in accounts payable and the various
$52.6 million in 1999 from $34.4 million in 1998 primarily due to lower
accrual accounts.
estimated tax payments in 1999.
Working capital and the current ratio were as follows:
Long-term debt increased $211.8 million in 1999 primarily due to
Working Capital (millions) 1998 increased borrowings to fund acquisitions and the issuance of the ESOP debt
1999
guarantee. See the Cash Flows From Financing Activities section on page 22 for
Current Assets $ 1,780
$ 1,775
further discussion.
Current Liabilities 989
755
Working Capital 791
1,020
The Company's goal is to maintain no less than an quot;Aquot; rating on senior debt to
Current Ratio 1.8
2.4
ensure availability and reasonable cost of external funds. To meet this objective,
the Company has established a financial goal of maintaining a ratio of debt to
debt-equity of 30 to 33 percent.
Accounts receivable are primarily due from customers for sales of
Debt to Debt-Equity Ratio (millions) 1998
1999
product ($684.2 million at June 30, 1999, compared to $642.3 million at June
Debt $ 778
30, 1998). The current year increase in accounts receivable is primarily due to $ 785
Debt & Equity 2,462
2,639
acquisitions and increased volume. Days sales outstanding for the Company
Ratio 31.6%
29.8%
increased slightly to 47 days in 1999 from 46 days in 1998. An increase in the
allowance for doubtful accounts in 1999 is primarily due to receivables
obtained through acquisitions.
In fiscal 2000 additional borrowings are not anticipated for the stock repurchase
Inventories decreased to $915.1 million at June 30, 1999, compared to program, capital investments, or for working capital purposes, but may be
$944.3 million a year ago, with the decline occurring primarily in the utilized for acquisitions.
Industrial operations where management focused on reducing inventory levels
Pensions and other postretirement benefits increased
to align with current customer demand. The decline in inventory was partially
4.1 percent in 1999. These costs are explained further in Note 8 to the
offset by an increase in inventory due to acquisitions. Months supply of
Consolidated Financial Statements.
inventory on hand at June 30, 1999 decreased to 3.5 months from 3.7 months
at June 30, 1998. Other liabilities increased to $65.3 million in 1999 from $44.2 million
in 1998 primarily due to increases in deferred compensation plans.
Plant and equipment, net of accumulated depreciation, increased
$65.6 million in 1999 as a result of acquisitions and capital expenditures which Common stock in treasury decreased to $1.8 million in 1999 from
exceeded annual depreciation. $83.5 million in 1998 due to the sale of treasury shares to the Company’s ESOP
in 1999.
Investments and other assets increased $65.9 million in 1999
primarily as a result of increases in pension assets and the cash surrender value Quantitative and Qualitative Disclosures About
of corporate-owned life insurance contracts. Market Risk — The Company enters into forward exchange contracts
and cross-currency swap agreements to reduce its exposure to fluctuations in
Excess cost of investments over net assets acquired
related foreign currencies. These contracts are with major financial institutions
increased $41.8 million in 1999 as a result of acquisitions, partially offset by
and the risk of loss is considered remote. The Company does not hold or issue
current year amortization. The additional excess cost of investments in 1999 is
derivative financial instruments for trading purposes. In addition, the
being amortized over 15 years.
Company’s foreign locations, in the ordinary course of business, enter into
Notes payable and long-term debt payable within one financial guarantees, through financial institutions, which enable customers
year decreased $204.9 million due to a decrease in commercial paper to be reimbursed in the event of non-performance by the Company. The total
borrowings and the redemption of the Company’s $100 million 10.375% value of open contracts and any risk to the Company as a result of these
debentures in July 1998. arrangements is not material to the Company’s financial position, liquidity
or results of operations.
20
5. Consolidated Balance Sheet (Dollars in thousands)
June 30, 1998
1999
Assets
Current Assets
Cash and cash equivalents $ 30,488
$ 33,277
Accounts receivable, less allowance for doubtful accounts
(1999 - $9,397; 1998 - $9,004) 699,179
738,773
Inventories (Notes 1 and 5):
Finished products 416,034
442,361
Work in process 392,880
347,376
Raw materials 135,357
125,393
944,271
915,130
Prepaid expenses 22,035
22,928
Deferred income taxes (Notes 1 and 3) 84,102
64,576
1,780,075
Total Current Assets 1,774,684
Plant and equipment (Note 1):
Land and land improvements 113,774
125,990
Buildings and building equipment 552,177
592,086
Machinery and equipment 1,560,016
1,678,956
Construction in progress 119,142
109,780
2,345,109
2,506,812
Less accumulated depreciation 1,209,884
1,305,943
1,135,225
1,200,869
Investments and other assets (Note 1) 194,632
260,495
Excess cost of investments over net assets acquired (Note 1) 399,681
441,489
Deferred income taxes (Notes 1 and 3) 15,208
28,351
$ 3,524,821
Total Assets $ 3,705,888
Liabilities and Shareholders’ Equity
Current Liabilities
Notes payable and long-term debt payable within one year (Notes 6 and 7) $ 265,485
$ 60,609
Accounts payable, trade 338,249
313,173
Accrued payrolls and other compensation 163,879
145,745
Accrued domestic and foreign taxes 34,374
52,584
Other accrued liabilities 186,783
182,402
988,770
Total Current Liabilities 754,513
Long-term debt (Note 7) 512,943
724,757
Pensions and other postretirement benefits (Notes 1 and 8) 265,675
276,637
Deferred income taxes (Notes 1 and 3) 29,739
30,800
Other liabilities 44,244
65,319
1,841,371
Total Liabilities 1,852,026
Shareholders’ Equity (Note 9)
Serial preferred stock, $.50 par value, authorized 3,000,000 shares; none issued
Common stock, $.50 par value, authorized 600,000,000 shares;
issued 111,945,179 shares in 1999 and 111,812,025 shares in 1998 at par value 55,906
55,973
Additional capital 139,726
132,227
Retained earnings 1,631,316
1,872,356
Unearned compensation related to guarantee of ESOP debt (Note 7) (112,000)
Accumulated other comprehensive income (loss) (60,026)
(92,858)
1,766,922
1,855,698
Common stock in treasury at cost; 43,836 shares in 1999 and 1,938,762 shares in 1998 (83,472)
(1,836)
1,683,450
Total Shareholders’ Equity 1,853,862
$ 3,524,821
Total Liabilities and Shareholders’ Equity $ 3,705,888
The accompanying notes are an integral part of the financial statements.
21
6. M A N A G E M E N T ’ S D I S C U S S I O N & A N A LY S I S A N D F I N A N C I A L S TAT E M E N T S
Discussion of Cash Flows
The Consolidated Statement of Cash Flows reflects (in thousands) 1998 1997
1999
cash inflows and outflows from the Company's operating, investing and Assets acquired:
financing activities. Accounts receivable $ 39,286 $ 4,549
$ 16,529
Inventories 43,847 13,410
16,173
Cash and cash equivalents increased $2.8 million in 1999 after decreasing Prepaid expenses 1,393 247
2,509
$38.5 million in 1998. Deferred income taxes 1,643 1,576
Plant & equipment 54,718 15,283
17,686
Cash Flows From Operating Activities — The Company's
Other assets 3,762 (1,121)
3,783
largest source of cash continues to be net cash provided by operating activities.
Excess cost of investments
Net cash provided by operating activities in 1999 was a record $459.1 million
over net assets acquired 162,680 11,596
84,589
compared to $320.6 million in 1998. Inventories provided cash of $30.6 million
307,329 45,540
141,269
in 1999 compared to using cash of $185.6 million in 1998. Accrued domestic
Liabilities assumed:
and foreign taxes provided cash of $22.1 million in 1999 after using cash of
Notes payable 8,690 2,050
10,433
$15.3 million in 1998. Accounts receivable used cash of $31.4 million in 1999
Accounts payable 21,841 2,418
10,105
after using cash of $71.0 million in 1998 and Other liabilities provided cash of Accrued payrolls 4,418 471
6,828
$20.7 million compared to providing cash of $8.6 million in 1998. These Accrued taxes 2,840 941
(646)
providers of cash in 1999 were partially offset with cash used by Other assets of Other accrued liabilities 11,421 4,582
3,535
$57.0 million in 1999 after using cash of $31.6 million in 1998. Accounts Long-term debt 9,706 2,454
20,090
payable used cash of $33.1 million in 1999 after providing cash of Pensions and other
$52.9 million in 1998. Accrued payrolls and other compensation used cash of postretirement benefits 477 1,163
471
$21.9 million in 1999 after providing cash of $27.5 million in 1998. Other liabilities 3,033
588
62,426 14,079
51,404
The net cash provided by operating activities in 1998 decreased $71.7 million
Net assets acquired $ 244,903 $ 31,461
$ 89,865
compared to 1997. This decrease was principally due to inventories using cash
of $185.6 million in 1998 compared to $27.0 million in 1997. Other accrued
liabilities used cash of $9.1 million in 1998 compared to providing cash of
Cash Flows From Financing Activities — In 1999 the
$16.0 million in 1997. Accrued domestic and foreign taxes also used cash in
Company decreased its outstanding borrowings by a net total of $148.4 million.
1998 of $15.3 million after providing cash of $4.3 million in 1997. These uses
This amount does not include the Company’s issuance of the ESOP debt
of cash in 1998 were partially offset with cash provided by an increase of
guarantee of $112.0 million which is reflected as a non-cash financing activity.
$45.5 million in Net income in 1998 and a $52.9 million increase in Accounts
The Company issued $225.0 million in medium-term notes during 1999. As of
payable in 1998 compared to an increase of $31.7 million in 1997. In addition,
June 30, 1999, the Company paid down the majority of its commercial paper
the 1998 write-off of purchased in-process R&D of $15.8 million was a non-
borrowings and selected notes payable attributable to the International
cash charge added back to Net income to reconcile to the net cash provided by
operations with the major source of funding for the repayment coming from
operating activities.
the proceeds received from the sale of treasury shares to the ESOP.
Cash Flows From Investing Activities — Net cash used in
In 1998 the Company increased its outstanding borrowings by a net total of
investing activities was $146.1 million lower in 1999 than 1998, primarily due
$264.9 million primarily to fund acquisitions. The majority of the funding was
to Acquisitions using $143.1 million less cash in 1999. Also, Capital
through the issuance of commercial paper. Additional funds were obtained
expenditures decreased by $6.8 million in 1999.
through the issuance of $50.0 million of medium-term notes.
Net cash used in investing activities was $264.4 million greater in 1998 than
Common share activity in 1999 includes the repurchase of stock, the exercise
1997, primarily due to Acquisitions using $201.5 million more cash in 1998.
of stock options and the sale of treasury shares to the ESOP. During 1999 the
Also, Capital expenditures increased $47.8 million in 1998.
Company purchased 1,500,000 shares for treasury and sold 3,055,413 shares
to the ESOP.
To complete Acquisitions the Company utilized cash of $89.9 million in 1999;
cash of $233.0 million and treasury shares valued at $11.9 million in 1998; and
Dividends have been paid for 196 consecutive quarters, including a yearly
cash of $31.5 million in 1997. The net assets of the acquired companies at their
increase in dividends for the last 43 fiscal years. The current annual dividend
respective acquisition dates consisted of the following:
rate is $.68 per share.
In summary, based upon the Company's past performance and current
expectations, management believes the cash flows generated from future operating
activities, combined with the Company's worldwide financial capabilities, will
provide adequate funds to support planned growth and continued improvements
in the Company’s manufacturing facilities and equipment.
22
7. Consolidated Statement of Cash Flows (Dollars in thousands)
For the years ended June 30, 1998 1997
1999
Cash Flows From Operating Activities
Net income $ 319,551 $ 274,039
$ 310,501
Adjustments to reconcile net income to net cash provided by operating activities:
Depreciation 153,633 146,253
164,577
Amortization 29,046 23,580
37,469
Deferred income taxes 7,680 (1,269)
5,718
Foreign currency transaction (gain) loss 3,697 1,947
(2,495)
Loss (gain) on sale of plant and equipment 291 (9,811)
1,886
Write-off of purchased in-process research and development 15,800
Net effect of extraordinary loss 3,675
Changes in assets and liabilities, net of effects from acquisitions and dispositions:
Accounts receivable (71,034) (76,081)
(31,396)
Inventories (185,569) (27,007)
30,606
Prepaid expenses (3,473) (1,234)
2,069
Other assets (31,620) (26,130)
(56,957)
Accounts payable, trade 52,947 31,672
(33,075)
Accrued payrolls and other compensation 27,531 23,929
(21,892)
Accrued domestic and foreign taxes (15,282) 4,282
22,091
Other accrued liabilities (9,129) 16,026
(3,935)
Pensions and other postretirement benefits 14,276 6,823
13,258
Other liabilities 8,579 5,291
20,672
Net cash provided by operating activities 320,599 392,310
459,097
Cash Flows From Investing Activities
Acquisitions (less cash acquired of $2,609 in 1999, $4,260 in 1998 and $1,394 in 1997) (232,953) (31,461)
(89,865)
Capital expenditures (236,945) (189,201)
(230,122)
Proceeds from sale of plant and equipment 7,151 11,307
6,382
Other 3,630 14,624
548
Net cash (used in) investing activities (459,117) (194,731)
(313,057)
Cash Flows From Financing Activities
Proceeds from (payments for) common share activity (96,887) (10,184)
74,076
(Payments of) proceeds from notes payable, net 190,865 (100,655)
(228,896)
Proceeds from long-term borrowings 87,085 9,390
232,886
(Payments of) long-term borrowings (13,054) (30,059)
(152,397)
Dividends paid, net of tax benefit of ESOP shares (66,501) (56,570)
(69,461)
Net cash (used in) provided by financing activities 101,508 (188,078)
(143,792)
Effect of exchange rate changes on cash (1,499) (4,457)
541
Net increase (decrease) in cash and cash equivalents (38,509) 5,044
2,789
Cash and cash equivalents at beginning of year 68,997 63,953
30,488
Cash and cash equivalents at end of year $ 30,488 $ 68,997
$ 33,277
Supplemental Data:
Cash paid during the year for:
Interest, net of capitalized interest $ 48,105 $ 46,812
$ 62,997
Income taxes 175,546 145,663
129,893
Non-cash investing activities:
Treasury stock issued for acquisitions 11,950
Non-cash financing activities:
Capital lease obligations 7,346
ESOP debt guarantee 112,000
The accompanying notes are an integral part of the financial statements.
23
8. M A N A G E M E N T ’ S D I S C U S S I O N & A N A LY S I S A N D F I N A N C I A L S TAT E M E N T S
Discussion of Business Segment Information
A slight improvement in the trend of order rates was seen toward the end of
The Business Segment Information presents sales, operating
1999; however, it is unclear whether an upward trend will continue or be
income and assets on a basis that is consistent with the manner in which
sustainable into fiscal 2000 as the Company continues to see mixed business
the Company’s various businesses are managed for internal review and
conditions across its North American markets. The Industrial European and
decision-making.
Latin American operations are expected to experience a continued weak
Industrial Segment
economy in the first half of fiscal 2000. The Company expects to take the
1998 1997
1999
necessary actions to manage these operations to ensure they are appropriately
Operating income as a percent of sales 12.6% 12.9%
11.0%
structured to operate in their current economic environment.
Return on average assets 19.1% 18.6%
16.0%
Backlog for the Industrial Segment was $546.9 million at June 30, 1999,
compared to $585.2 million at the end of 1998 and $510.8 million at the end of
Sales for the Industrial North American operations increased to $2.57 billion in 1997. The lower backlog reflects the weakened demand experienced during the
1999, 4.5 percent over 1998, following 1998’s increase of 15.2 percent over year by the Industrial markets. The 1998 increase over backlog in 1997 was due
1997. Acquisitions accounted for four-fifths of the increase in 1999 and nearly to volume growth within the North American operations, as well as acquisitions.
one-fifth of the increase in 1998. Sales in 1999 reflects lower demand within
Assets for the Industrial Segment increased 3.4 percent in 1999 after an increase
most of the Industrial North American markets, particularly in the
of 15.0 percent in 1998. The increase in 1999 is primarily due to acquisitions,
semiconductor fabrication, agricultural, petrochemical, factory automation and
partially offset by decreases in inventories and net goodwill as well as the effect
machine tool markets. However, growth was experienced in the
of currency fluctuations. In 1998 currency fluctuations partially offset increases
telecommunications and refrigeration markets. The growth in 1998 was spread
from acquisitions and increases in inventories. In both years net plant and
among numerous markets, but primarily was the result of growth in the light
equipment increased due to capital expenditures exceeding depreciation.
and heavy-duty truck, construction equipment, telecommunications, factory
automation, machine tool and refrigeration markets. Aerospace Segment
1998 1997
1999
International Industrial sales increased to a record $1.24 billion, 4.7 percent over
Operating income as a percent of sales 16.1% 12.9%
15.4%
1998. Without the impact of changes in currency rates, volume for 1999 increased
Return on average assets 22.8% 17.3%
23.1%
5.8 percent. Acquisitions accounted for all of the 1999 increase. International
Industrial sales in 1998 increased to $1.19 billion, 8.0 percent over 1997. Without
the impact of changes in currency rates, volume for 1998 increased over 17
Sales increased 16.1 percent in 1999 and 15.1 percent in 1998. The continuing high
percent. Acquisitions contributed over half of the 1998 increase. European markets
level of activity in 1999 reflects the increase in commercial aircraft build rates.
experienced steady growth during 1998. The Company also continued to penetrate
Increased commercial aircraft deliveries and continued penetration of the commercial
markets in Asia Pacific and Latin American regions.
repair and overhaul businesses contributed to the higher volume in 1998.
Industrial North American operating income decreased 8.4 percent in 1999
Operating income increased 11.0 percent in 1999 and 43.1 percent in 1998. As a
after an increase of 11.4 percent in 1998 over 1997. Operating income in 1998
percent of sales 1999 income was 15.4 percent compared to 16.1 percent in 1998 and
includes a $5.2 million R&D charge. Income from operations as a percent of
12.9 percent in 1997. Current year margins reflect a change in mix of sales from
sales was 13.1 percent in 1999 compared to 14.9 percent in 1998 and
aftermarket to OEM. The 1998 increase in margins was primarily the result of
15.4 percent in 1997. Margins in 1999 were adversely affected by the
improved capacity utilization due to higher volume and a favorable product mix.
underabsorption of overhead costs and pricing pressure experienced throughout
Backlog at June 30, 1999 was $1.08 billion compared to $1.06 billion in 1998
most of the Industrial markets. Recently purchased acquisitions, not yet fully
and $976.2 million in 1997, reflecting the strong growth of the commercial
integrated, continued to contribute lower margins. Raw material prices
aircraft market. A decline in OEM business is expected in fiscal 2000 and the
decreased during the year.
Company expects to take the necessary steps to resize the business.
International operating income decreased 11.4 percent in 1999 after a 1998
Assets increased 6.0 percent in 1999 after a 13.6 percent increase in 1998. For
increase of 6.4 percent over 1997. Operating income in 1998 includes a
both periods the increases were primarily in customer receivables and property,
$10.6 million R&D charge. Income as a percent of sales in 1999 was 6.6 percent
plant and equipment, partially offset by a decrease in net goodwill. The 1998
compared to 7.8 percent in 1998 and 7.9 percent in 1997. Demand in Europe
increase was also due to an increase in inventories.
began to weaken in the second half of 1999 resulting in lower capacity utilization.
Latin American operations suffered through a weak economy throughout most of Corporate assets increased 23.5 percent in 1999 primarily due to increases
1999, particularly in the Brazilian markets. Results in the Asia Pacific region in qualified and non-qualified benefit plan assets. The increase of 94.9 percent
continue to improve as the Company continued to expand its infrastructure in this in 1998 is primarily due to a change in the balance sheet classification of
market. Operating income for 1998 benefited from growth in the European qualified pension assets.
Industrial markets with increased volume improving capacity utilization.
24
9. Business Segment Information (Dollars in thousands)
By Industry By Geographic Area (d)
1998 1997 1998 1997
1999 1999
Net Sales: Net Sales:
Industrial: North America $ 3,425,704 $ 2,969,883
$ 3,684,786
North America $ 2,454,558 $ 2,130,817 International 1,207,319 1,121,198
$ 2,565,154 1,274,014
International 1,185,584 1,097,615 $ 4,633,023 $ 4,091,081
1,241,256 $ 4,958,800
Aerospace 992,881 862,649
1,152,390
Long-lived Assets:
$ 4,633,023 $ 4,091,081
$ 4,958,800
North America $ 790,162 $ 710,049
$ 873,222
International 345,063 310,694
327,647
Segment Operating Income:
$ 1,135,225 $ 1,020,743
$ 1,200,869
Industrial:
North America $ 365,880 $ 328,307
$ 335,259
International 92,783 87,216
82,245
Aerospace 159,580 111,533
177,213 The accounting policies of the business segments are the same as those
Total segment operating income 618,243 527,056
594,717 described in the Significant Accounting Policies footnote except that the
Corporate administration 61,829 50,582
54,176
business segment results are prepared on a management basis that is
Income before interest expense and other 556,414 476,474
540,541
consistent with the manner in which the Company disaggregates financial
Interest expense 52,787 46,659
63,697
information for internal review and decision-making.
Other (361) 4,948
(850)
Income before income taxes $ 503,988 $ 424,867
$ 477,694
(a) Corporate assets are principally cash and cash equivalents, domestic
deferred income taxes, investments, benefit plan assets, headquarters
Identifiable Assets: facilities, idle facilities held for sale and the major portion of the Company’s
Industrial $ 2,570,273 $ 2,235,631
$ 2,657,146
domestic data processing equipment.
Aerospace 744,335 655,433
789,174
3,314,608 2,891,064
3,446,320 (b) Includes value of net plant and equipment at the date of acquisition of
Corporate (a) 210,213 107,882
259,568
acquired companies accounted for by the purchase method (1999 -
$ 3,524,821 $ 2,998,946
$ 3,705,888
$17,686; 1998 - $54,718; 1997 - $15,283).
(c) Fiscal 1997 includes $21,837 for real estate acquired in a tax-free exchange
Property Additions: (b)
Industrial $ 245,995 $ 173,635 of property.
$ 209,230
Aerospace 33,733 20,608
36,993
(d) Net sales are attributed to countries based on the location of the selling
Corporate (c) 11,935 32,078
1,585
$ 291,663 $ 226,321 unit. North America includes the United States, Canada and Mexico. No
$ 247,808
country other than the United States represents greater than 10% of
consolidated sales. Long-lived assets are comprised of property, plant and
Depreciation:
equipment based on physical location.
Industrial $ 130,888 $ 121,694
$ 140,914
Aerospace 19,011 21,536
19,523
Corporate 3,734 3,023
4,140
$ 153,633 $ 146,253
$ 164,577
25
10. N O T E S T O C O N S O L I D AT E D F I N A N C I A L S TAT E M E N T S
Use of Estimates — The preparation of financial statements in
Note 1
conformity with generally accepted accounting principles requires management
Significant Accounting Policies
to make estimates and assumptions that affect the amounts reported in the
The significant accounting policies followed in the preparation of the financial statements and accompanying notes. Actual results could differ from
accompanying consolidated financial statements are summarized below. those estimates.
Nature of Operations — The Company is a leading worldwide Basis of Consolidation — The consolidated financial statements
producer of motion control products, including fluid power systems, include the accounts of all domestic and foreign subsidiaries. All material
electromechanical controls and related components. intercompany transactions and profits have been eliminated in the consolidated
financial statements. Within the Business Segment Information, intersegment and
The Company adopted Statement of Financial Accounting Standards (SFAS)
interarea sales are recorded at fair market value and are immaterial in amount.
No. 131, “Disclosures about Segments of an Enterprise and Related
Information,” during fiscal 1999. SFAS No. 131 requires segment information to Cash — Cash equivalents consist of short-term highly liquid investments,
be disclosed based upon how management internally evaluates the operating with a three-month or less maturity, carried at cost plus accrued interest, which
performance of its business units. The Company evaluates performance based are readily convertible into cash.
on segment operating income before Corporate general and administrative
Inventories — Inventories are stated at the lower of cost or market.
expenses, Interest expense and Income taxes. Business segment information for
The majority of domestic inventories are valued by the last-in, first-out method
fiscal years 1998 and 1997 have been restated to conform to the new standard.
and the balance of the Company's inventories are valued by the first-in,
The Company operates in two principal business segments: Industrial and first-out method.
Aerospace. The Industrial Segment is an aggregation of several business units
Long-term Contracts — The Company enters into long-term
which produce motion-control and fluid power system components for builders
contracts for the production of aerospace products. For financial statement
and users of various types of manufacturing, packaging, processing,
purposes, sales are recorded as deliveries are made (units of delivery method of
transportation, agricultural, construction, and military machinery, vehicles and
percentage-of-completion). Unbilled costs on these contracts are included in
equipment. Industrial Segment products are marketed primarily through field
inventory. Progress payments are netted against the inventory balances.
sales employees and independent distributors. The North American Industrial
Provisions for estimated losses on uncompleted contracts are made in the period
business represents the largest portion of the Company’s manufacturing plants
in which such losses are determined.
and distribution networks and primarily services North America. The
International Industrial operations bring Parker products and services to
Plant, Equipment and Depreciation — Plant and equipment
countries throughout Europe, Asia Pacific and Latin America.
are recorded at cost and are depreciated principally using the straight-line
method for financial reporting purposes. Depreciation rates are based on
The Aerospace Segment produces hydraulic, pneumatic and fuel systems and
estimated useful lives of the assets. Improvements which extend the useful life
components which are utilized on virtually every domestic commercial, military
of property are capitalized, and maintenance and repairs are expensed. When
and general aviation aircraft. Its components also perform a vital role in naval
property is retired or otherwise disposed of, the cost and accumulated
vessels, land-based weapons systems, satellites and space vehicles. This Segment
depreciation are removed from the appropriate accounts and any gain or loss is
serves original equipment and maintenance, repair and overhaul customers
included in current income.
worldwide. Its products are marketed by field sales employees and are sold
directly to the manufacturer and to the end user.
Investments and Other Assets — Investments in joint-venture
companies in which ownership is 50% or less are stated at cost plus the
There are no individual customers to whom sales are 6 percent or more of
Company's equity in undistributed earnings. These investments and the related
the Company’s consolidated sales. Due to the diverse group of customers
earnings are not material to the consolidated financial statements.
throughout the world the Company does not consider itself exposed to any
concentration of credit risks.
Excess Cost of Investments — The excess cost of investments
over net assets acquired is being amortized, on a straight-line basis, primarily
The Company manufactures and markets its products throughout the world.
over 15 years and not exceeding 40 years. Unamortized cost in excess of
Although certain risks and uncertainties exist, the diversity and breadth of the
associated expected operating cash flows is considered to be impaired and is
Company’s products and geographic operations mitigate significantly the risk
written down to fair value.
that adverse changes in any event would materially affect the Company’s
operating results.
26
11. (Dollars in thousands, except per share amounts)
Income Taxes — Income taxes are provided based upon income for Stock Options — The Company applies the intrinsic-value based
financial reporting purposes. Deferred income taxes arise from temporary method to account for stock options granted to employees or outside Directors
differences in the recognition of income and expense for tax purposes. Tax to purchase common shares. The option price equals the market price of the
credits and similar tax incentives are applied to reduce the provision for income underlying common shares on the date of grant, therefore no compensation
taxes in the year in which the credits arise. expense is recognized.
Foreign Currency Translation — Assets and liabilities of most Recently Issued Accounting Pronouncements —
foreign subsidiaries are translated at current exchange rates, and income and The Financial Accounting Standards Board (FASB) has issued SFAS No. 133,
expenses are translated using weighted average exchange rates. The effects of “Accounting for Derivative Instruments and Hedging Activities.” This standard
these translation adjustments, as well as gains and losses from certain establishes a new model for accounting for derivatives and hedging activities.
intercompany transactions, are reported in the Accumulated other Due to the immaterial amount of derivative and hedging activity within the
comprehensive income component of Shareholders' equity. Such adjustments Company, application of this standard, required in the first quarter of 2001
will affect Net income only upon sale or liquidation of the underlying foreign as a result of the issuance of SFAS No. 137, is not expected to have a material
investments, which is not contemplated at this time. Exchange gains and losses impact on the results and financial position of the Company.
from transactions in a currency other than the local currency of the entity
In March 1998 the Accounting Standards Executive Committee issued Statement
involved, and translation adjustments in countries with highly inflationary
of Position (SOP) 98-1, “Accounting for the Costs of Computer Software
economies, are included in income.
Developed or Obtained for Internal Use.” SOP 98-1 requires expenses incurred
Financial Instruments — The Company’s financial instruments during the application development stage of a software implementation project
consist primarily of investments in cash, cash equivalents and long-term to be capitalized and amortized over the useful life of the project. Application of
investments as well as obligations under notes payable and long-term debt. this standard, required beginning with the first quarter of 2000, is not expected
The carrying values for Cash and cash equivalents, Investments and other assets to have a material impact on the results and financial position of the Company.
and Notes payable approximate fair value.
The Company enters into forward exchange contracts (forward contracts) and
Note 2
cross-currency swap agreements to reduce its exposure to fluctuations in related
Acquisitions
foreign currencies. These contracts are with major financial institutions and the
risk of loss is considered remote. The Company does not hold or issue derivative
On July 14, 1998 the Company acquired the equity of B.A.G. Acquisition Ltd., the
financial instruments for trading purposes.
parent company of Veriflo Corporation, a manufacturer of high-purity regulators
and valves based in Richmond, California. On August 27, 1998 the Company
Gains or losses on forward contracts which hedge net investments in
acquired the equity of Fluid Power Systems, a manufacturer of hydraulic valves
consolidated subsidiaries are accrued in Shareholders’ equity. Gains or losses
and electrohydraulic systems and controls located in Lincolnshire, Illinois.
on forward contracts which hedge specific transactions are recognized in
Combined annual sales for these operations, for their most recent fiscal year
Net income, offsetting the underlying foreign currency gains or losses.
prior to acquisition, were approximately $107 million. Total purchase price for
Cross-currency swap agreements are recorded in Long-term debt as dollar- these businesses was approximately $85.2 million cash.
denominated receivables with offsetting foreign-currency payables. If the
On May 1, 1998 the Company acquired the equity of Extrudit Ltd., a tubing
receivables more than offset the payables, the net difference is reclassified to
manufacturer located in Buxton, England. On April 30, 1998 the Company
an asset. Gains or losses are accrued monthly as an adjustment to Net income,
purchased the equity of UCC Securities Limited of Thetford, Norfolk, England,
offsetting the underlying foreign currency gains or losses. The differential
a manufacturer of technology-based hydraulic filtration products. On April 1,
between interest to be received and interest to be paid is accrued monthly as
1998 the Company acquired the equity of Sempress Pneumatics, a
an adjustment to Interest expense.
manufacturer of pneumatic cylinders and valves located near Rotterdam, the
In addition, the Company’s foreign locations, in the ordinary course of business, Netherlands. On March 31, 1998 the Company acquired the assets of Temeto AB
enter into financial guarantees, through financial institutions, which enable located in Flen, Sweden, a distributor of hydraulic components. On March 26,
customers to be reimbursed in the event of nonperformance by the Company. 1998 the Company purchased the remaining 51% of two Korean joint ventures
– HS Parker Company Ltd., in Yangsan, and the HS Parker Air Conditioning
The total value of open contracts and any risk to the Company as a result of the Components Company Ltd., in Chonan, manufacturers of hydraulic hose,
above mentioned arrangements is not material. fittings, hose assemblies and accumulators. On February 27, 1998 Computer
Technology Corporation of Milford, Ohio, a manufacturer of man-machine
27