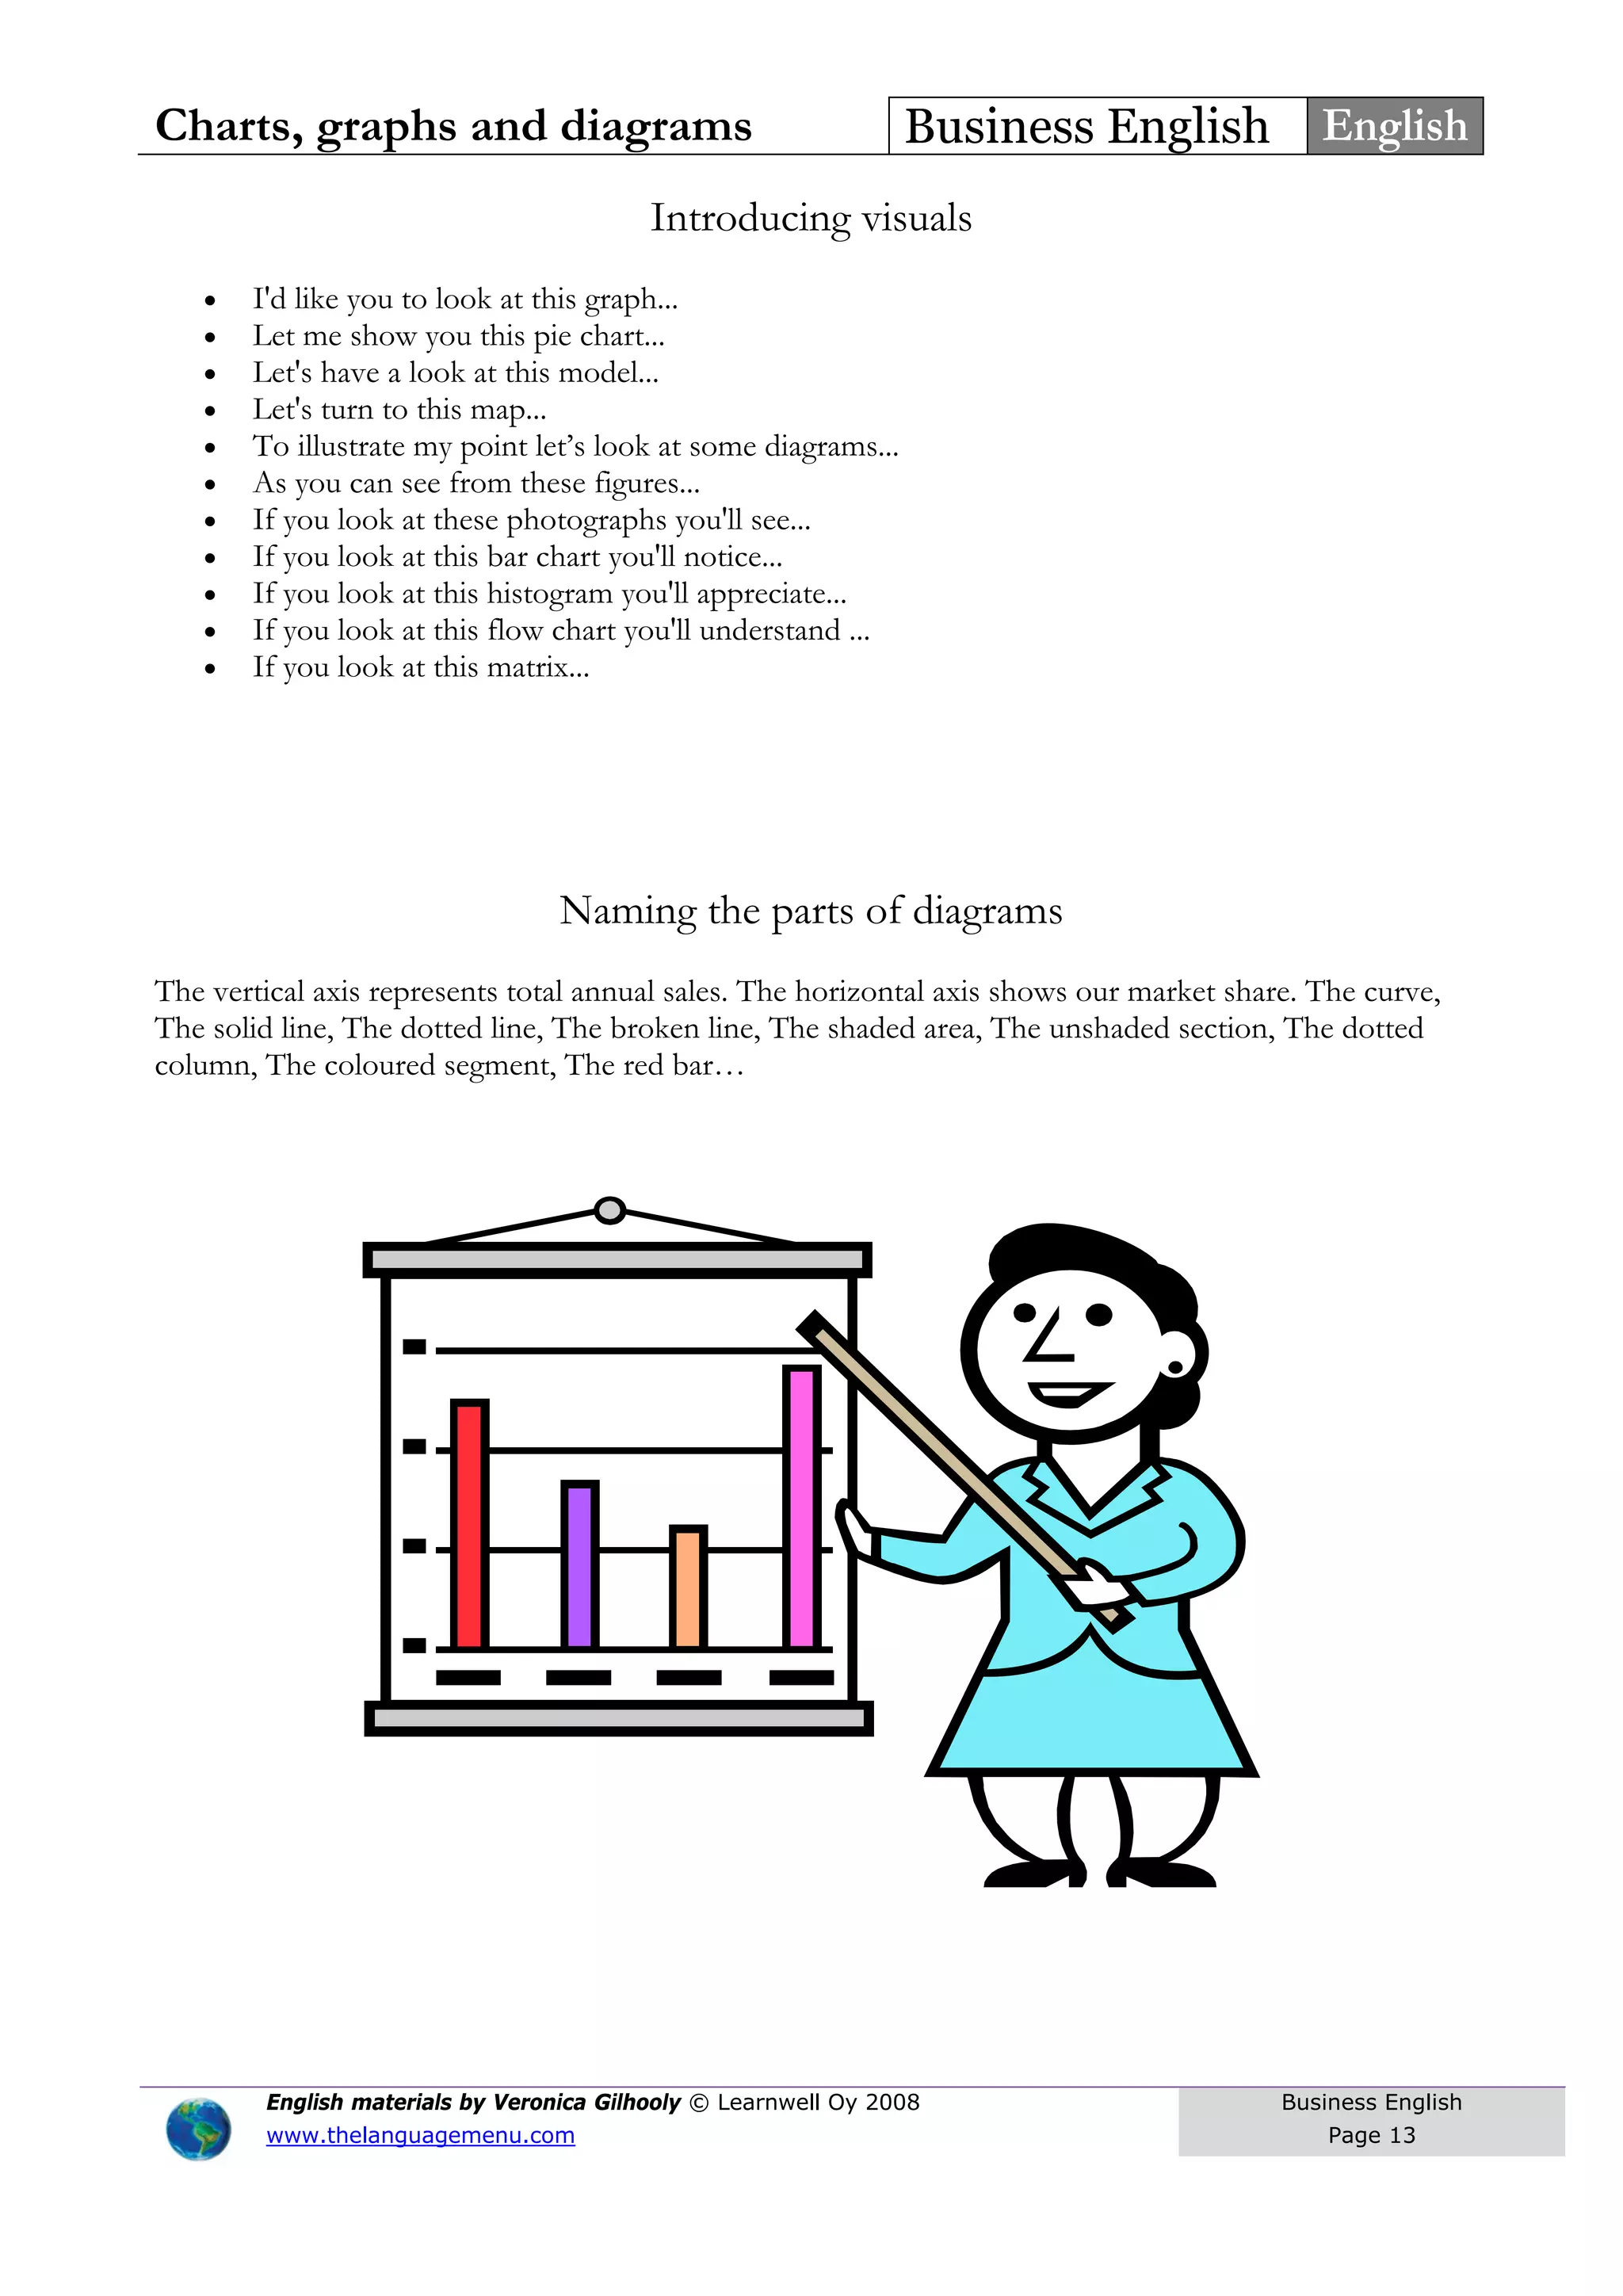
BUSINESS ENGLISH 2008
CHARTS, GRAPHS
AND DIAGRAMS
Learnwell Oy professional language training and translation services
include:
• language training, special intensive courses and custom-designed courses
• translation, interpreting, proofreading and editing services
• dedicated services (our X-file products) that include monthly support for ongoing
small translation, editing and proofreading tasks; corporate team-building training and
EXPAT services
• web tools for teachers and students
LEARNWELL OY
Supporting you in the world of languages!
www.thelanguagemenu.com
Charts, graphs and diagrams Business English English
Different types of charts, graphs and diagrams
single line graph multiple line graph paired bar chart
percentage bar chart pie chart stacked bar chart
single bar chart diagram population chart
flow chart bar graph bubble diagram
Pictures from Google images
English materials by Veronica Gilhooly © Learnwell Oy 2008
www.thelanguagemenu.com
Business English
Page 1
Charts, graphs and diagrams Business English English
English materials by Veronica Gilhooly © Learnwell Oy 2008
www.thelanguagemenu.com
Business English
Page 2
Writing about Graphs
Before you Begin
Underline key words. Write related words - turn nouns into verbs, verbs into nouns, adjectives into
adverbs, etc. Write opposite words, similar words, synonyms, etc.
Circle and highlight the graph. Use arrows. Make notes. Circle the biggest, the smallest. stable or
unchanging parts, sudden increases, etc.
Identify trends. A trend is the overall idea of the graph
• what is happening/what happened
• the main change over time
• the most noticeable thing about the graph
• the pattern over time
• the pattern for different places or groups or people.
Most graphs will have two trends, or there will be two graphs with a trend in each. You could tell
about the two trends in two separate paragraphs. Make sure you have identified the trends in the graph.
Introduction
• First sentence: Describe the graph. You can use some slightly different words or word
forms from those on the question paper, but be careful to give the full information. Start "The
graph shows"
• Second sentence: This gives the trend or trends. You can put two trends in this sentence
or only one - you could keep the other one for the conclusion. Start "Overall, ..."
Paragraph 1: Trend 1
• Start with a sentence with no number. “City size increased sharply over the period.” “The
most obvious trend in the graph is that women are having fewer babies.” “Oil production has
increased slightly in all the countries in the graph”
• Follow this sentence with an example (sentence with number) and perhaps another
example (another sentence with number). Keep alternating.
Paragraph 2: Trend 2
• Start with a sentence with no number. “City size increased sharply over the period.”
• Give an example (sentence with number) and perhaps another example
Conclusion
Charts, graphs and diagrams Business English English
• Finish by repeating the main trends, or identify a second trend. Use different vocabulary.
• Don't have any numbers in the conclusion (you could use words like "most", "the
majority" "a minority", "a small number").
• Don’t give an opinion.
While You Write: Some Don’ts
• Don’t describe the X and Y axis. Give the information.
• Don’t write about everything on the graph. Pick the biggest, the smallest, the main
points, the main trends. Group similar things together
• Don’t write about the line or the bar: “The line went up,” “The bar went down.”
Instead, write about the idea. “The number of people going to work by train increased
gradually.” “Oil production shot up in 1965”
• Make sure you write about the idea. Don’t use shorthand: “Men went up.” “Women went
down.” Instead, write about the real data: “The number of men at university fell dramatically,”
“The percentage of female students getting a degree rose suddenly.”
• Don’t use “I feel”, “as I have written,” “as you can see,” etc. Keep it academic.
• Don’t start sentences with But, So, Also, And, For, Since, Because, Although
Word Length
Make sure you have 150 words. You should have some short sentences (about 6-10 words) and
some long ones (12-18) words, but your average should be about 12 or 13 words per sentence.
A sentence without a number will usually be short. Use a mix - a sentence without a number
followed by a sentence or two with a number.
http://www.admc.hct.ac.ae/hd1/english/graphs/writingaboutgraphs.htm
English materials by Veronica Gilhooly © Learnwell Oy 2008
www.thelanguagemenu.com
Business English
Page 3
Charts, graphs and diagrams Business English English
h
Place the words in the right column, then add a few more words of your own
be constant climb collapse cut
expansion extension fall go down
growth improvement level off push down
reduction rise shoot up soar
stability stagnation stand at stay at
Verbs
Verbs
Verbs
Verbs
Verbs
Verbs
Nouns
Nouns
Nouns
Nouns
Nouns
Nouns
English materials by Veronica Gilhooly © Learnwell Oy 2008
www.thelanguagemenu.com
Business English
Page 4
Charts, graphs and diagrams Business English English
Transitive and intransitive verbs
increase decrease maintain increase decrease stay at
raise drop keep rise drop reach a peak
step up cut grow decline remain stable
expand go down expand fall
improve improve
A transitive verb is an action
verb. Second, it requires a
direct object to complete its
meaning in the sentence. In
other words, the action of the
verb is transferred to the
object directly. To determine
whether a verb is transitive, ask
whether the action is done to
someone or something.
 
An intransitive verb is an
action verb, but it does not
have a direct object. The
action ends rather than being
transferred to some person or
object or is modified by an
adverb or adverb phrase.
 
Write sentences using the transitive and intransitive verbs
1. ______________________________________________________________________
2. ______________________________________________________________________
3. ______________________________________________________________________
4. ______________________________________________________________________
5. ______________________________________________________________________
6. ______________________________________________________________________
7. ______________________________________________________________________
8. ______________________________________________________________________
9. ______________________________________________________________________
10. ______________________________________________________________________
English materials by Veronica Gilhooly © Learnwell Oy 2008
www.thelanguagemenu.com
Business English
Page 5
Charts, graphs and diagrams Business English English
Introduction to Pie Charts
You are usually asked to compare 2 pie charts but sometimes you only have 1 chart to describe.
Single Pie Chart
Paragraph 1
Describe what sort of chart it is and what it is about.
Paragraph 2
Describe the sections of the graph starting with the biggest and working your way down.
Paragraph 3
A short conclusion giving an overall view of what the chart is about.
Two Pie Charts
If you have 2 pie charts they will be giving similar information so you can compare the two. This type
of writing is similar to a compare and contrast essay.
Paragraph 1
Explain that they are pie charts and say what they are describing. This is the same as line graphs except
there are 2.
Paragraph 2
Compare the data between the two charts. Start with the biggest sectors and work your way down.
Paragraph 3
Conclusion. Mention the important similarities and differences.
English materials by Veronica Gilhooly © Learnwell Oy 2008
www.thelanguagemenu.com
Business English
Page 6
Charts, graphs and diagrams Business English English
Fill in the correct word
a low point declined doubled drop
from increased slightly recovered remained
rising sharply sudden to were
In January, gold sales _____________ about 200 million dirhams per month. In February they
_____________ to Dhs 220 million, _____________ to a peak of 350 million dirhams in March. Over
the next four months, sales _____________ steadily, reaching _____________ of 120 million dirhams
in July.
In August, there was a _____________ increase. Sales almost _____________, rising _____________
Dhs 120 million in July to Dhs 210 million in August. This was followed by a [?] in September to Dhs
120 million.
From September to October, sales _____________ from Dhs 120 million to Dhs 180 million. In
October and November, sales _____________steady, and there was a small increase in December
_____________ 190 million dirhams.
http://www.admc.hct.ac.ae/hd1/english/graphs/goldsales.htm
English materials by Veronica Gilhooly © Learnwell Oy 2008
www.thelanguagemenu.com
Business English
Page 7
Charts, graphs and diagrams Business English English
Place the correct letter in the box
slump rise recover plunge pick up plummet
drop soar climb fall rally bounce back
English materials by Veronica Gilhooly © Learnwell Oy 2008
www.thelanguagemenu.com
Business English
Page 8
just under
just over
well under
well over
roughly
nearly
approximately
around
about
take off crash escalate slide stabilize flatten out
decline rocket dip fluctuate hold steady
A B C D E F G
Expressing approximation
We use words to express approximation when the point we are trying to describe is
between milestones on the graph.
Charts, graphs and diagrams Business English English
English materials by Veronica Gilhooly © Learnwell Oy 2008
www.thelanguagemenu.com
Business English
Page 9
Expressing the Movement of a Line
Verbs Nouns Adjectives Adverbs
rise (to) a rise dramatic dramatically
increase (to) an increase sharp sharply
go up to huge hugely
grow (to) growth steep steeply
climb (to) a climb substantial substantially
boom a boom considerable considerably
peak (at) (reach) a peak (at) significant significantly
fall (to) a fall (of) marked markedly
decline (to) a decline (of) moderate moderately
decrease (to) a decrease (of) slight slightly
dip (to) a dip (of) small
drop (to) a drop (of) minimal minimally
go down (to)
reduce (to) a reduction (of)
a slump
level out a leveling out
no change no change
remain stable (at)
remain steady (at)
stay (at)
stay constant (at)
maintain the same level
Describing the Speed of a Change
Adjectives Adverbs
rapid rapidly
quick quickly
swift swiftly
sudden suddenly
steady steadily
gradual gradually
slow slowly
Charts, graphs and diagrams Business English English
1. The market is showing some signs of growth. _____
2. The market is extremely volatile. _____
3. The pound slipped back against the dollar. _____
4. The Swiss franc is staging a recovery. _____
5. The yen lost ground slightly. _____
6. There's been a dramatic downturn in the market. _____
7. There's been an upsurge of interest in gold. _____
8. The share price bottomed out at 11 cents. _____
9. Gold peaked at €300 an ounce. _____
10. Profits will level off at around €10,000. _____
11. Sales hit an all-time low. _____
12. There hasn't been much movement in the price of tin _____
http://www.admc.hct.ac.ae/hd1/english/graphs/movement.htm
English materials by Veronica Gilhooly © Learnwell Oy 2008
www.thelanguagemenu.com
Business English
Page 10
Charts, graphs and diagrams Business English English
English materials by Veronica Gilhooly © Learnwell Oy 2008
www.thelanguagemenu.com
Business English
Page 11
Comparing and contrasting
One syllable
Adjectives with one syllable form their comparatives and superlatives like this:
cheap cheaper cheapest
large larger largest
bright brighter brightest
Exceptions:
good better best
bad worse worst
Two syllables
Some adjectives with two syllables form their comparatives and superlatives like this:
pretty prettier prettiest
happy happier happiest
But many form their comparatives and superlatives like this:
striking more striking most striking
Although some can form their comparatives and superlatives like this:
common more common most common
clever more clever / cleverer most clever /cleverest
Three or more syllables
All adjectives with three or more syllables form their comparatives and superlatives like this:
attractive more attractive most attractive
profitable more profitable most profitable
expensive more expensive most expensive
Charts, graphs and diagrams Business English English
English materials by Veronica Gilhooly © Learnwell Oy 2008
www.thelanguagemenu.com
Business English
Page 12
What are the comparative and superlative forms of these adjectives
Adjective Comparative Superlative
accurate
certain
convenient
correct
dangerous
happy
likely
modern
new
possible
probable
up-to-date
http://international.holmesglen.vic.edu.au/ielts_writing.pdf
Charts, graphs and diagrams Business English English
Introducing visuals
• I'd like you to look at this graph...
• Let me show you this pie chart...
• Let's have a look at this model...
• Let's turn to this map...
• To illustrate my point let’s look at some diagrams...
• As you can see from these figures...
• If you look at these photographs you'll see...
• If you look at this bar chart you'll notice...
• If you look at this histogram you'll appreciate...
• If you look at this flow chart you'll understand ...
• If you look at this matrix...
Naming the parts of diagrams
The vertical axis represents total annual sales. The horizontal axis shows our market share. The curve,
The solid line, The dotted line, The broken line, The shaded area, The unshaded section, The dotted
column, The coloured segment, The red bar…
English materials by Veronica Gilhooly © Learnwell Oy 2008
www.thelanguagemenu.com
Business English
Page 13
Charts, graphs and diagrams Business English English
Explaining diagrams
• Sales rose slightly in the final quarter.
• Profits fell a little last year.
• Demand increased gently
• Turnover decreased steadily
• Turnover dropped suddenly
• Turnover decreased quickly.
• Demand increased rapidly.
• Profits fell dramatically.
• At the beginning of this year sales stagnated.
• In the middle of August profits slumped.
• At the end of last year demand peaked.
• In the first quarter of 2008 sales plummeted.
• In the second quarter of 2007 sales flattened out.
• In the third quarter of 2007 sales leveled off.
• In the last quarter of 2007 sales remained steady.
English materials by Veronica Gilhooly © Learnwell Oy 2008
www.thelanguagemenu.com
Business English
Page 14
Charts, graphs and diagrams Business English English
Useful phrases for presentations
Signalling a start:
- Right, ladies and gentlemen. Shall we begin?
- OK, I'd like to begin by ...
- Right then, everybody ...
Greetings:
- Good morning, ladies and gentlemen.
- I'd like to welcome you all on behalf of NKS.
- I'd like to say how happy I am to be here today.
Introducing yourself:
- My name is Richard Delmas.
- I'm the Marketing Manager here.
- I'd like to introduce myself. My name is ...
- Let me introduce myself. My name is ...
Introducing people:
- I'd like to introduce Mr Peters from Datacom.
- May I introduce ...
- Let me introduce ...
The objective of your presentation:
- My objective this afternoon is to inform you...
- I'm here today to give you...
- My purpose today is to introduce you to...
- My aim this morning is to...
The length of time your presentation will take:
- My presentation will last twenty-five minutes.
- I will talk for fifteen minutes.
Structuring:
- My presentation is split into three key areas.
- Firstly ... Secondly ... Thirdly ...
- To begin with ... After this ... Finally ...
English materials by Veronica Gilhooly © Learnwell Oy 2008
www.thelanguagemenu.com
Business English
Page 15
Charts, graphs and diagrams Business English English
Saying when your audience may ask questions:
- There will be time for questions at the end...
- Please feel free to interrupt me as I go along.
Introducing topics:
- I want to look at ...
- I'd like to review ...
- I want to discuss ...
- I'm going to analyse ...
- I want to cover ...
- I'd like to talk about ...
Moving on:
- Let's now move on to ...
- I'd like to go on to ...
- This brings me to ...
- I now want to ...
Looking back:
- Let's look back for a moment ...
- To go back to ...
- As I said before ...
Adding:
- In addition ...
- I might add that ...
- Furthermore ...
- Moreover ...
Dealing with interruptions:
- Perhaps I could return to that point later on?
- If I might just finish?
- If you'd allow me to continue?
Summarising and concluding
- To sum up then, ...
- To summarise my main points ...
- I'd like to conclude by reminding you that ...
- Let me end by ...
- I'd like to finish ...
- In conclusion, may I remind you ...
- Finally, ...
English materials by Veronica Gilhooly © Learnwell Oy 2008
www.thelanguagemenu.com
Business English
Page 16
Charts, graphs and diagrams Business English English
Asking for questions:
- You no doubt have many questions ...
- If there are any questions ...
- I'm sure you have many questions ...
Playing for time:
- That's an interesting question.
- I'm glad you asked that question.
- You've raised an important point
there.
- That's a difficult question.
Closing question time:
- Perhaps on that note we could end?
- I'm afraid that's all we have time for.
Thanking:
- I'd like to thank you all on behalf of Company X.
- I'd like to thank you all for your participation.
Now choose a topic, draw a graph or a diagram and make your own
presentation.
English materials by Veronica Gilhooly © Learnwell Oy 2008
www.thelanguagemenu.com
Business English
Page 17
MD: veronica.gilhooly@thelanguagemenu.com Tel: 050 531 1453
Translations: translations@thelanguagemenu.com Tel: 045 112 9724
Learnwell Oy
Tehtaankatu 7
00140 Helsinki
Finland
General inquiries: office@thelanguagemenu.com
Phone: +358 45 130 1114
Contact information
www.thelanguagemenu.com

English_charts_graphs_and_diagrams_2008

  • 1.
    BUSINESS ENGLISH 2008 CHARTS,GRAPHS AND DIAGRAMS Learnwell Oy professional language training and translation services include: • language training, special intensive courses and custom-designed courses • translation, interpreting, proofreading and editing services • dedicated services (our X-file products) that include monthly support for ongoing small translation, editing and proofreading tasks; corporate team-building training and EXPAT services • web tools for teachers and students LEARNWELL OY Supporting you in the world of languages! www.thelanguagemenu.com
  • 2.
    Charts, graphs anddiagrams Business English English Different types of charts, graphs and diagrams single line graph multiple line graph paired bar chart percentage bar chart pie chart stacked bar chart single bar chart diagram population chart flow chart bar graph bubble diagram Pictures from Google images English materials by Veronica Gilhooly © Learnwell Oy 2008 www.thelanguagemenu.com Business English Page 1
  • 3.
    Charts, graphs anddiagrams Business English English English materials by Veronica Gilhooly © Learnwell Oy 2008 www.thelanguagemenu.com Business English Page 2 Writing about Graphs Before you Begin Underline key words. Write related words - turn nouns into verbs, verbs into nouns, adjectives into adverbs, etc. Write opposite words, similar words, synonyms, etc. Circle and highlight the graph. Use arrows. Make notes. Circle the biggest, the smallest. stable or unchanging parts, sudden increases, etc. Identify trends. A trend is the overall idea of the graph • what is happening/what happened • the main change over time • the most noticeable thing about the graph • the pattern over time • the pattern for different places or groups or people. Most graphs will have two trends, or there will be two graphs with a trend in each. You could tell about the two trends in two separate paragraphs. Make sure you have identified the trends in the graph. Introduction • First sentence: Describe the graph. You can use some slightly different words or word forms from those on the question paper, but be careful to give the full information. Start "The graph shows" • Second sentence: This gives the trend or trends. You can put two trends in this sentence or only one - you could keep the other one for the conclusion. Start "Overall, ..." Paragraph 1: Trend 1 • Start with a sentence with no number. “City size increased sharply over the period.” “The most obvious trend in the graph is that women are having fewer babies.” “Oil production has increased slightly in all the countries in the graph” • Follow this sentence with an example (sentence with number) and perhaps another example (another sentence with number). Keep alternating. Paragraph 2: Trend 2 • Start with a sentence with no number. “City size increased sharply over the period.” • Give an example (sentence with number) and perhaps another example Conclusion
  • 4.
    Charts, graphs anddiagrams Business English English • Finish by repeating the main trends, or identify a second trend. Use different vocabulary. • Don't have any numbers in the conclusion (you could use words like "most", "the majority" "a minority", "a small number"). • Don’t give an opinion. While You Write: Some Don’ts • Don’t describe the X and Y axis. Give the information. • Don’t write about everything on the graph. Pick the biggest, the smallest, the main points, the main trends. Group similar things together • Don’t write about the line or the bar: “The line went up,” “The bar went down.” Instead, write about the idea. “The number of people going to work by train increased gradually.” “Oil production shot up in 1965” • Make sure you write about the idea. Don’t use shorthand: “Men went up.” “Women went down.” Instead, write about the real data: “The number of men at university fell dramatically,” “The percentage of female students getting a degree rose suddenly.” • Don’t use “I feel”, “as I have written,” “as you can see,” etc. Keep it academic. • Don’t start sentences with But, So, Also, And, For, Since, Because, Although Word Length Make sure you have 150 words. You should have some short sentences (about 6-10 words) and some long ones (12-18) words, but your average should be about 12 or 13 words per sentence. A sentence without a number will usually be short. Use a mix - a sentence without a number followed by a sentence or two with a number. http://www.admc.hct.ac.ae/hd1/english/graphs/writingaboutgraphs.htm English materials by Veronica Gilhooly © Learnwell Oy 2008 www.thelanguagemenu.com Business English Page 3
  • 5.
    Charts, graphs anddiagrams Business English English h Place the words in the right column, then add a few more words of your own be constant climb collapse cut expansion extension fall go down growth improvement level off push down reduction rise shoot up soar stability stagnation stand at stay at Verbs Verbs Verbs Verbs Verbs Verbs Nouns Nouns Nouns Nouns Nouns Nouns English materials by Veronica Gilhooly © Learnwell Oy 2008 www.thelanguagemenu.com Business English Page 4
  • 6.
    Charts, graphs anddiagrams Business English English Transitive and intransitive verbs increase decrease maintain increase decrease stay at raise drop keep rise drop reach a peak step up cut grow decline remain stable expand go down expand fall improve improve A transitive verb is an action verb. Second, it requires a direct object to complete its meaning in the sentence. In other words, the action of the verb is transferred to the object directly. To determine whether a verb is transitive, ask whether the action is done to someone or something.   An intransitive verb is an action verb, but it does not have a direct object. The action ends rather than being transferred to some person or object or is modified by an adverb or adverb phrase.   Write sentences using the transitive and intransitive verbs 1. ______________________________________________________________________ 2. ______________________________________________________________________ 3. ______________________________________________________________________ 4. ______________________________________________________________________ 5. ______________________________________________________________________ 6. ______________________________________________________________________ 7. ______________________________________________________________________ 8. ______________________________________________________________________ 9. ______________________________________________________________________ 10. ______________________________________________________________________ English materials by Veronica Gilhooly © Learnwell Oy 2008 www.thelanguagemenu.com Business English Page 5
  • 7.
    Charts, graphs anddiagrams Business English English Introduction to Pie Charts You are usually asked to compare 2 pie charts but sometimes you only have 1 chart to describe. Single Pie Chart Paragraph 1 Describe what sort of chart it is and what it is about. Paragraph 2 Describe the sections of the graph starting with the biggest and working your way down. Paragraph 3 A short conclusion giving an overall view of what the chart is about. Two Pie Charts If you have 2 pie charts they will be giving similar information so you can compare the two. This type of writing is similar to a compare and contrast essay. Paragraph 1 Explain that they are pie charts and say what they are describing. This is the same as line graphs except there are 2. Paragraph 2 Compare the data between the two charts. Start with the biggest sectors and work your way down. Paragraph 3 Conclusion. Mention the important similarities and differences. English materials by Veronica Gilhooly © Learnwell Oy 2008 www.thelanguagemenu.com Business English Page 6
  • 8.
    Charts, graphs anddiagrams Business English English Fill in the correct word a low point declined doubled drop from increased slightly recovered remained rising sharply sudden to were In January, gold sales _____________ about 200 million dirhams per month. In February they _____________ to Dhs 220 million, _____________ to a peak of 350 million dirhams in March. Over the next four months, sales _____________ steadily, reaching _____________ of 120 million dirhams in July. In August, there was a _____________ increase. Sales almost _____________, rising _____________ Dhs 120 million in July to Dhs 210 million in August. This was followed by a [?] in September to Dhs 120 million. From September to October, sales _____________ from Dhs 120 million to Dhs 180 million. In October and November, sales _____________steady, and there was a small increase in December _____________ 190 million dirhams. http://www.admc.hct.ac.ae/hd1/english/graphs/goldsales.htm English materials by Veronica Gilhooly © Learnwell Oy 2008 www.thelanguagemenu.com Business English Page 7
  • 9.
    Charts, graphs anddiagrams Business English English Place the correct letter in the box slump rise recover plunge pick up plummet drop soar climb fall rally bounce back English materials by Veronica Gilhooly © Learnwell Oy 2008 www.thelanguagemenu.com Business English Page 8 just under just over well under well over roughly nearly approximately around about take off crash escalate slide stabilize flatten out decline rocket dip fluctuate hold steady A B C D E F G Expressing approximation We use words to express approximation when the point we are trying to describe is between milestones on the graph.
  • 10.
    Charts, graphs anddiagrams Business English English English materials by Veronica Gilhooly © Learnwell Oy 2008 www.thelanguagemenu.com Business English Page 9 Expressing the Movement of a Line Verbs Nouns Adjectives Adverbs rise (to) a rise dramatic dramatically increase (to) an increase sharp sharply go up to huge hugely grow (to) growth steep steeply climb (to) a climb substantial substantially boom a boom considerable considerably peak (at) (reach) a peak (at) significant significantly fall (to) a fall (of) marked markedly decline (to) a decline (of) moderate moderately decrease (to) a decrease (of) slight slightly dip (to) a dip (of) small drop (to) a drop (of) minimal minimally go down (to) reduce (to) a reduction (of) a slump level out a leveling out no change no change remain stable (at) remain steady (at) stay (at) stay constant (at) maintain the same level Describing the Speed of a Change Adjectives Adverbs rapid rapidly quick quickly swift swiftly sudden suddenly steady steadily gradual gradually slow slowly
  • 11.
    Charts, graphs anddiagrams Business English English 1. The market is showing some signs of growth. _____ 2. The market is extremely volatile. _____ 3. The pound slipped back against the dollar. _____ 4. The Swiss franc is staging a recovery. _____ 5. The yen lost ground slightly. _____ 6. There's been a dramatic downturn in the market. _____ 7. There's been an upsurge of interest in gold. _____ 8. The share price bottomed out at 11 cents. _____ 9. Gold peaked at €300 an ounce. _____ 10. Profits will level off at around €10,000. _____ 11. Sales hit an all-time low. _____ 12. There hasn't been much movement in the price of tin _____ http://www.admc.hct.ac.ae/hd1/english/graphs/movement.htm English materials by Veronica Gilhooly © Learnwell Oy 2008 www.thelanguagemenu.com Business English Page 10
  • 12.
    Charts, graphs anddiagrams Business English English English materials by Veronica Gilhooly © Learnwell Oy 2008 www.thelanguagemenu.com Business English Page 11 Comparing and contrasting One syllable Adjectives with one syllable form their comparatives and superlatives like this: cheap cheaper cheapest large larger largest bright brighter brightest Exceptions: good better best bad worse worst Two syllables Some adjectives with two syllables form their comparatives and superlatives like this: pretty prettier prettiest happy happier happiest But many form their comparatives and superlatives like this: striking more striking most striking Although some can form their comparatives and superlatives like this: common more common most common clever more clever / cleverer most clever /cleverest Three or more syllables All adjectives with three or more syllables form their comparatives and superlatives like this: attractive more attractive most attractive profitable more profitable most profitable expensive more expensive most expensive
  • 13.
    Charts, graphs anddiagrams Business English English English materials by Veronica Gilhooly © Learnwell Oy 2008 www.thelanguagemenu.com Business English Page 12 What are the comparative and superlative forms of these adjectives Adjective Comparative Superlative accurate certain convenient correct dangerous happy likely modern new possible probable up-to-date http://international.holmesglen.vic.edu.au/ielts_writing.pdf
  • 14.
    Charts, graphs anddiagrams Business English English Introducing visuals • I'd like you to look at this graph... • Let me show you this pie chart... • Let's have a look at this model... • Let's turn to this map... • To illustrate my point let’s look at some diagrams... • As you can see from these figures... • If you look at these photographs you'll see... • If you look at this bar chart you'll notice... • If you look at this histogram you'll appreciate... • If you look at this flow chart you'll understand ... • If you look at this matrix... Naming the parts of diagrams The vertical axis represents total annual sales. The horizontal axis shows our market share. The curve, The solid line, The dotted line, The broken line, The shaded area, The unshaded section, The dotted column, The coloured segment, The red bar… English materials by Veronica Gilhooly © Learnwell Oy 2008 www.thelanguagemenu.com Business English Page 13
  • 15.
    Charts, graphs anddiagrams Business English English Explaining diagrams • Sales rose slightly in the final quarter. • Profits fell a little last year. • Demand increased gently • Turnover decreased steadily • Turnover dropped suddenly • Turnover decreased quickly. • Demand increased rapidly. • Profits fell dramatically. • At the beginning of this year sales stagnated. • In the middle of August profits slumped. • At the end of last year demand peaked. • In the first quarter of 2008 sales plummeted. • In the second quarter of 2007 sales flattened out. • In the third quarter of 2007 sales leveled off. • In the last quarter of 2007 sales remained steady. English materials by Veronica Gilhooly © Learnwell Oy 2008 www.thelanguagemenu.com Business English Page 14
  • 16.
    Charts, graphs anddiagrams Business English English Useful phrases for presentations Signalling a start: - Right, ladies and gentlemen. Shall we begin? - OK, I'd like to begin by ... - Right then, everybody ... Greetings: - Good morning, ladies and gentlemen. - I'd like to welcome you all on behalf of NKS. - I'd like to say how happy I am to be here today. Introducing yourself: - My name is Richard Delmas. - I'm the Marketing Manager here. - I'd like to introduce myself. My name is ... - Let me introduce myself. My name is ... Introducing people: - I'd like to introduce Mr Peters from Datacom. - May I introduce ... - Let me introduce ... The objective of your presentation: - My objective this afternoon is to inform you... - I'm here today to give you... - My purpose today is to introduce you to... - My aim this morning is to... The length of time your presentation will take: - My presentation will last twenty-five minutes. - I will talk for fifteen minutes. Structuring: - My presentation is split into three key areas. - Firstly ... Secondly ... Thirdly ... - To begin with ... After this ... Finally ... English materials by Veronica Gilhooly © Learnwell Oy 2008 www.thelanguagemenu.com Business English Page 15
  • 17.
    Charts, graphs anddiagrams Business English English Saying when your audience may ask questions: - There will be time for questions at the end... - Please feel free to interrupt me as I go along. Introducing topics: - I want to look at ... - I'd like to review ... - I want to discuss ... - I'm going to analyse ... - I want to cover ... - I'd like to talk about ... Moving on: - Let's now move on to ... - I'd like to go on to ... - This brings me to ... - I now want to ... Looking back: - Let's look back for a moment ... - To go back to ... - As I said before ... Adding: - In addition ... - I might add that ... - Furthermore ... - Moreover ... Dealing with interruptions: - Perhaps I could return to that point later on? - If I might just finish? - If you'd allow me to continue? Summarising and concluding - To sum up then, ... - To summarise my main points ... - I'd like to conclude by reminding you that ... - Let me end by ... - I'd like to finish ... - In conclusion, may I remind you ... - Finally, ... English materials by Veronica Gilhooly © Learnwell Oy 2008 www.thelanguagemenu.com Business English Page 16
  • 18.
    Charts, graphs anddiagrams Business English English Asking for questions: - You no doubt have many questions ... - If there are any questions ... - I'm sure you have many questions ... Playing for time: - That's an interesting question. - I'm glad you asked that question. - You've raised an important point there. - That's a difficult question. Closing question time: - Perhaps on that note we could end? - I'm afraid that's all we have time for. Thanking: - I'd like to thank you all on behalf of Company X. - I'd like to thank you all for your participation. Now choose a topic, draw a graph or a diagram and make your own presentation. English materials by Veronica Gilhooly © Learnwell Oy 2008 www.thelanguagemenu.com Business English Page 17
  • 19.
    MD: veronica.gilhooly@thelanguagemenu.com Tel:050 531 1453 Translations: translations@thelanguagemenu.com Tel: 045 112 9724 Learnwell Oy Tehtaankatu 7 00140 Helsinki Finland General inquiries: office@thelanguagemenu.com Phone: +358 45 130 1114 Contact information www.thelanguagemenu.com