SlideShare a Scribd company logo
1 of 2
Trade Leader performance 1 Chart based on actual monthly Trade Leader results from March 1, 2011 through August 31, 2011 for the 17 Trade Leader accounts in the program on September 6. Trade Leader past performance is not necessarily indicative of future results. Investor returns may vary materially from Trade Leader returns based on slippage, fees, broker spreads, volatility or other market conditions. If you place additional trades in your account or you modify or cancel an order generated by your program you may achieve a materially different result than the Trade Leader(s) that you follow. Your trading program will follow the same leverage of each Trade Leader whose signals you have incorporated into your program; and that leverage can vary by Trade Leader and by trade. By increasing or decreasing the amount of capital you allocate to follow the signals of a particular Trade Leader, you may achieve materially different profits or losses than the Trade Leader and you may be increasing or decreasing the risk of your program.
Trade Leaders deliver real results 2 Notes: 1. Trade Leader returns are based on the average performance of Currensee Trade Leaders. Investor returns may vary materially from Trade Leader returns based on slippage, fees, broker spreads, volatility or other market conditions. If you place additional trades in your account or you modify or cancel an order generated by your program you may achieve a materially different result than the Trade Leader(s) that you follow. Your trading program will follow the same leverage of each Trade Leader whose signals you have incorporated into your program; and that leverage can vary by Trade Leader and by trade. By increasing or decreasing the amount of capital you allocate to follow the signals of a particular Trade Leader, you may achieve materially different profits or losses than the Trade Leader and you may be increasing or decreasing the risk of your program. 2. Three month returns are cumulative returns from June 1, 2011 through August 31, 2011 for the 17 Trade Leaders in the program on September 6, 2011. 3. Six month returns are cumulative returns from March 1, 2011 through August 31, 2011 for the 17 Trade Leaders in the program on September 6, 2011. 4. Barclay CTA Index is the BarclayHedge.com index of 500+ Commodity Trading Advisors (CTAs). 5. Gold returns are based on the results of SPDR ETF GLD. 6. S&P 500 returns are based on the results of SPDR ETF SPY. Past performance is no indication of future results.

More Related Content

Similar to September Performance

Financial statement analysis
Financial statement analysisFinancial statement analysis
Financial statement analysis
Nikhiliit
 
Financial goals and performa statement
Financial goals and performa statementFinancial goals and performa statement
Financial goals and performa statement
Soniya Bhasin
 
2011 - Q1 - Commentary
2011 - Q1 - Commentary2011 - Q1 - Commentary
2011 - Q1 - Commentary
Drew Beja
 
Zep Inc. Company Overview - October 2013
Zep Inc. Company Overview - October 2013Zep Inc. Company Overview - October 2013
Zep Inc. Company Overview - October 2013
Zep Inc.
 

Similar to September Performance (20)

Swing Trading System by AlgorithmicTrading.net
Swing Trading System by AlgorithmicTrading.netSwing Trading System by AlgorithmicTrading.net
Swing Trading System by AlgorithmicTrading.net
 
Aimia Q1 2017 Financial Results
Aimia Q1 2017 Financial ResultsAimia Q1 2017 Financial Results
Aimia Q1 2017 Financial Results
 
Time weighted vs-dollar-weighted returns
Time weighted vs-dollar-weighted returnsTime weighted vs-dollar-weighted returns
Time weighted vs-dollar-weighted returns
 
leverage (book ch).pdf
leverage (book ch).pdfleverage (book ch).pdf
leverage (book ch).pdf
 
Aimia Q4 2016 Financial Highlights Presentation
Aimia Q4 2016 Financial Highlights PresentationAimia Q4 2016 Financial Highlights Presentation
Aimia Q4 2016 Financial Highlights Presentation
 
Jazzit Score sample_32_page_report
Jazzit Score sample_32_page_reportJazzit Score sample_32_page_report
Jazzit Score sample_32_page_report
 
Jazzit score sample_32_page_report
Jazzit score sample_32_page_reportJazzit score sample_32_page_report
Jazzit score sample_32_page_report
 
Boom may13 pres
Boom may13 presBoom may13 pres
Boom may13 pres
 
Financial statement analysis
Financial statement analysisFinancial statement analysis
Financial statement analysis
 
Diligence deck
Diligence deckDiligence deck
Diligence deck
 
Moneycation march 2015 newsletter; volume #3, issue #7
Moneycation march 2015 newsletter; volume #3, issue #7Moneycation march 2015 newsletter; volume #3, issue #7
Moneycation march 2015 newsletter; volume #3, issue #7
 
Financial goals and performa statement
Financial goals and performa statementFinancial goals and performa statement
Financial goals and performa statement
 
Aimia Q1 2016 Financial Highlights Presentation
Aimia Q1 2016 Financial Highlights PresentationAimia Q1 2016 Financial Highlights Presentation
Aimia Q1 2016 Financial Highlights Presentation
 
2011 - Q1 - Commentary
2011 - Q1 - Commentary2011 - Q1 - Commentary
2011 - Q1 - Commentary
 
9 Important Things To Consider In Quarterly Results Before Investing In Stock...
9 Important Things To Consider In Quarterly Results Before Investing In Stock...9 Important Things To Consider In Quarterly Results Before Investing In Stock...
9 Important Things To Consider In Quarterly Results Before Investing In Stock...
 
Aimia Q3 2015 Financial Highlights Presentation
Aimia Q3 2015 Financial Highlights PresentationAimia Q3 2015 Financial Highlights Presentation
Aimia Q3 2015 Financial Highlights Presentation
 
Zep Inc. Company Overview - October 2013
Zep Inc. Company Overview - October 2013Zep Inc. Company Overview - October 2013
Zep Inc. Company Overview - October 2013
 
Q3 2017 Financial Highlights
Q3 2017 Financial HighlightsQ3 2017 Financial Highlights
Q3 2017 Financial Highlights
 
Diplomat investor presentation january 2018
Diplomat investor presentation january 2018Diplomat investor presentation january 2018
Diplomat investor presentation january 2018
 
Dplo raymond james ir deck (3)
Dplo  raymond james ir deck (3)Dplo  raymond james ir deck (3)
Dplo raymond james ir deck (3)
 

September Performance

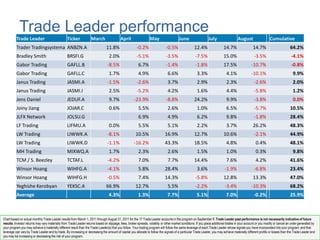
  • 1. Trade Leader performance 1 Chart based on actual monthly Trade Leader results from March 1, 2011 through August 31, 2011 for the 17 Trade Leader accounts in the program on September 6. Trade Leader past performance is not necessarily indicative of future results. Investor returns may vary materially from Trade Leader returns based on slippage, fees, broker spreads, volatility or other market conditions. If you place additional trades in your account or you modify or cancel an order generated by your program you may achieve a materially different result than the Trade Leader(s) that you follow. Your trading program will follow the same leverage of each Trade Leader whose signals you have incorporated into your program; and that leverage can vary by Trade Leader and by trade. By increasing or decreasing the amount of capital you allocate to follow the signals of a particular Trade Leader, you may achieve materially different profits or losses than the Trade Leader and you may be increasing or decreasing the risk of your program.
  • 2. Trade Leaders deliver real results 2 Notes: 1. Trade Leader returns are based on the average performance of Currensee Trade Leaders. Investor returns may vary materially from Trade Leader returns based on slippage, fees, broker spreads, volatility or other market conditions. If you place additional trades in your account or you modify or cancel an order generated by your program you may achieve a materially different result than the Trade Leader(s) that you follow. Your trading program will follow the same leverage of each Trade Leader whose signals you have incorporated into your program; and that leverage can vary by Trade Leader and by trade. By increasing or decreasing the amount of capital you allocate to follow the signals of a particular Trade Leader, you may achieve materially different profits or losses than the Trade Leader and you may be increasing or decreasing the risk of your program. 2. Three month returns are cumulative returns from June 1, 2011 through August 31, 2011 for the 17 Trade Leaders in the program on September 6, 2011. 3. Six month returns are cumulative returns from March 1, 2011 through August 31, 2011 for the 17 Trade Leaders in the program on September 6, 2011. 4. Barclay CTA Index is the BarclayHedge.com index of 500+ Commodity Trading Advisors (CTAs). 5. Gold returns are based on the results of SPDR ETF GLD. 6. S&P 500 returns are based on the results of SPDR ETF SPY. Past performance is no indication of future results.