
Downloaded 146 times
![Selected countries
Sources:
[1] EU-OSHA, 2017b
[2] Labour Force Survey 2015 (Eurostat)
Countries
Geographical
location
Insurance system[1]
% employed in services[2]
(EU average = 73.1%)
Finland North Mixed 73.1%
Germany West Bismarckian 73.9%
The Netherlands West Bismarckian 82.9%
Italy South Beveridgean 72.4%
Poland Central Bismarckian 58.3%](https://image.slidesharecdn.com/thevalueofosh-estimatingthesocietalcostsofwork-relatedinjuriesanddiseases-190712104834/75/The-value-of-OSH-Estimating-the-societal-costs-of-work-related-injuries-and-diseases-4-2048.jpg)

![Bottom-up model – estimation of cases
Non-fatal work-related injuries1
Fatal work-related injuries1
Non-fatal work-related diseases2,3
Different data sources, different scenarios of the case count. Baseline scenario:
o Count of compensated (accepted, recognized) and non-compensated non-
fatal cases for most types of diseases2; with the following exceptions:
o for cancers, circulatory diseases, respiratory diseases, and
musculoskeletal diseases we estimated case counts and used attributable
fractions to estimate the work-related cases3
Fatal work-related diseases3
Sources:
[1] ESAW 2015 (non-fatal cases of Poland and Italy are adjusted based on the fatal to non-fatal ratio). To estimate the number of non-
fatal cases with 1-3 workdays lost, the severity distribution in the LFS 2013 was applied
[2] National sources: Finland - Finnish Institute of Occupational Health (2012); Germany - DGUV Statistics (2013); The Netherlands -
NCvB statistiek, Nationale Registratie Beroepsziekten (2015); Italy - Banche dati static, occupational injury and disease (2015);
Poland: Choroby Zawodowe W Polsce W (2014)
[3] IHME 2015](https://image.slidesharecdn.com/thevalueofosh-estimatingthesocietalcostsofwork-relatedinjuriesanddiseases-190712104834/75/The-value-of-OSH-Estimating-the-societal-costs-of-work-related-injuries-and-diseases-8-2048.jpg)


This document assesses the societal costs of work-related injuries and diseases in Finland, Germany, the Netherlands, Italy, and Poland, employing both bottom-up and top-down models for estimation. It analyzes direct, indirect, and intangible costs associated with these incidents and emphasizes the need for improved data on work-related cases and healthcare costs. The findings highlight significant economic burdens on employers, workers, and society, necessitating better health and safety measures at work.
OSH is vital for well-being and business. The study focuses on societal costs of work-related injuries in Finland, Germany, Netherlands, Italy, and Poland.
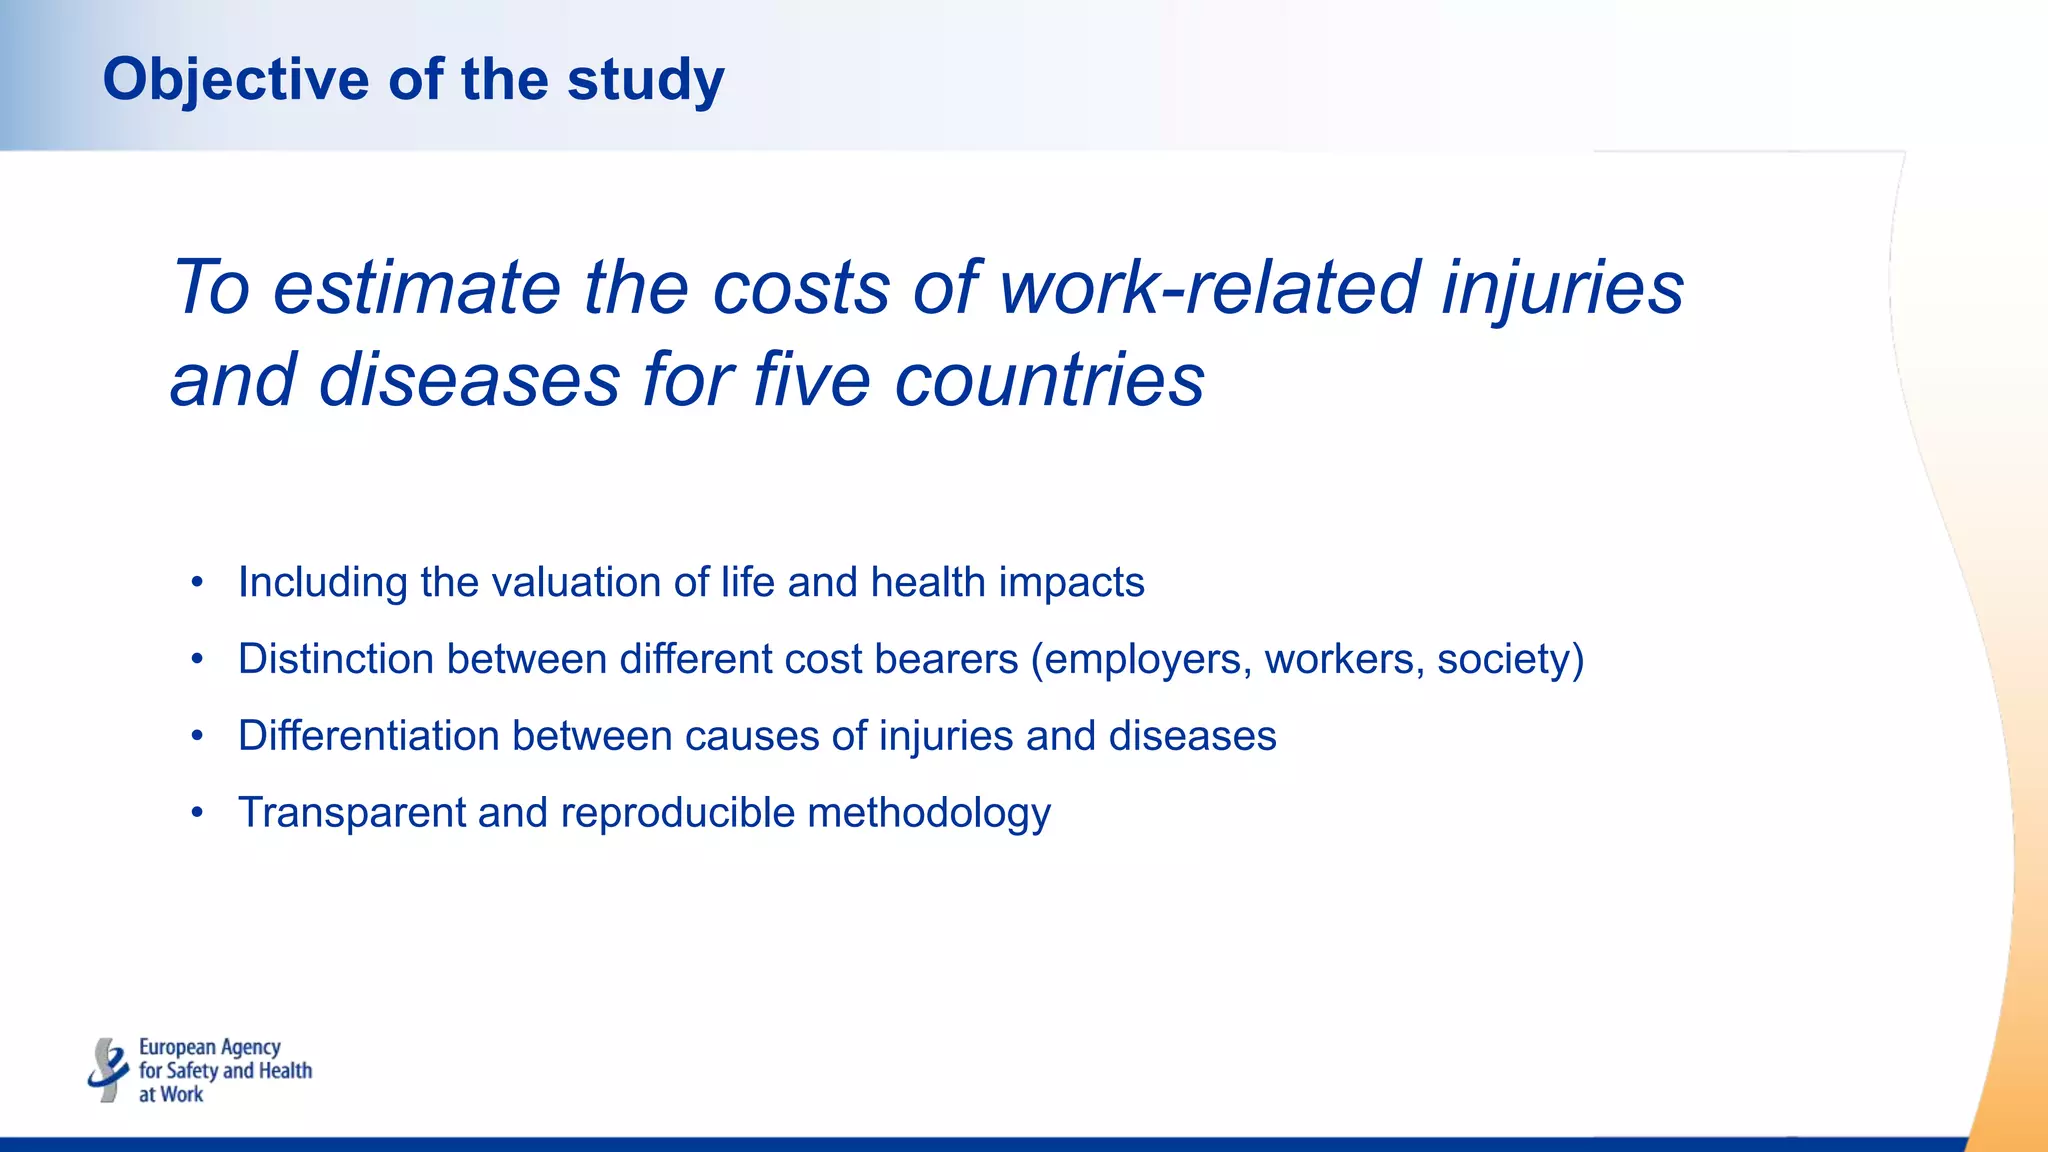
Objective: Estimate costs of work-related injuries and diseases in 5 countries with transparent methodology.
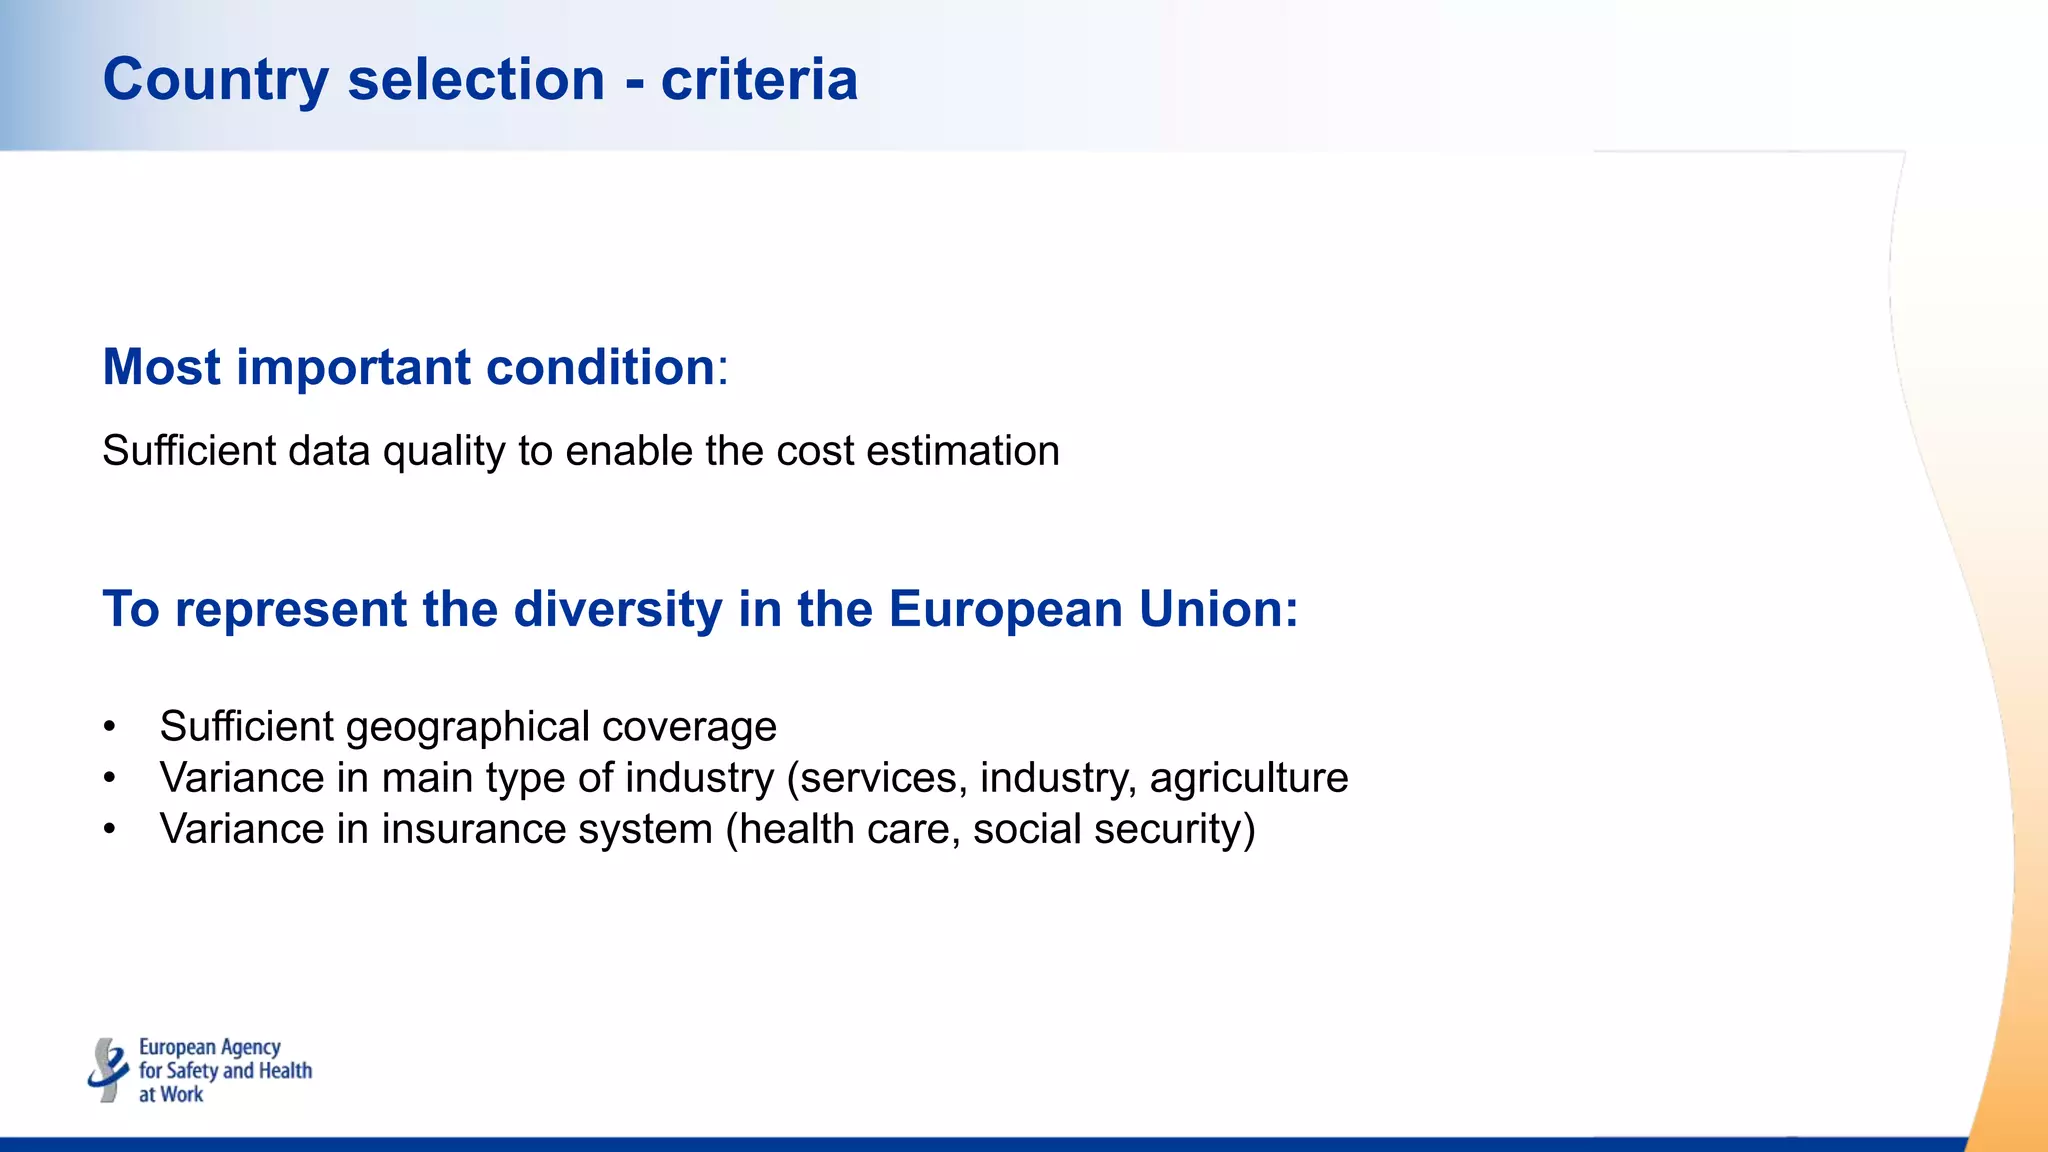
Countries were chosen based on data quality, geographic diversity, industry types (services, industry, agriculture), and insurance systems.
Selected countries listed with insurance systems and employment percentages in services. Data from EU-OSHA and Eurostat.
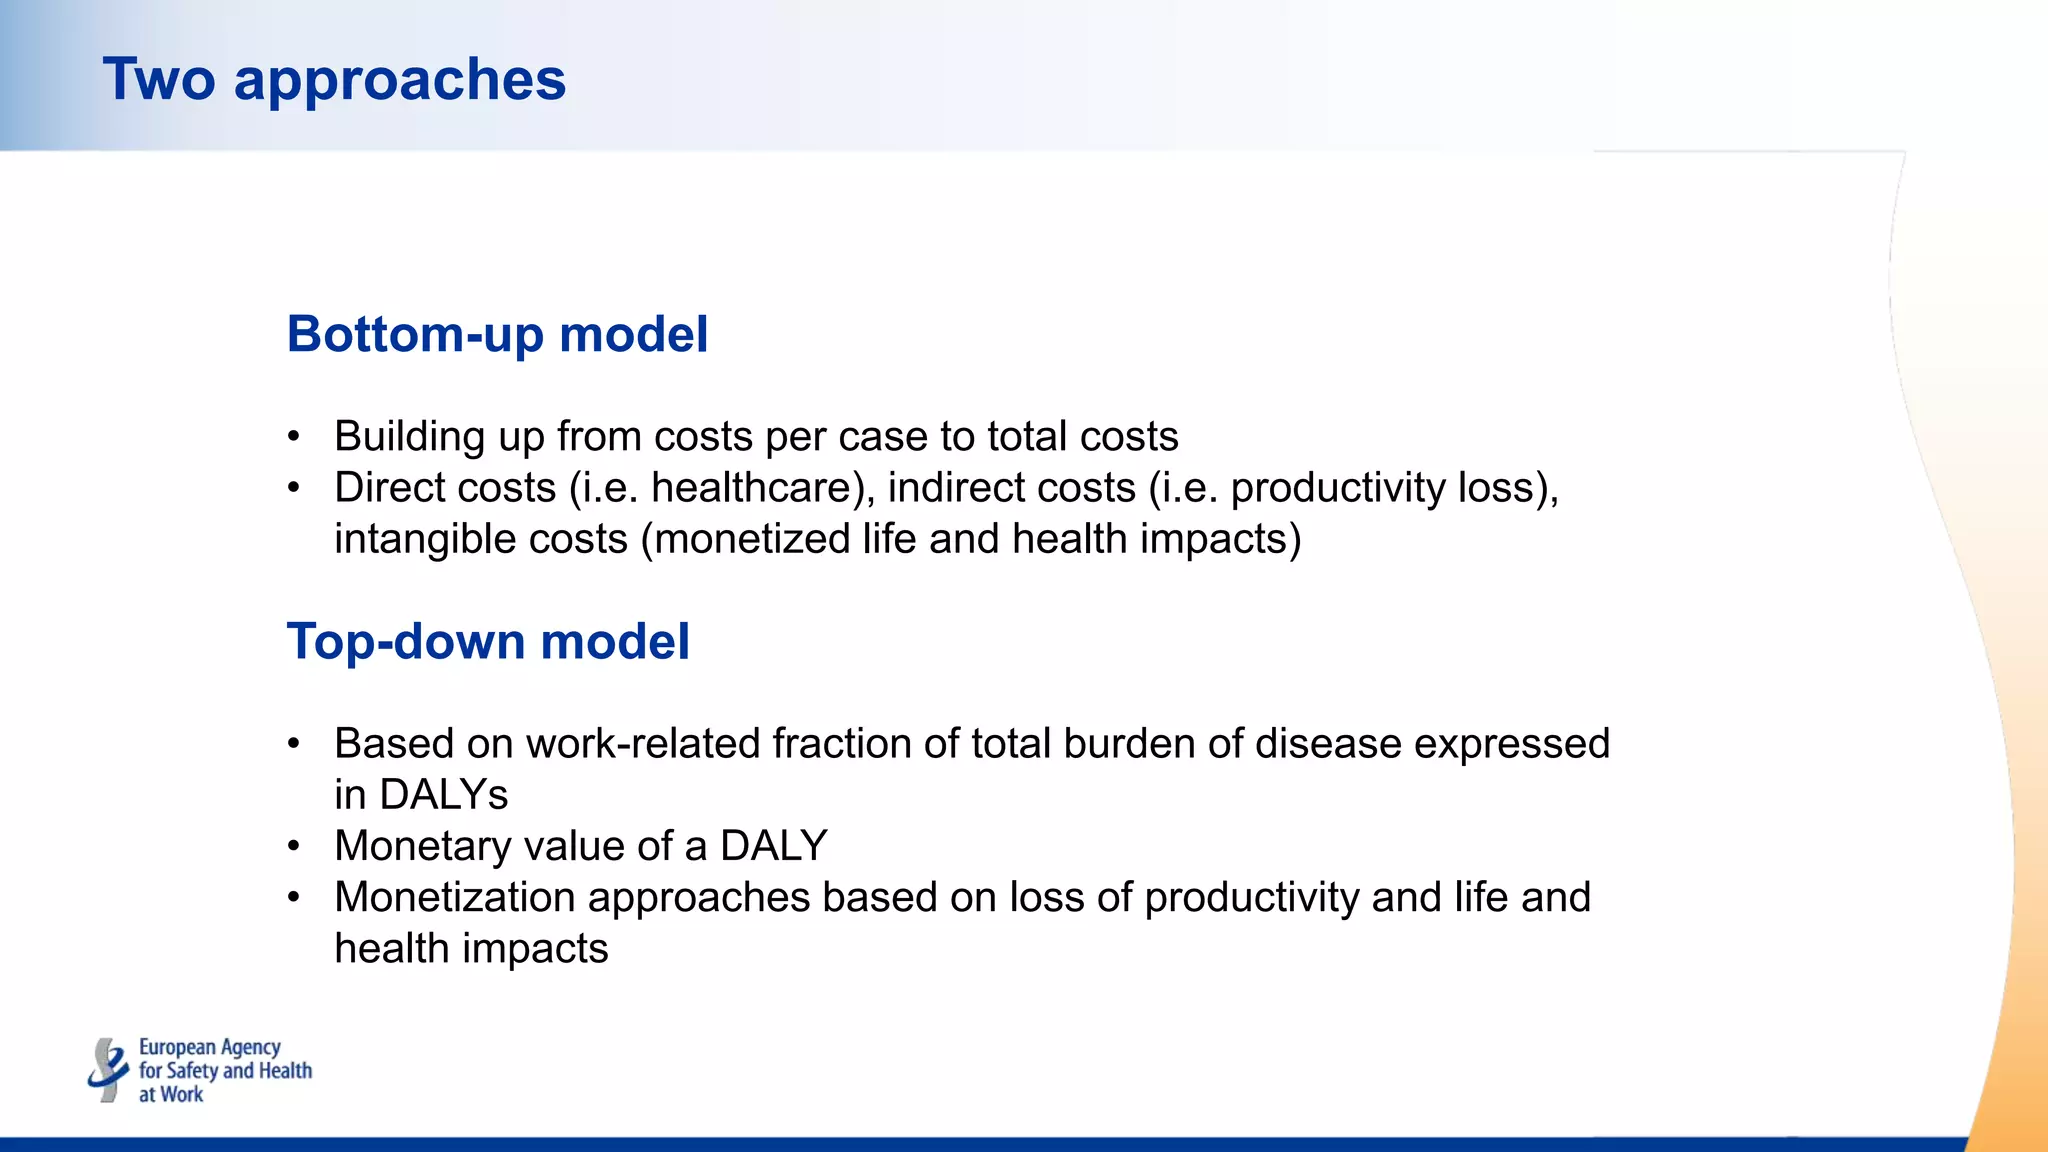
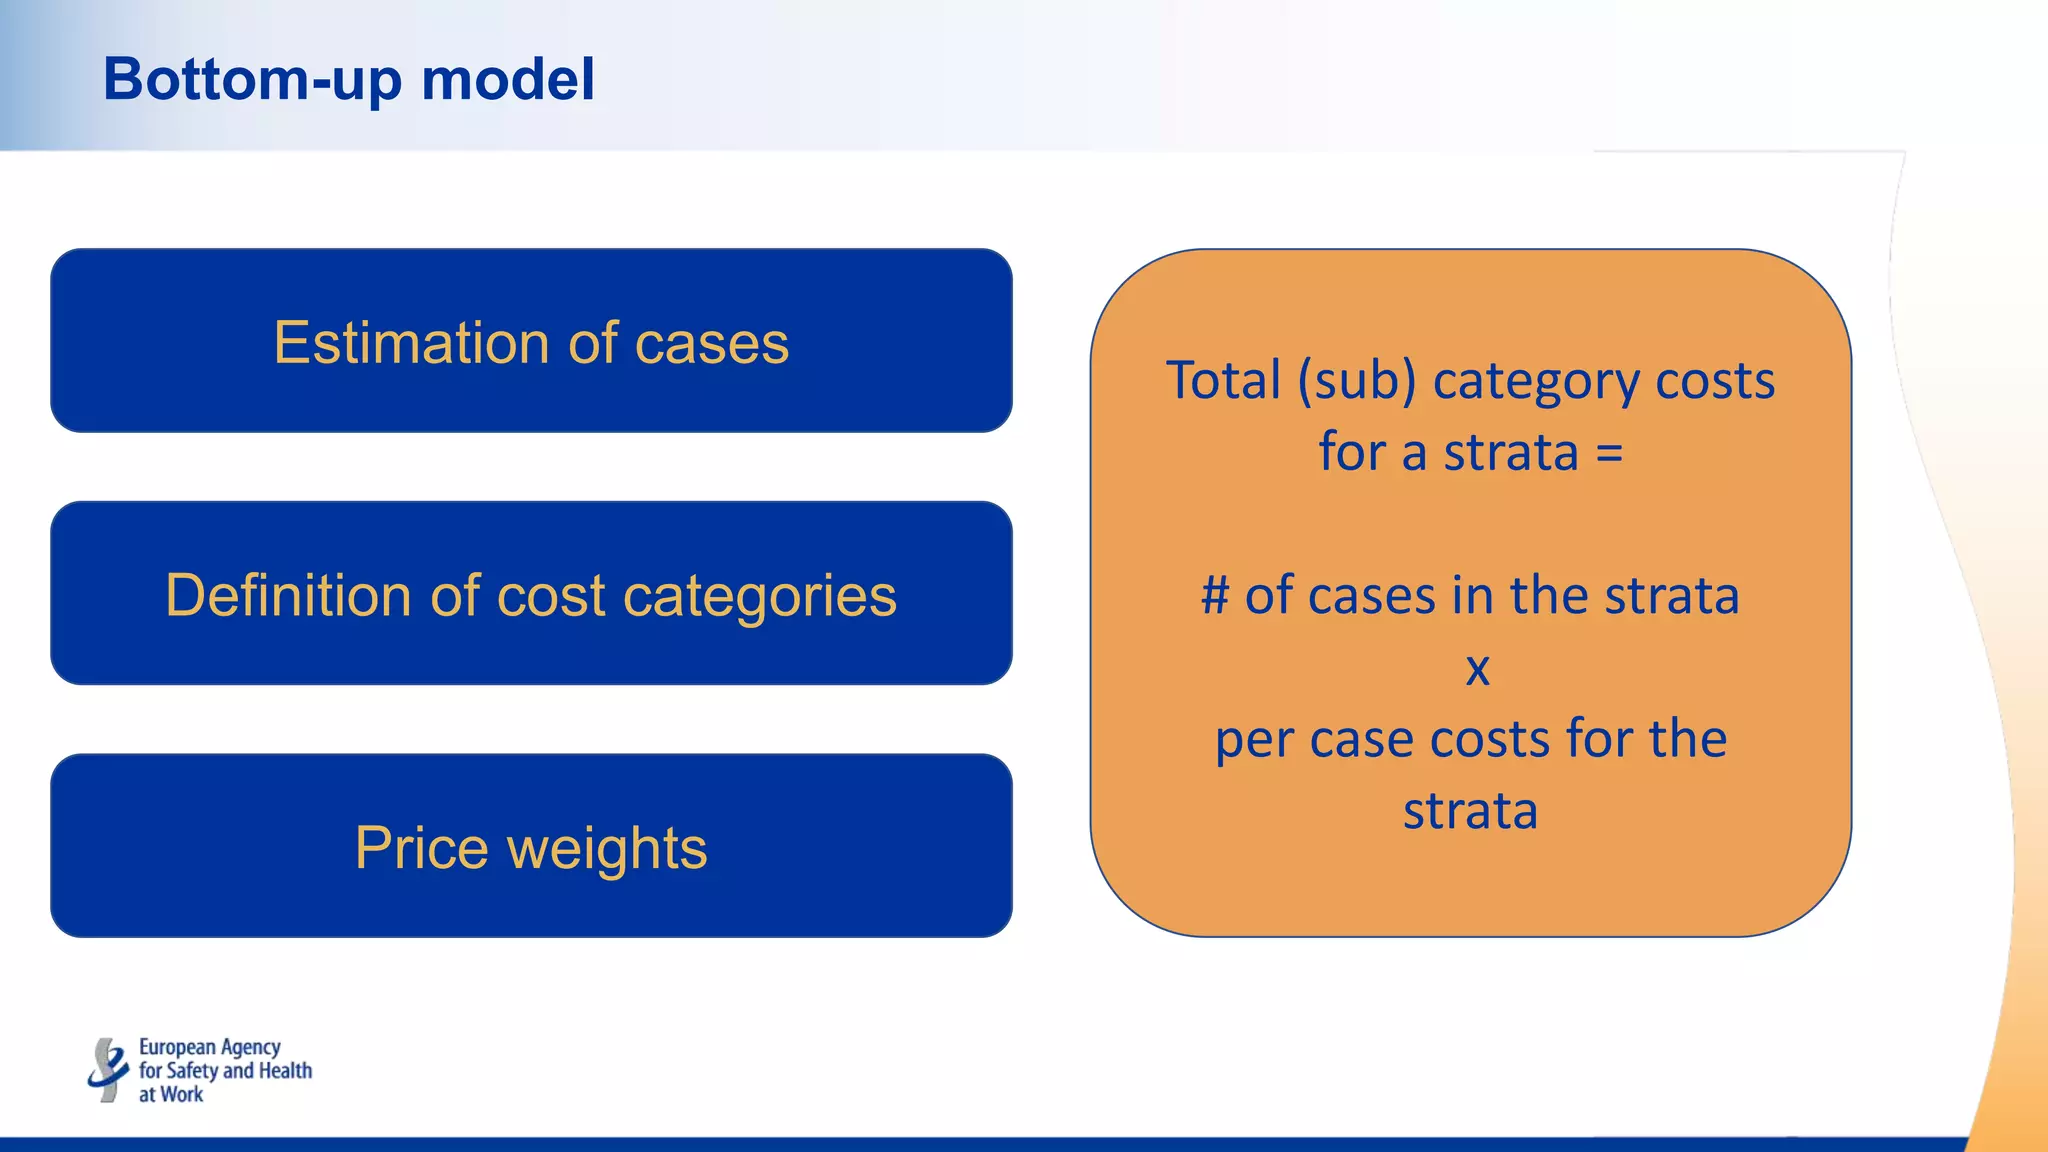
Describes two models for estimating costs: a detailed bottom-up model and a broader top-down model based on disease burden.
Bottom-up model builds cost estimation from individual case costs to total costs, incorporating various cost categories.
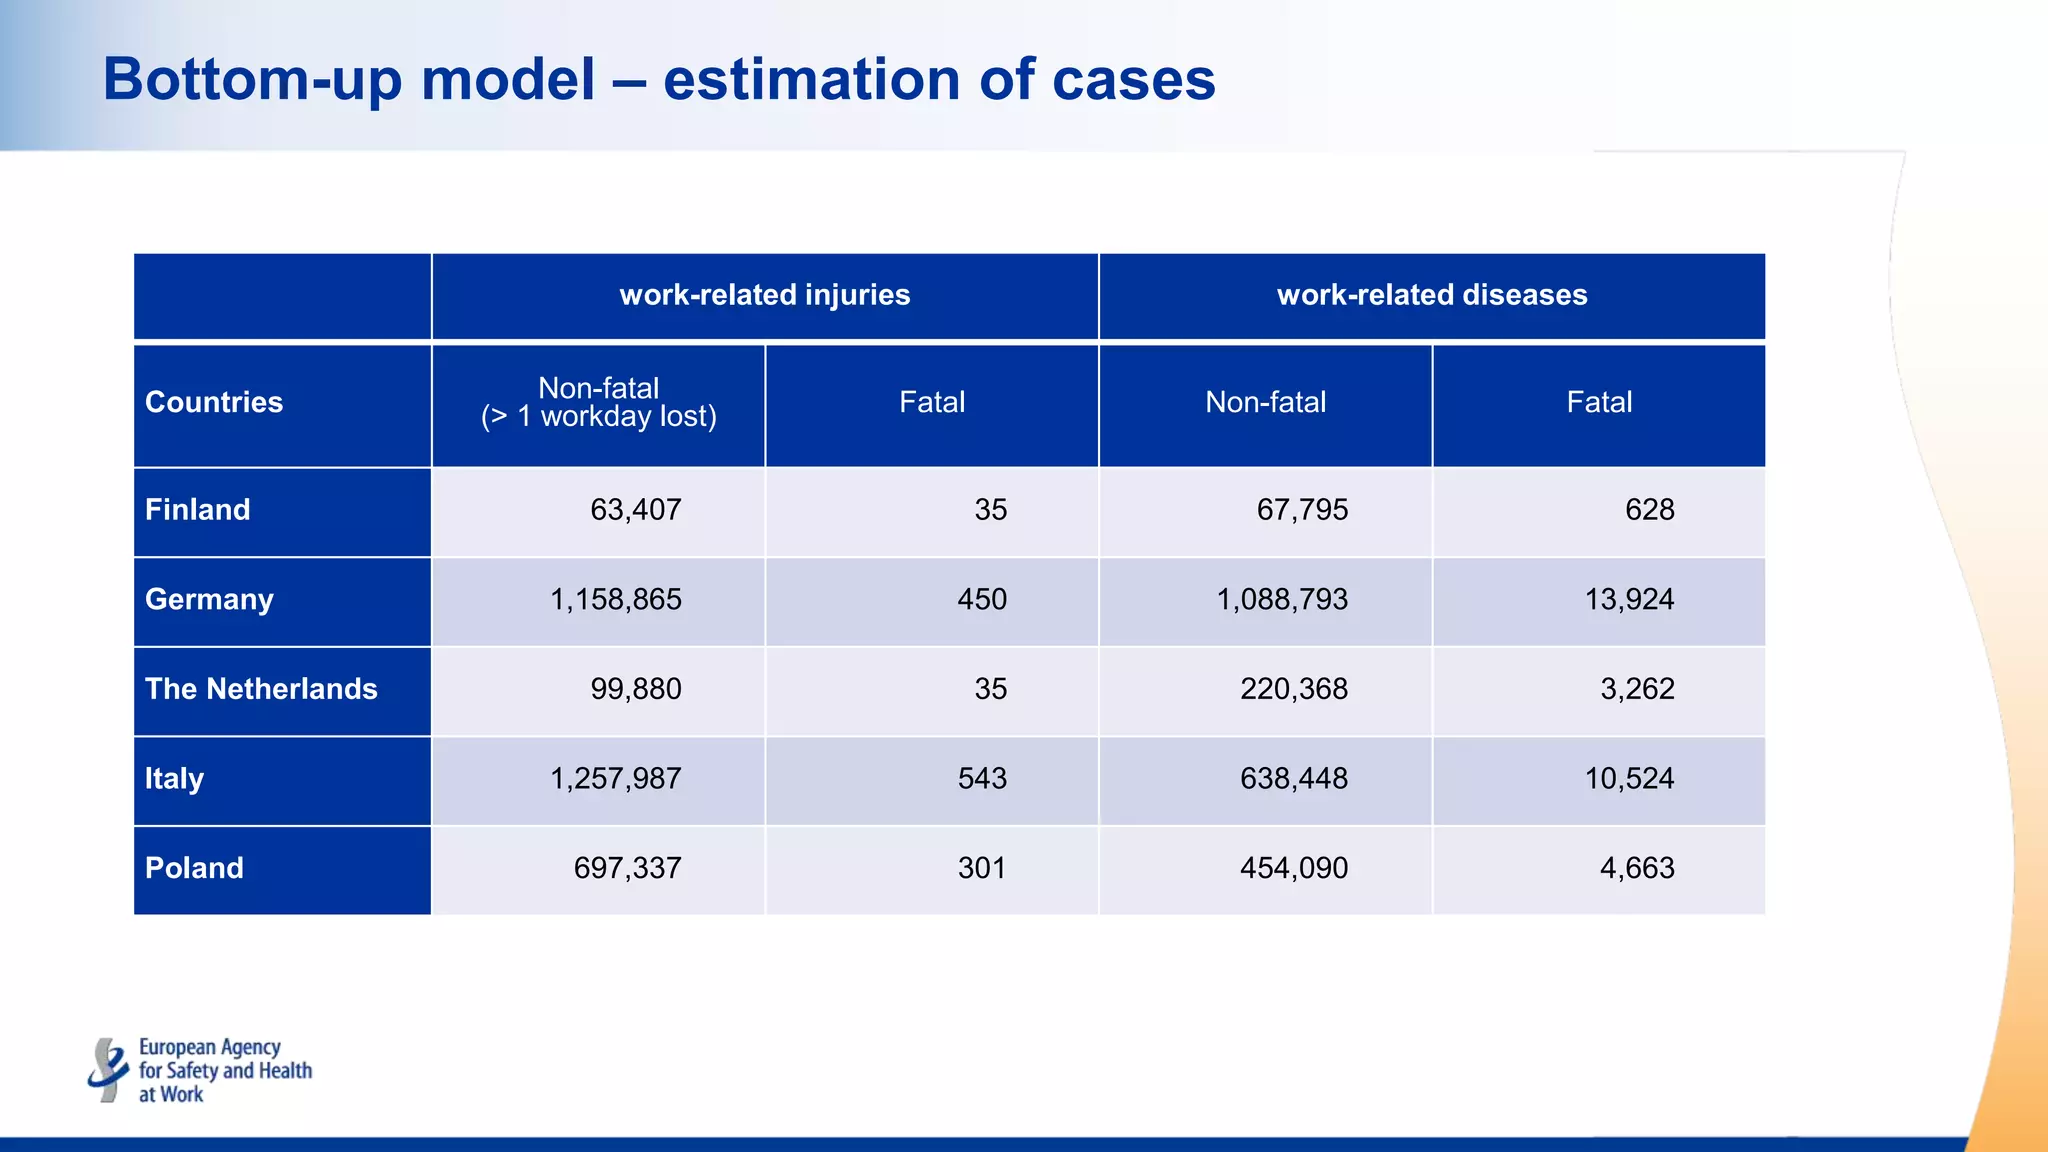
Estimation involves non-fatal and fatal work-related injuries and diseases, with specific data sources and methodologies used.
Quantifies non-fatal and fatal injuries/diseases across five countries, presenting specific case statistics.
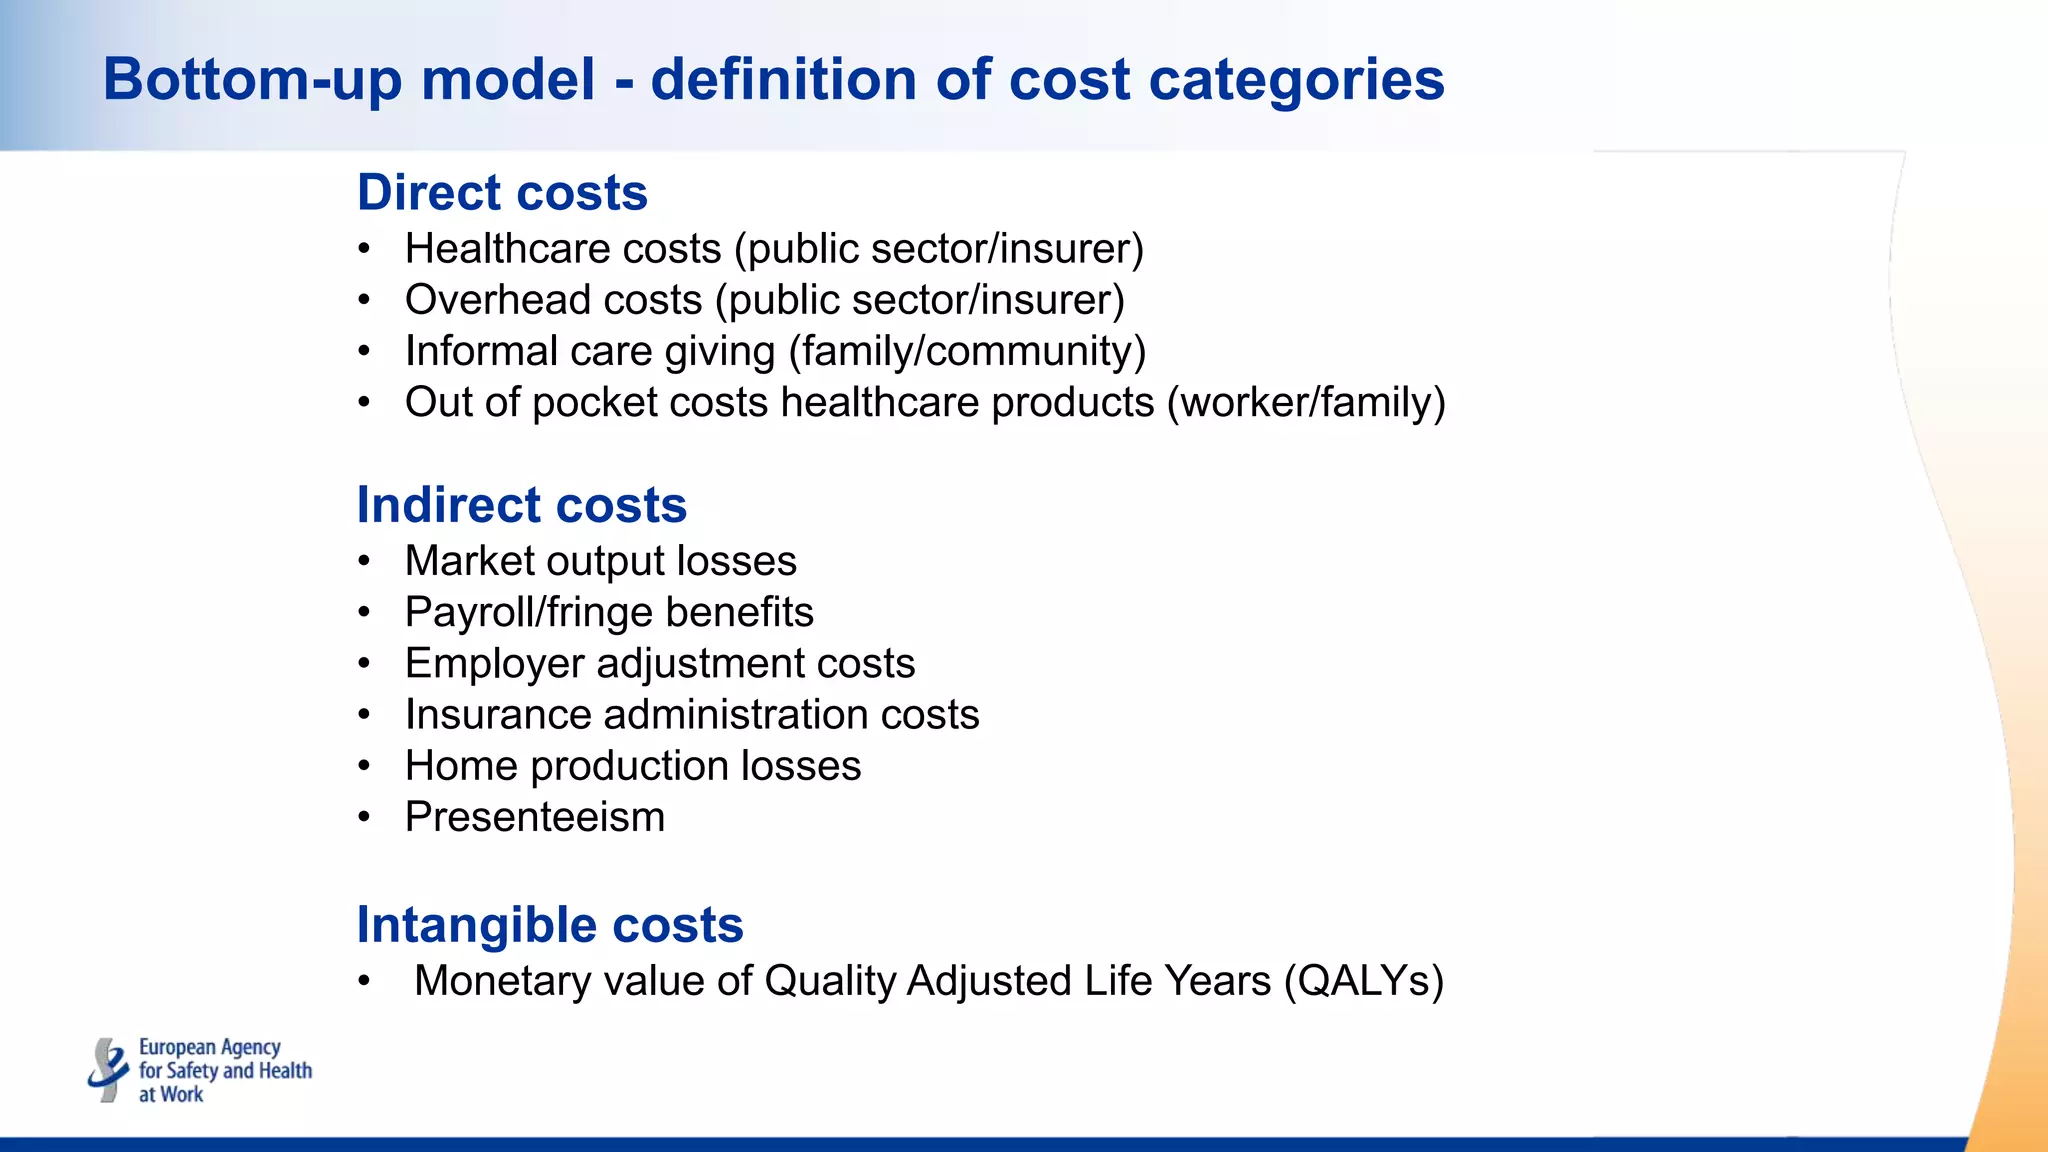
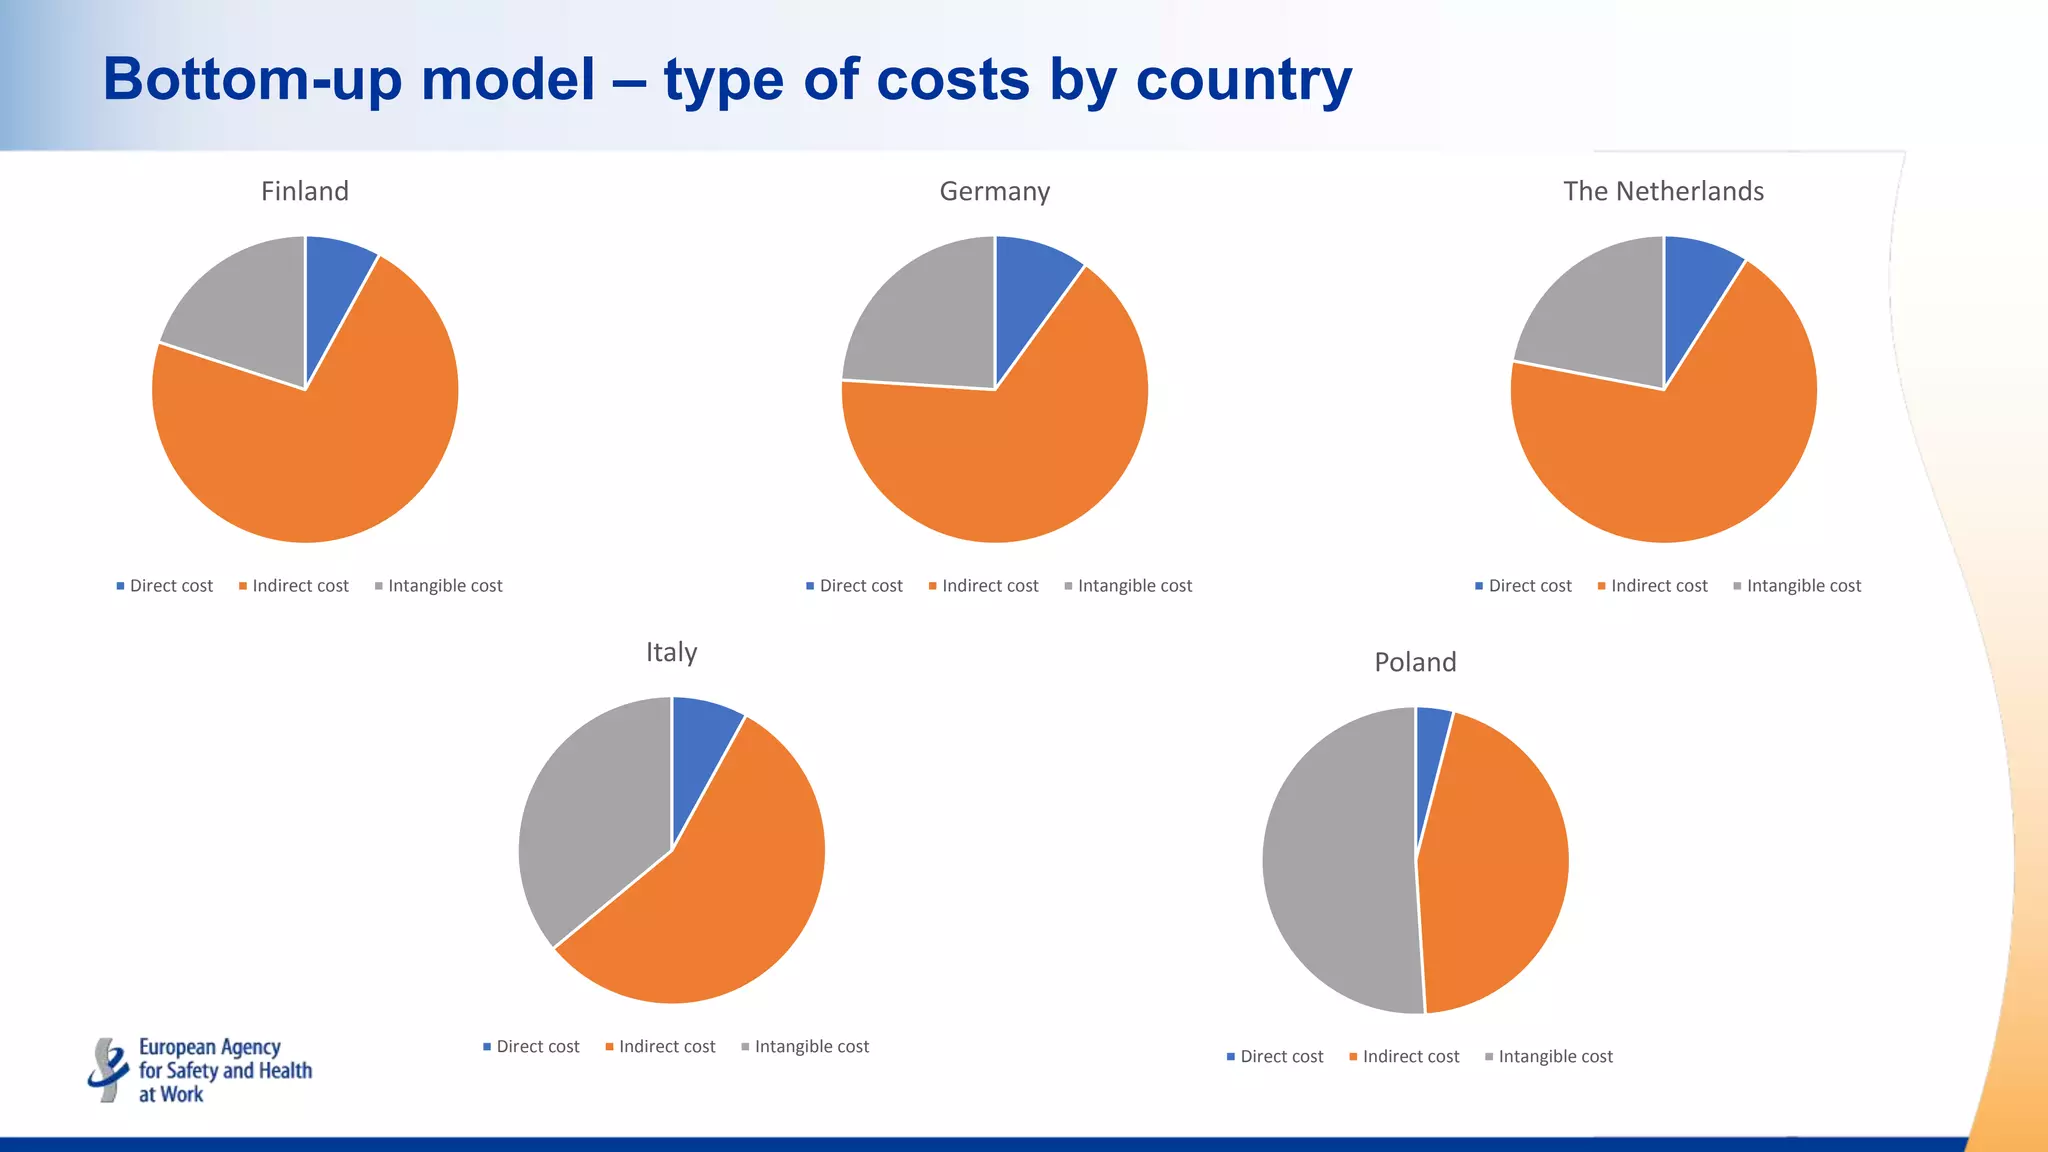
Defines direct, indirect, and intangible costs in regard to work-related injuries, detailing types and contributors.
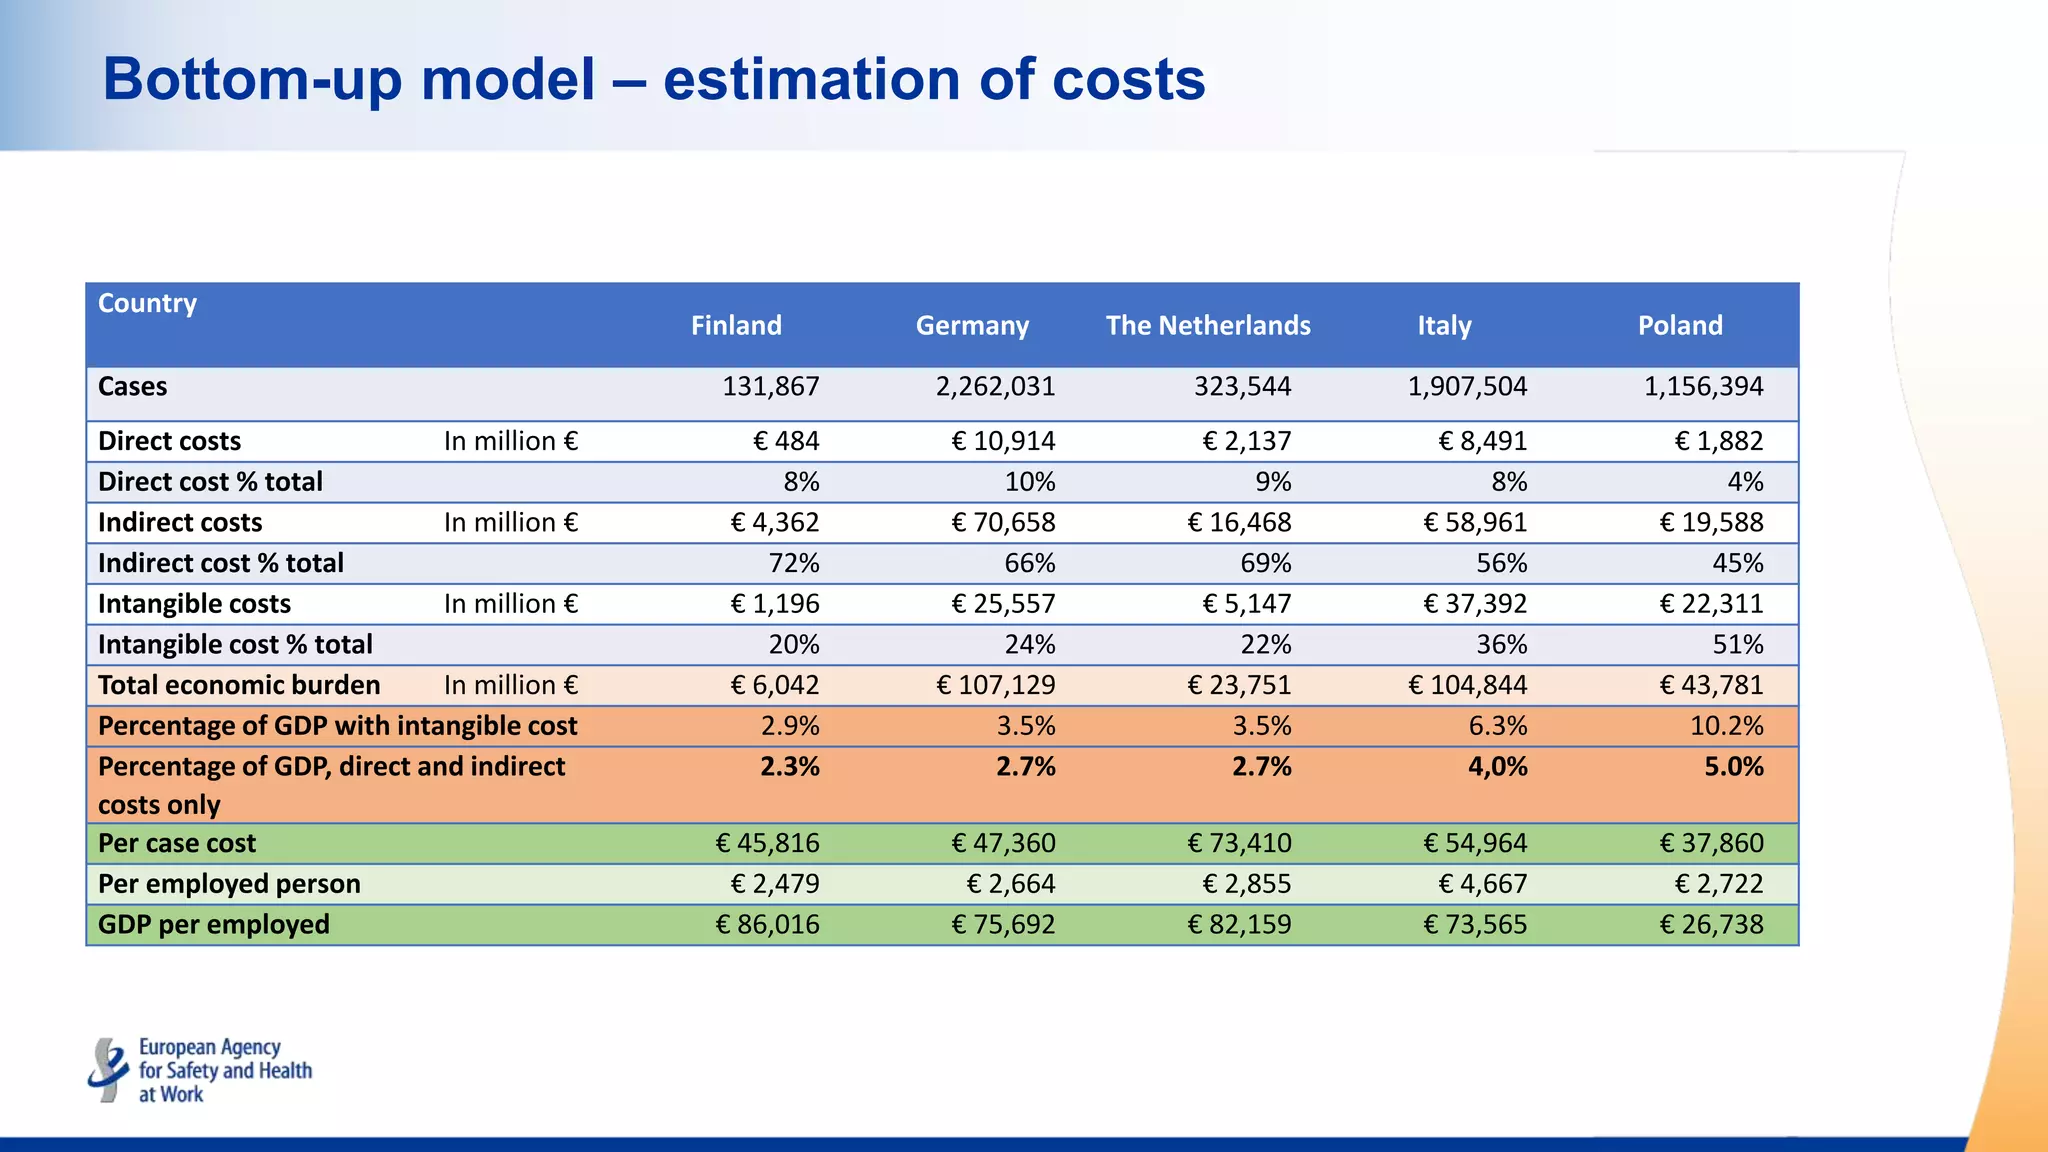
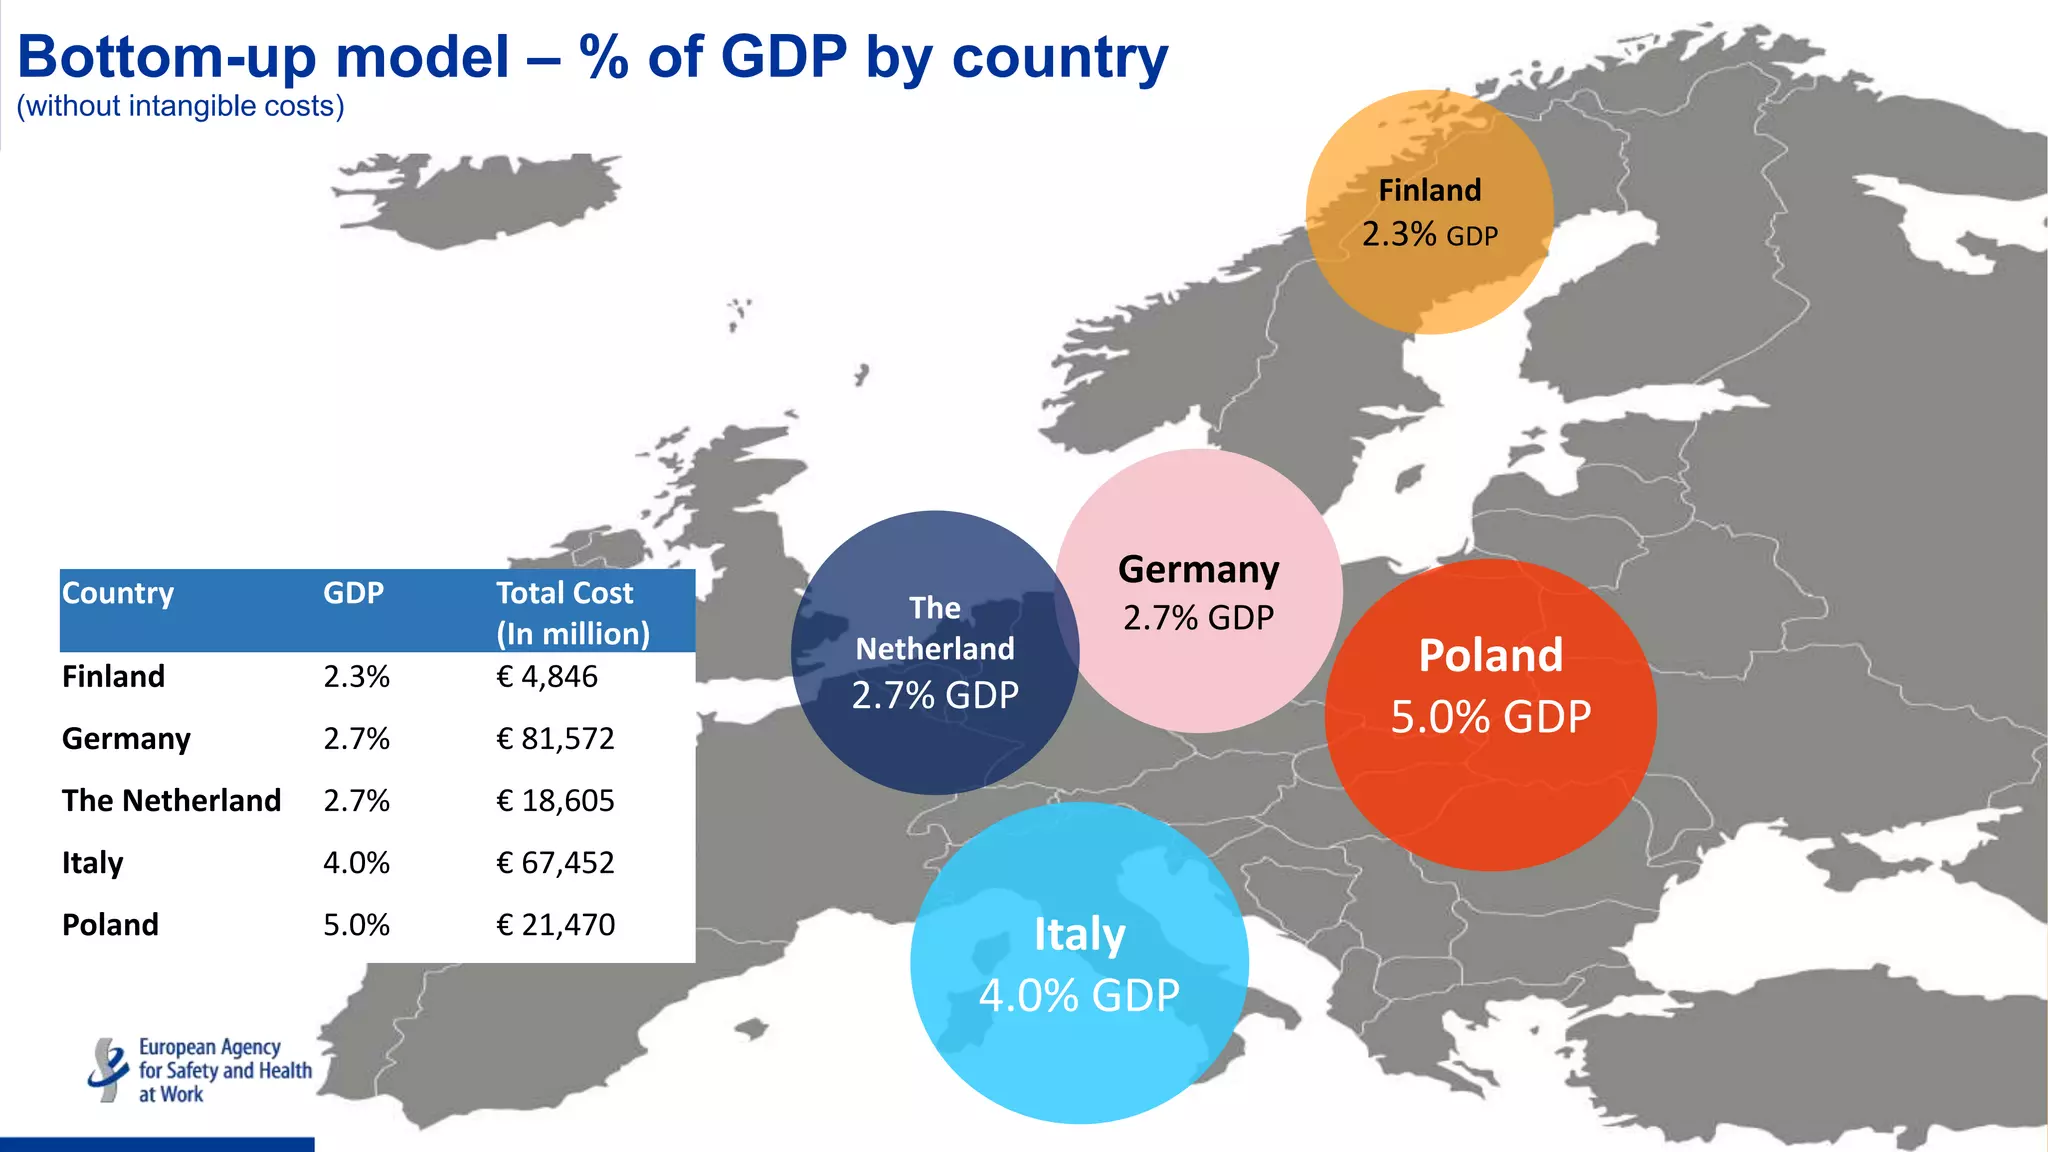
Presents total cases and associated costs by country, including economic burden as a percentage of GDP.
Visual representation of direct, indirect, and intangible costs as incurred by each selected country.
Analyzes total costs as a percentage of GDP excluding intangible costs for the selected countries.
Breakdown of costs per case and per employed person across the selected countries.
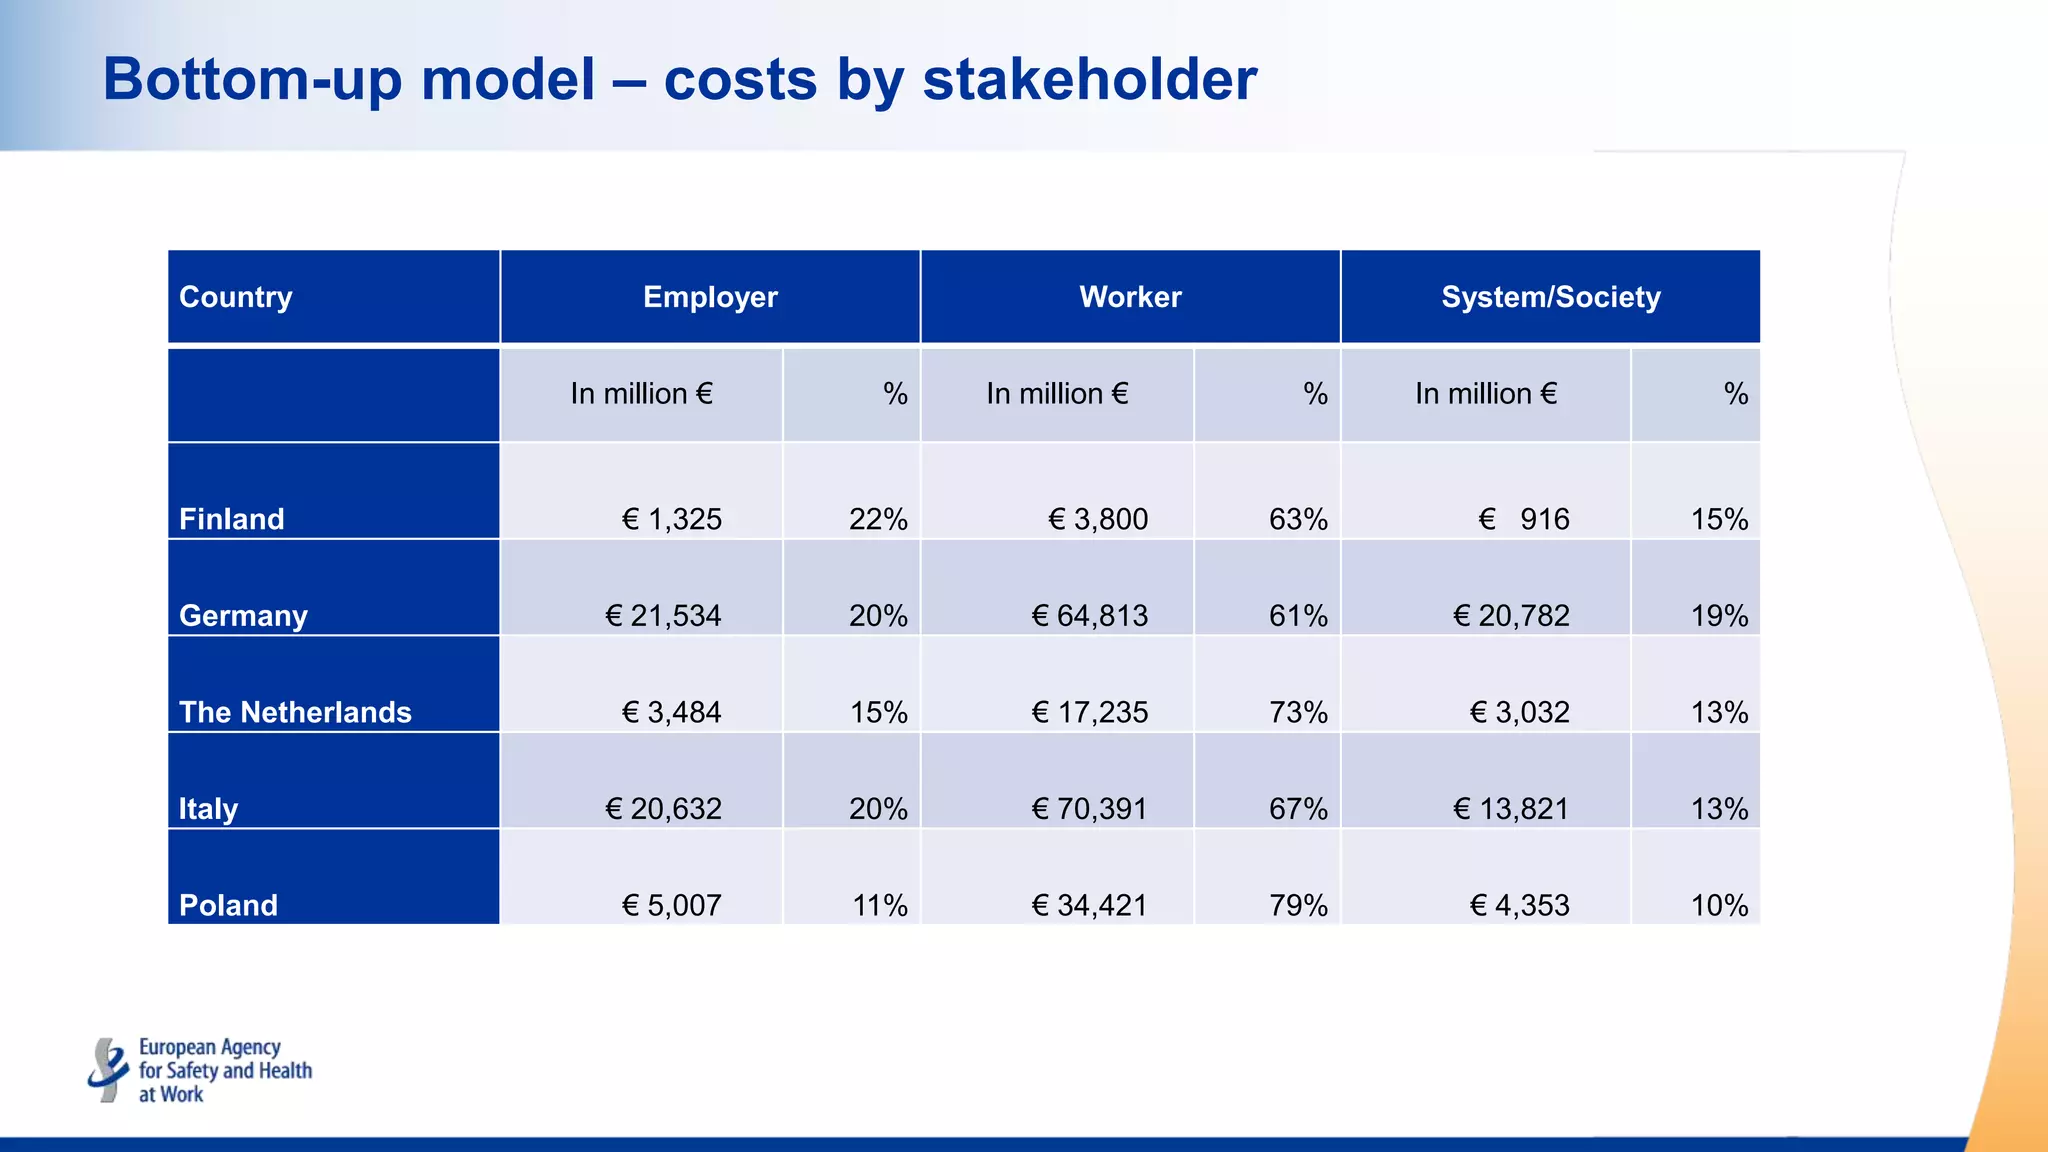
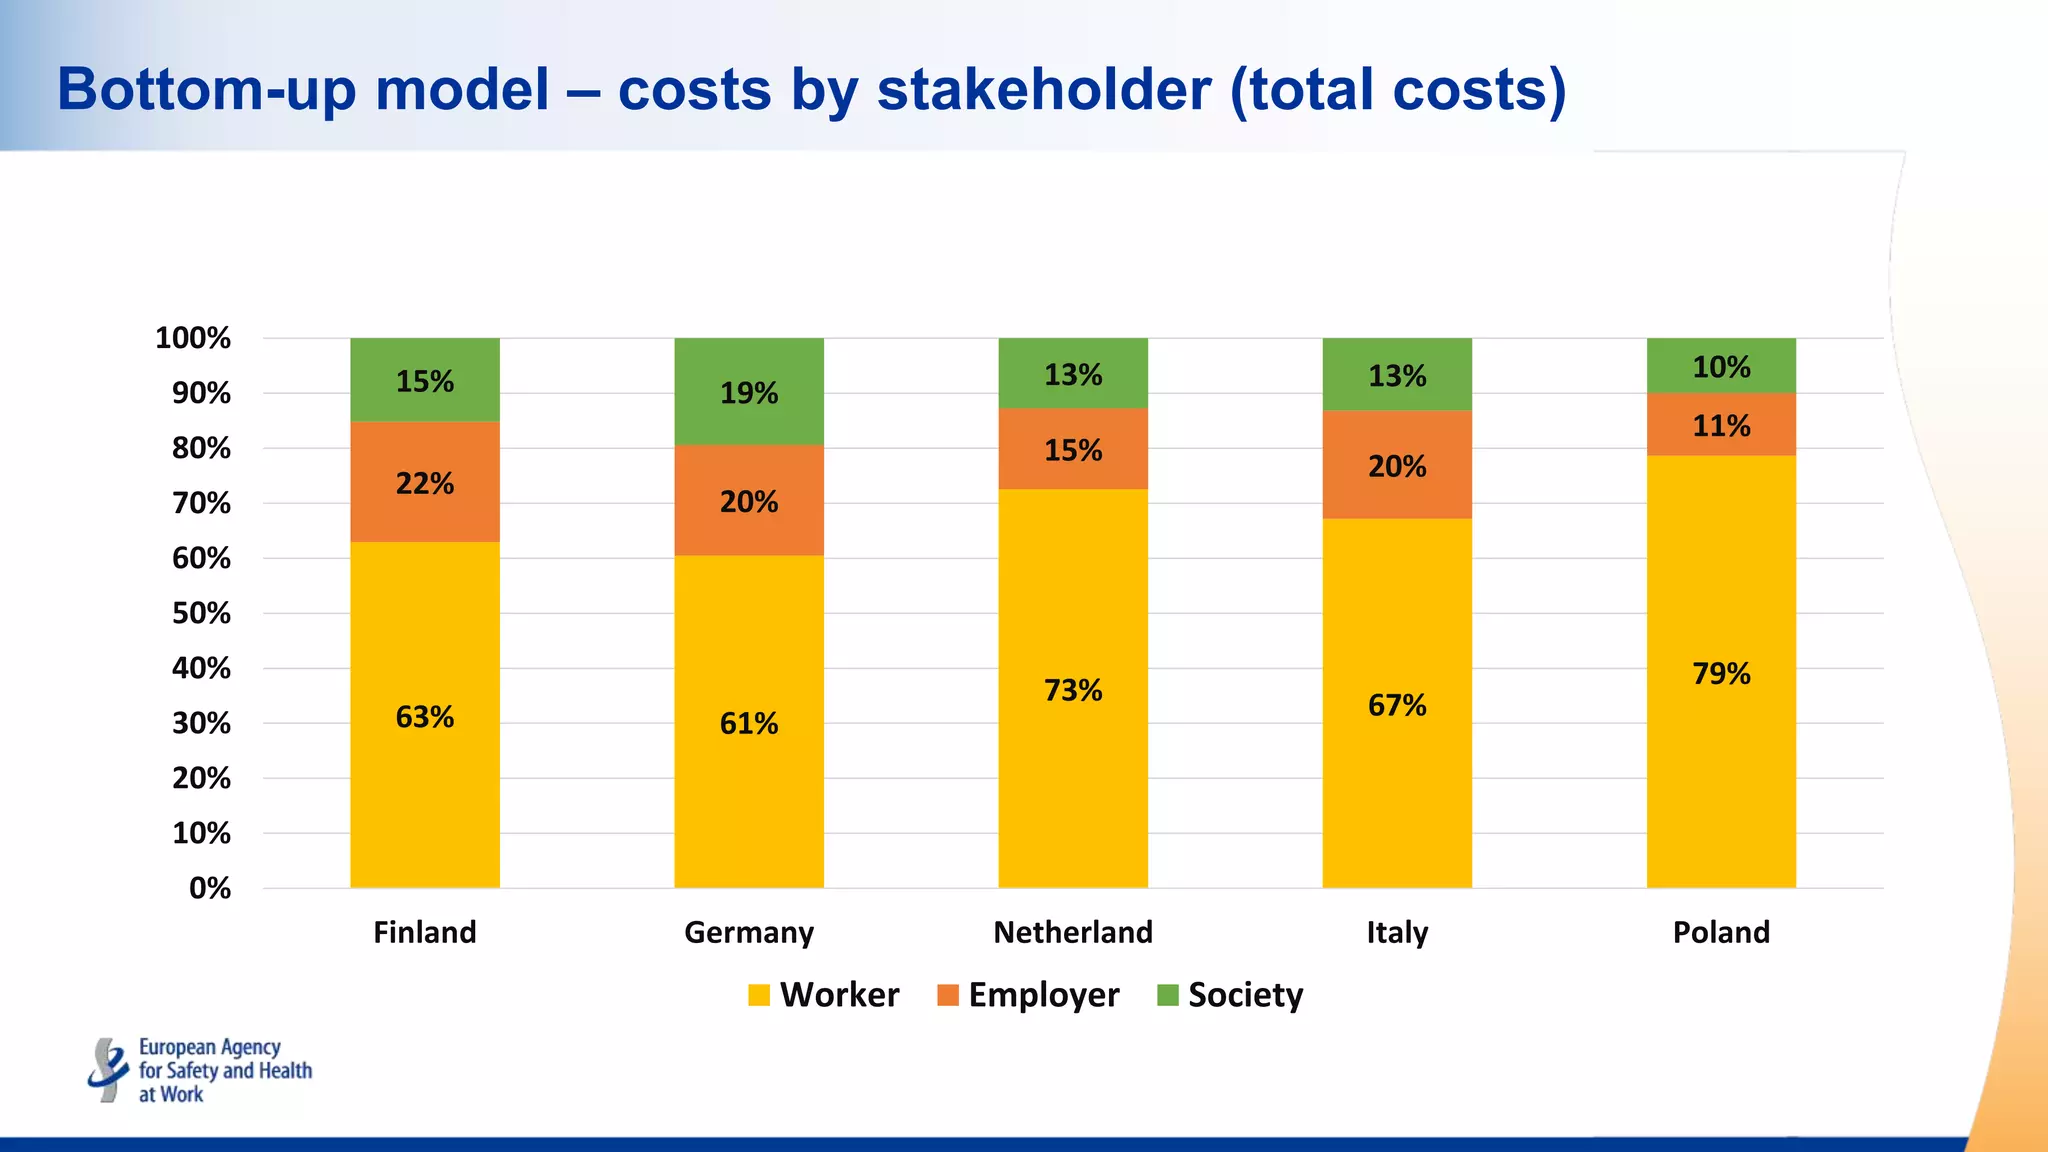
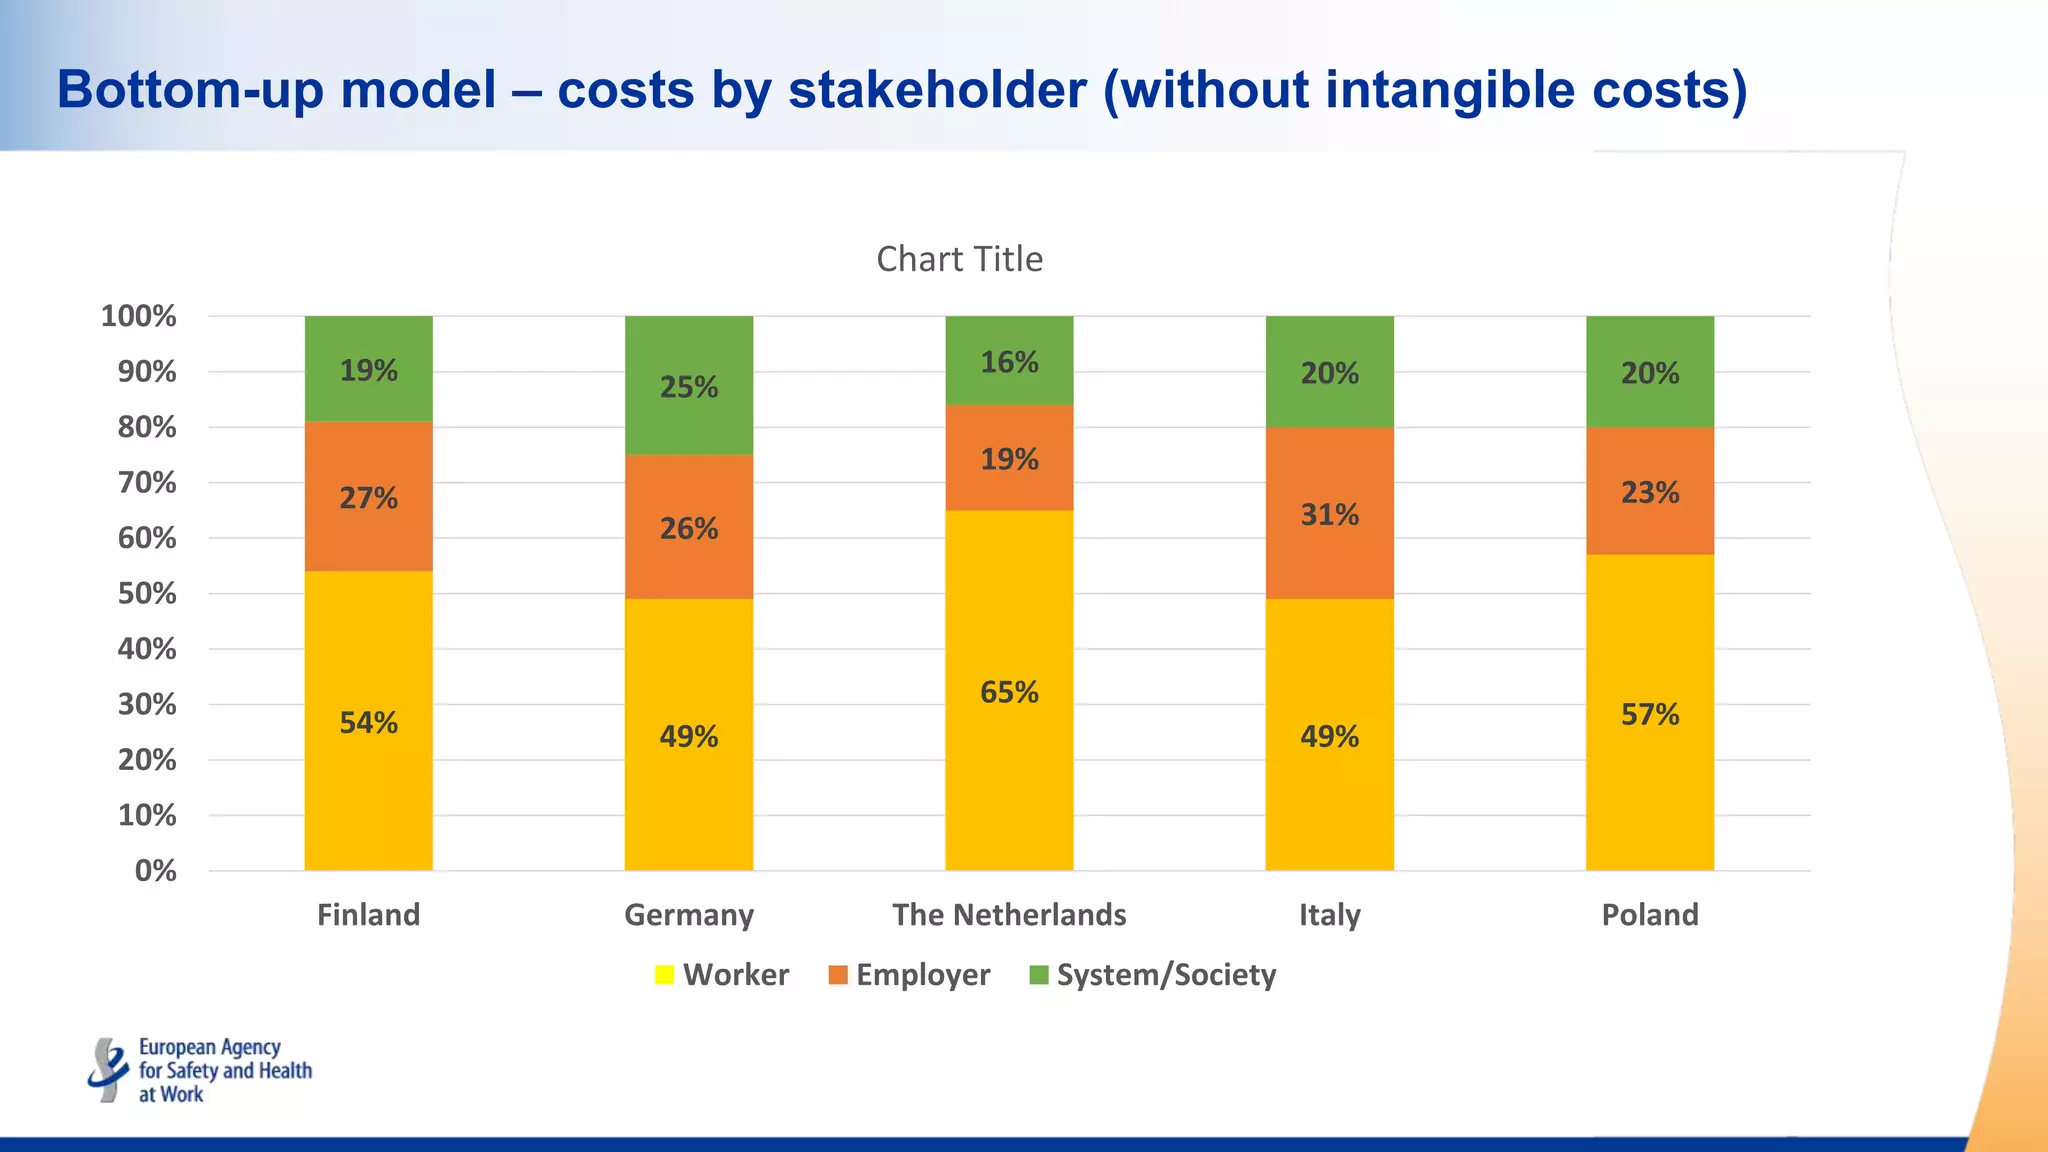
Analyzes costs borne by employers, workers, and society, illustrating percentage contributions in a comparative format.
Comparison of costs by stakeholder categories for each country, emphasizing distribution percentages.
Cost distribution by stakeholders without including intangible costs, displayed graphically.
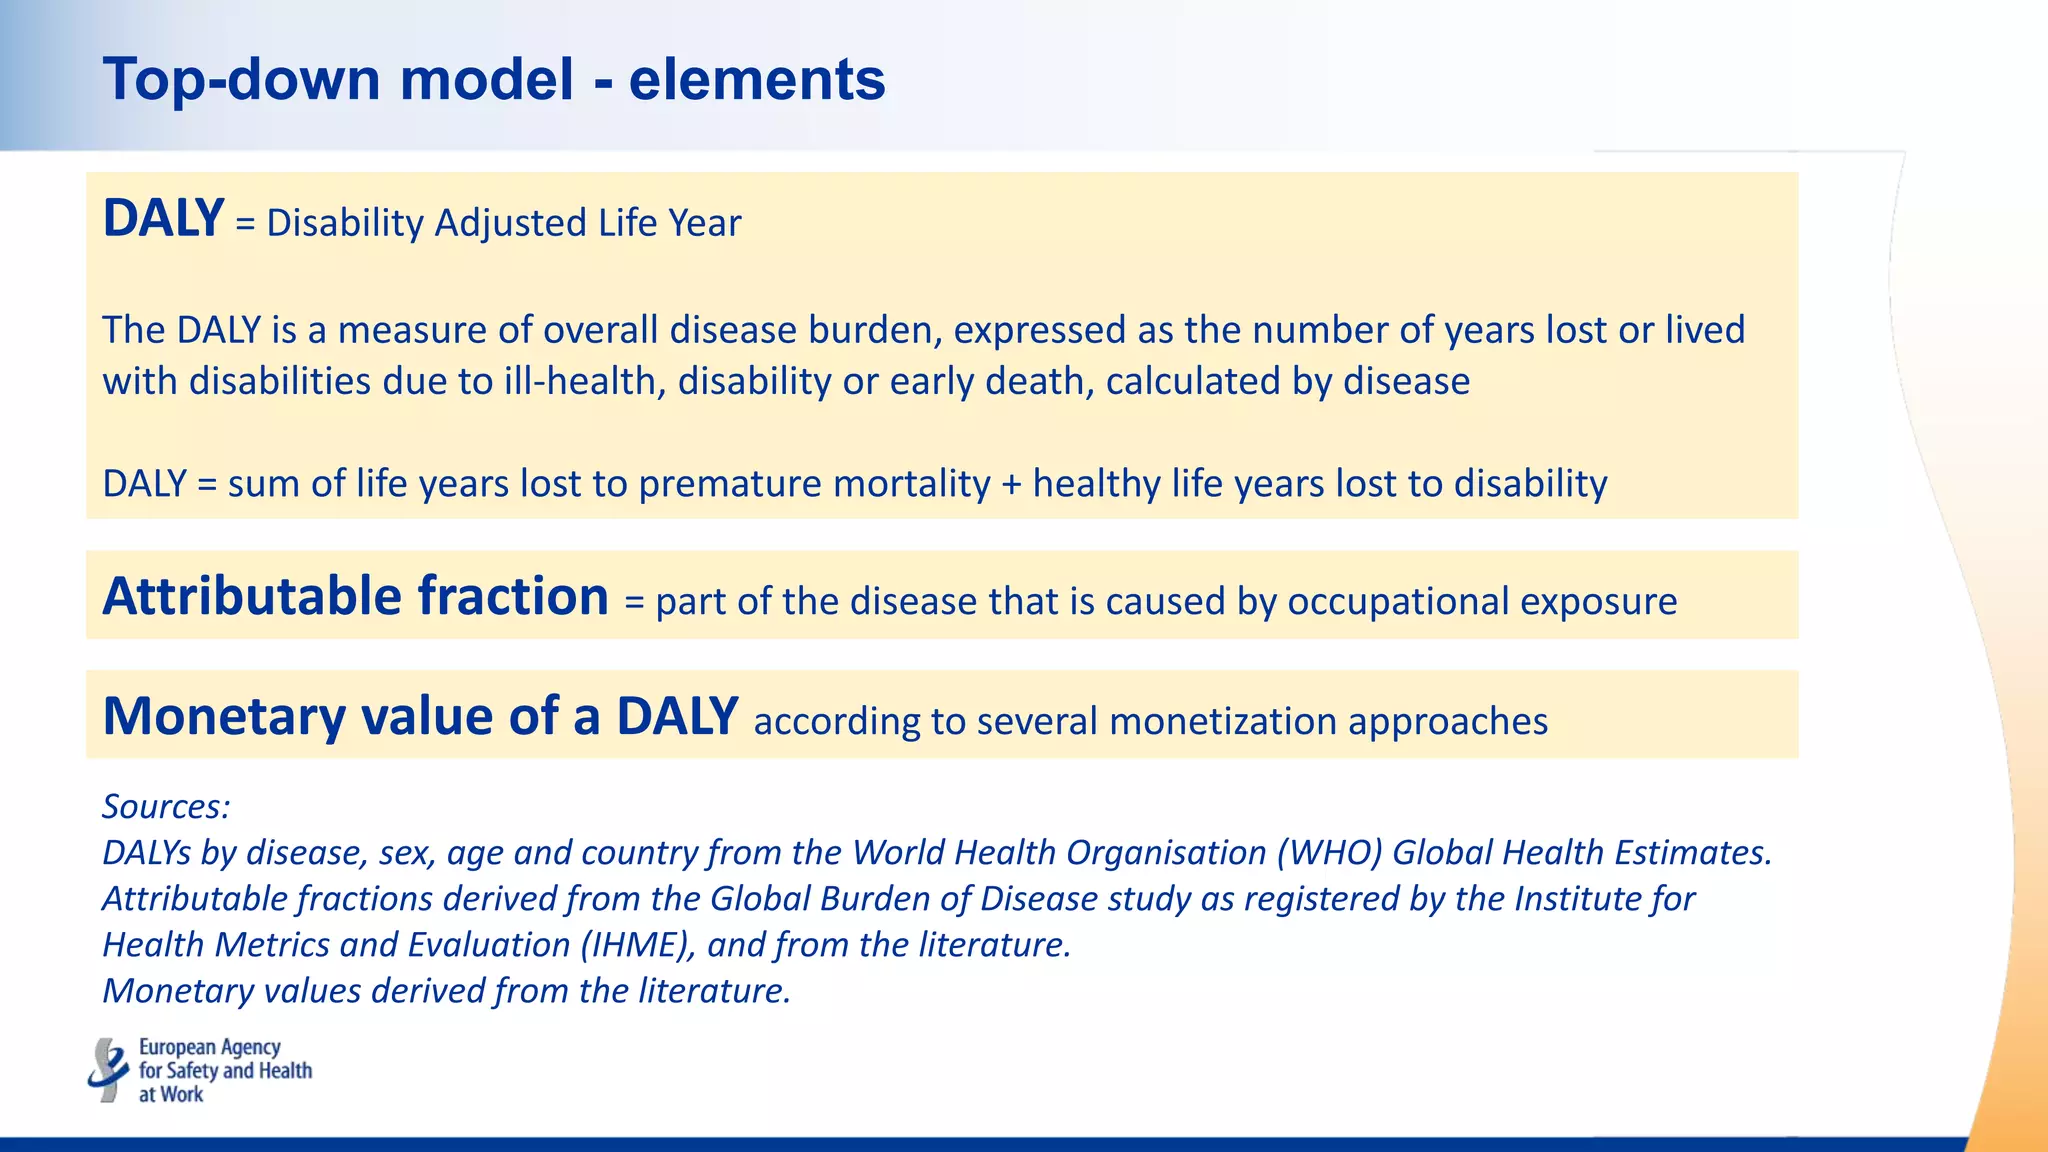
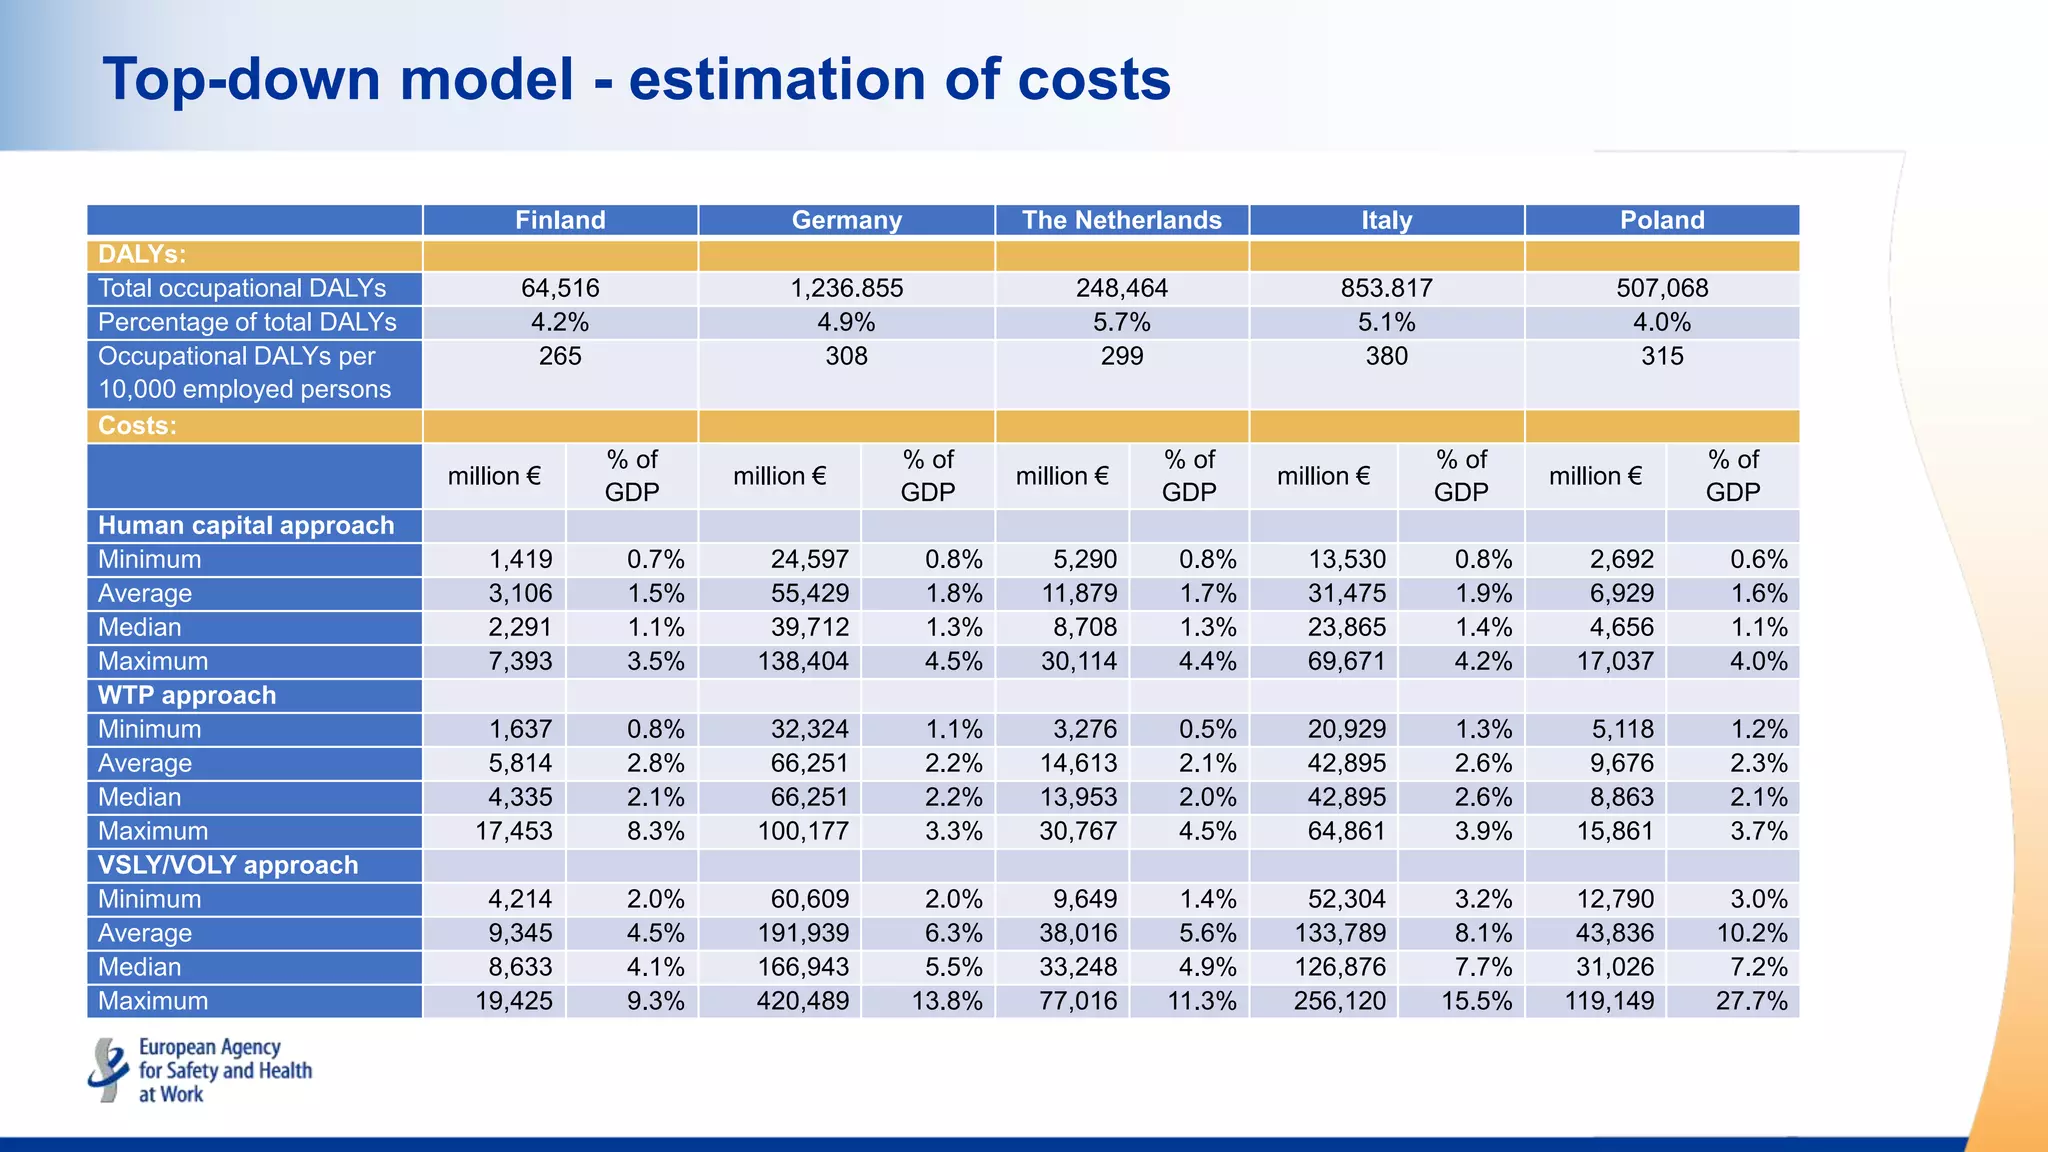
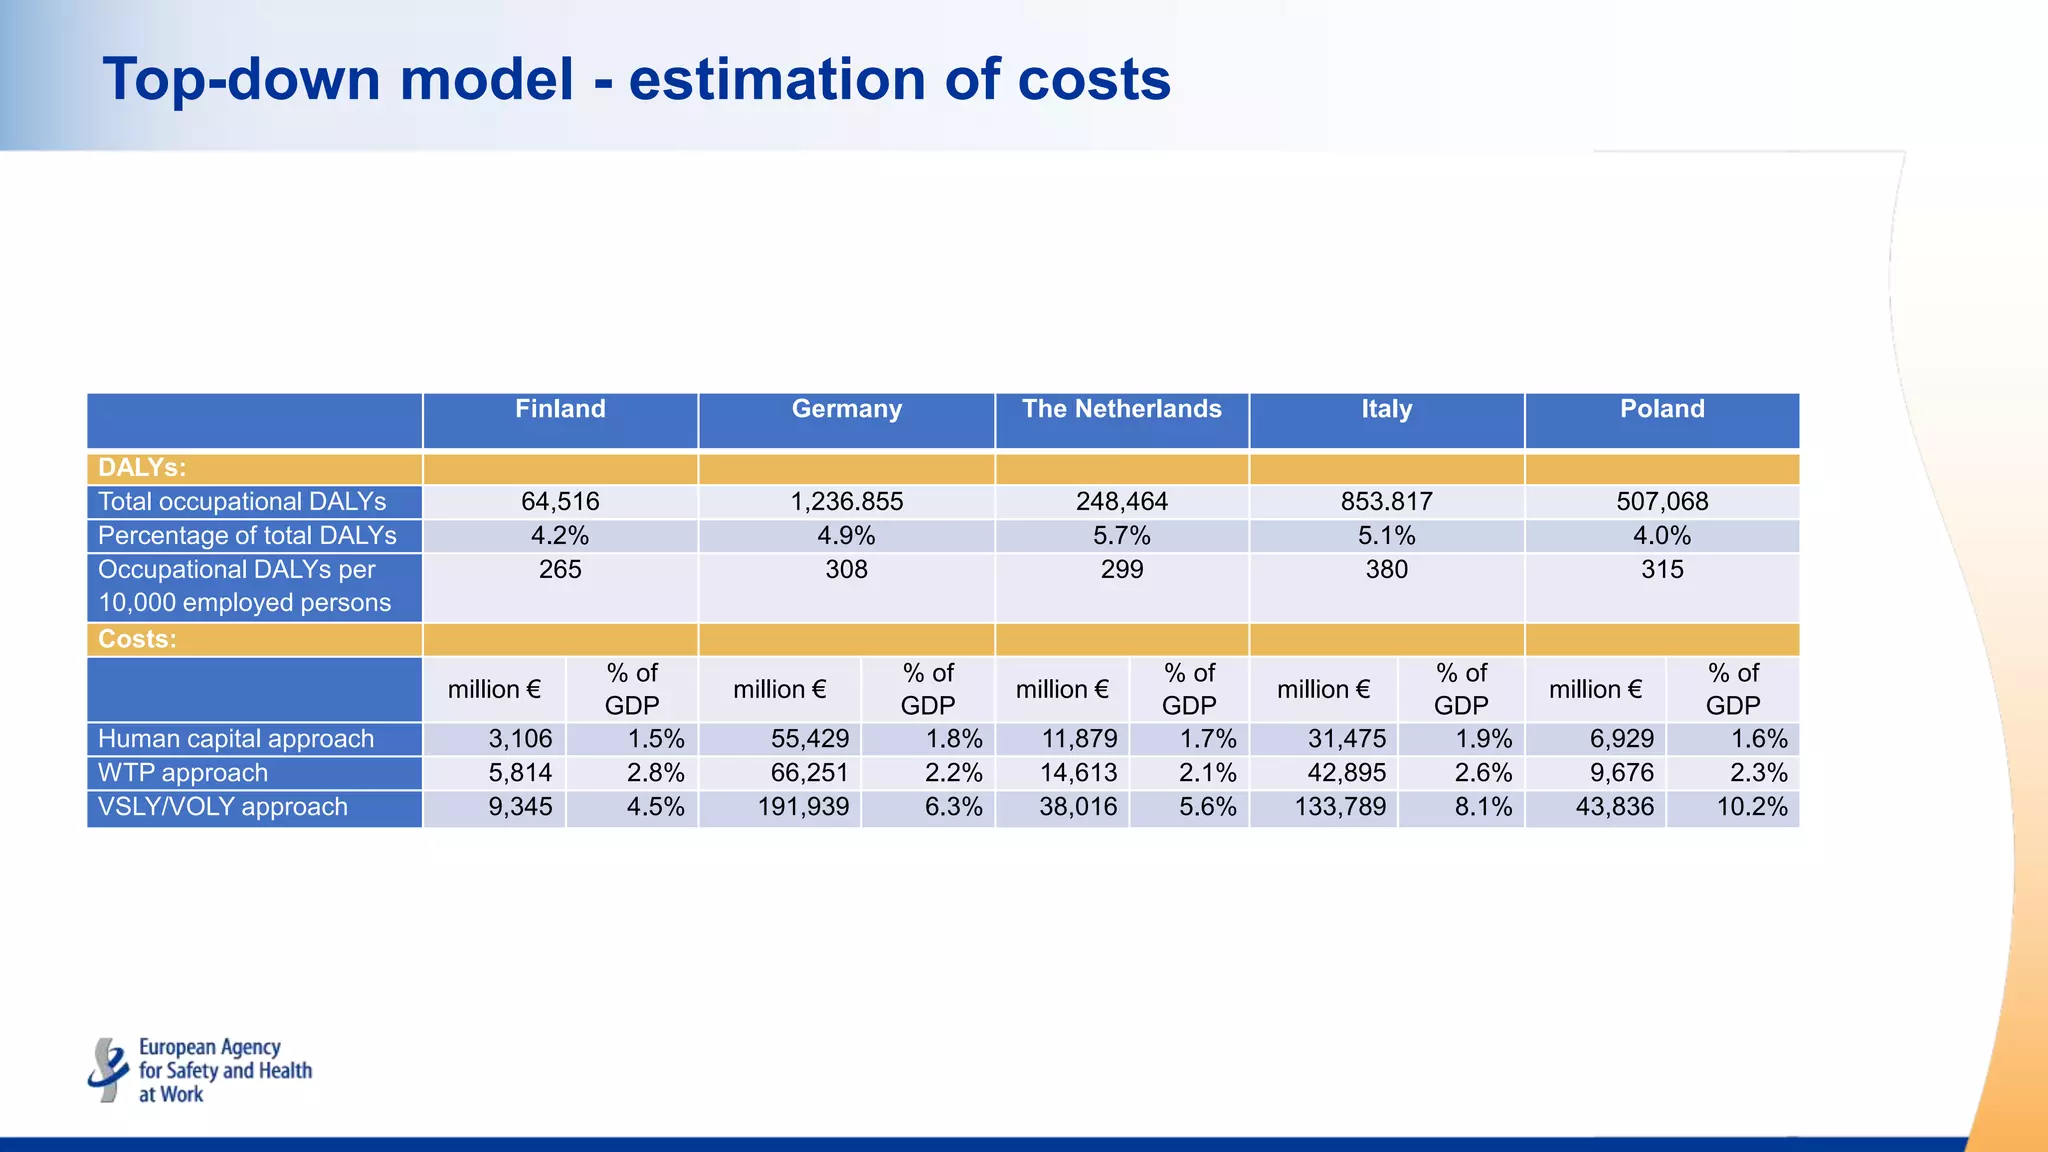
Introduction to the top-down model which assesses economic burden through the lens of DALY.
Explanation of DALY as a disease burden measure, including attribution to occupational exposure.
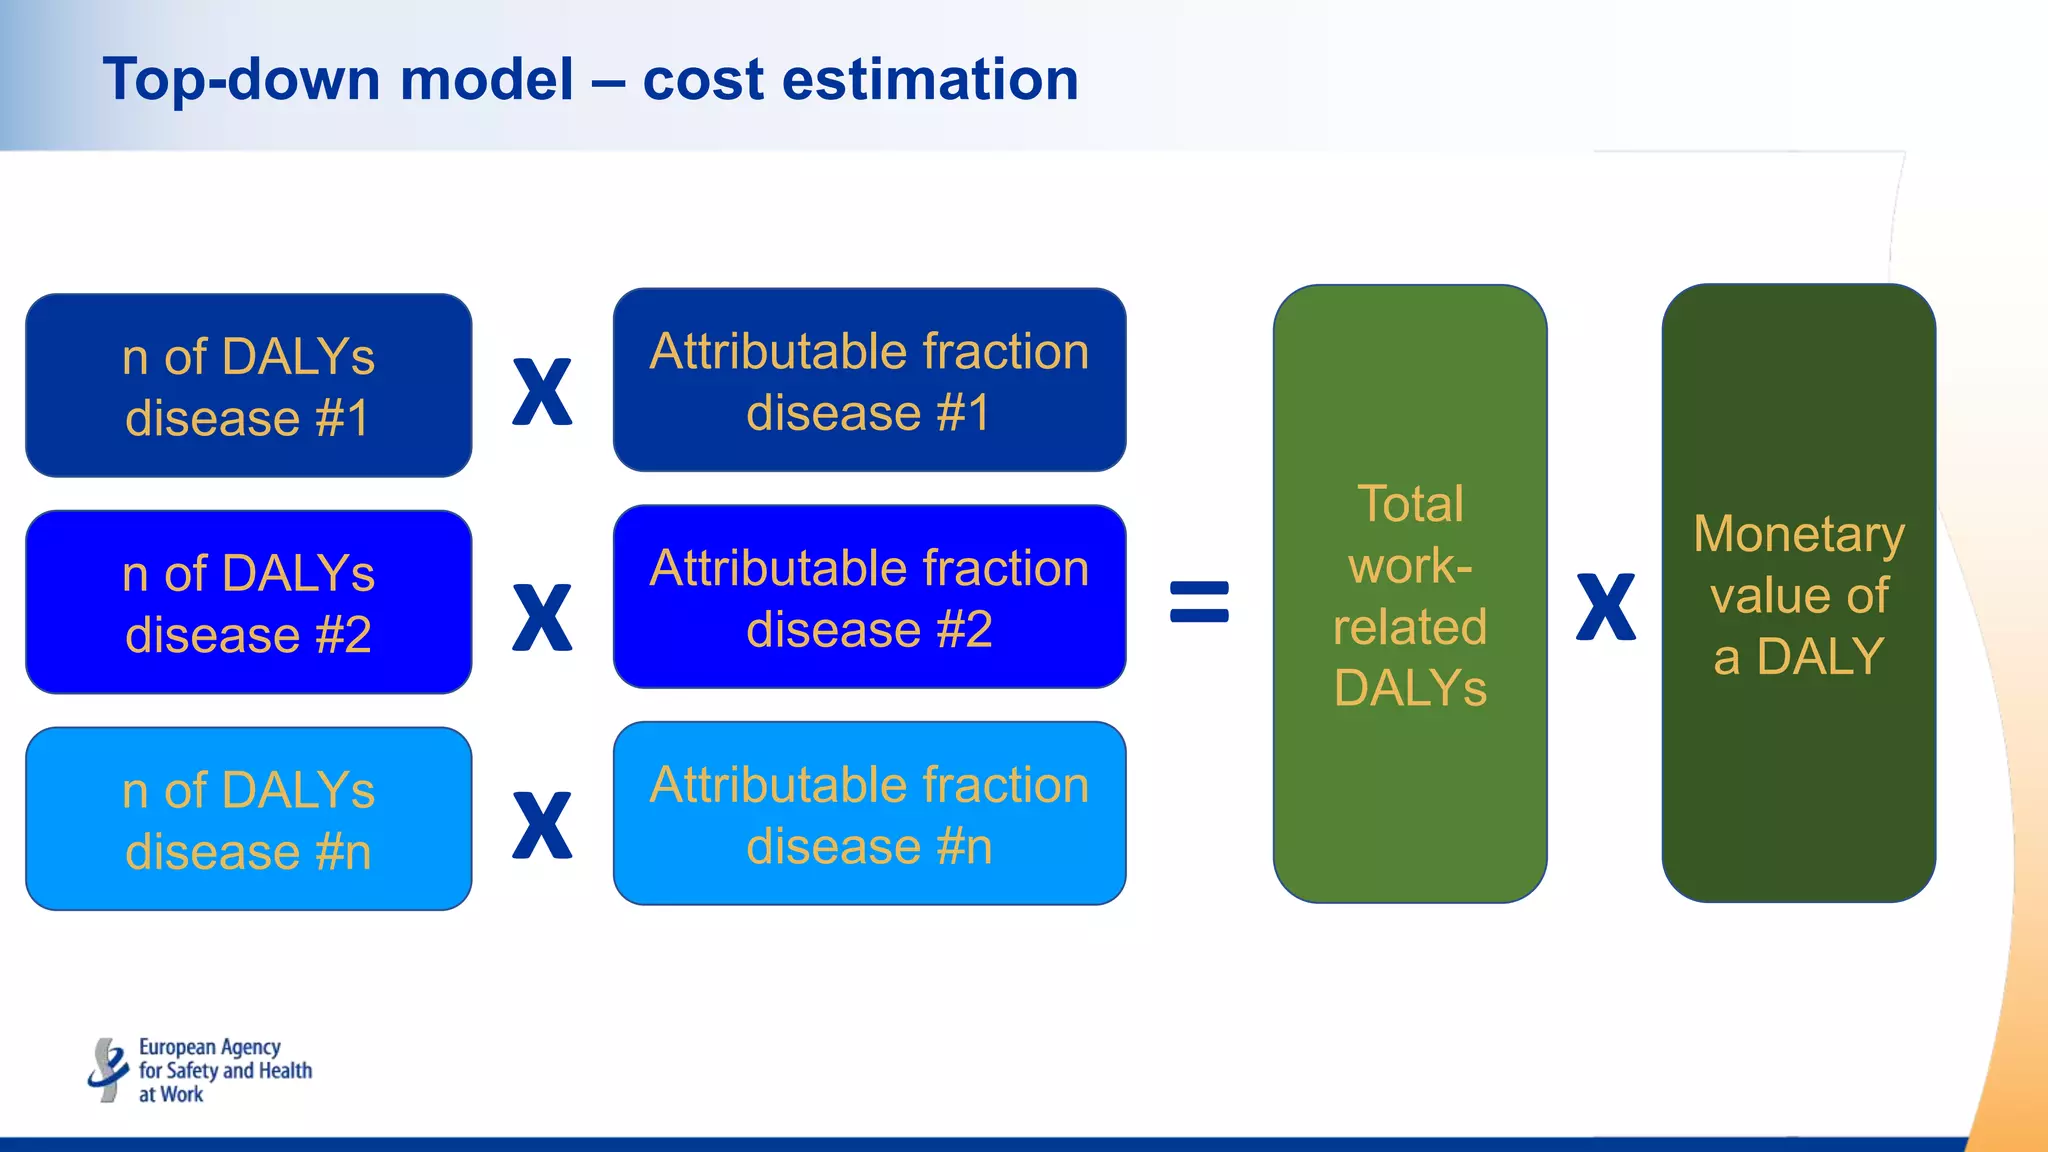
Methodological outline for calculating total work-related DALYs and the monetary value associated.
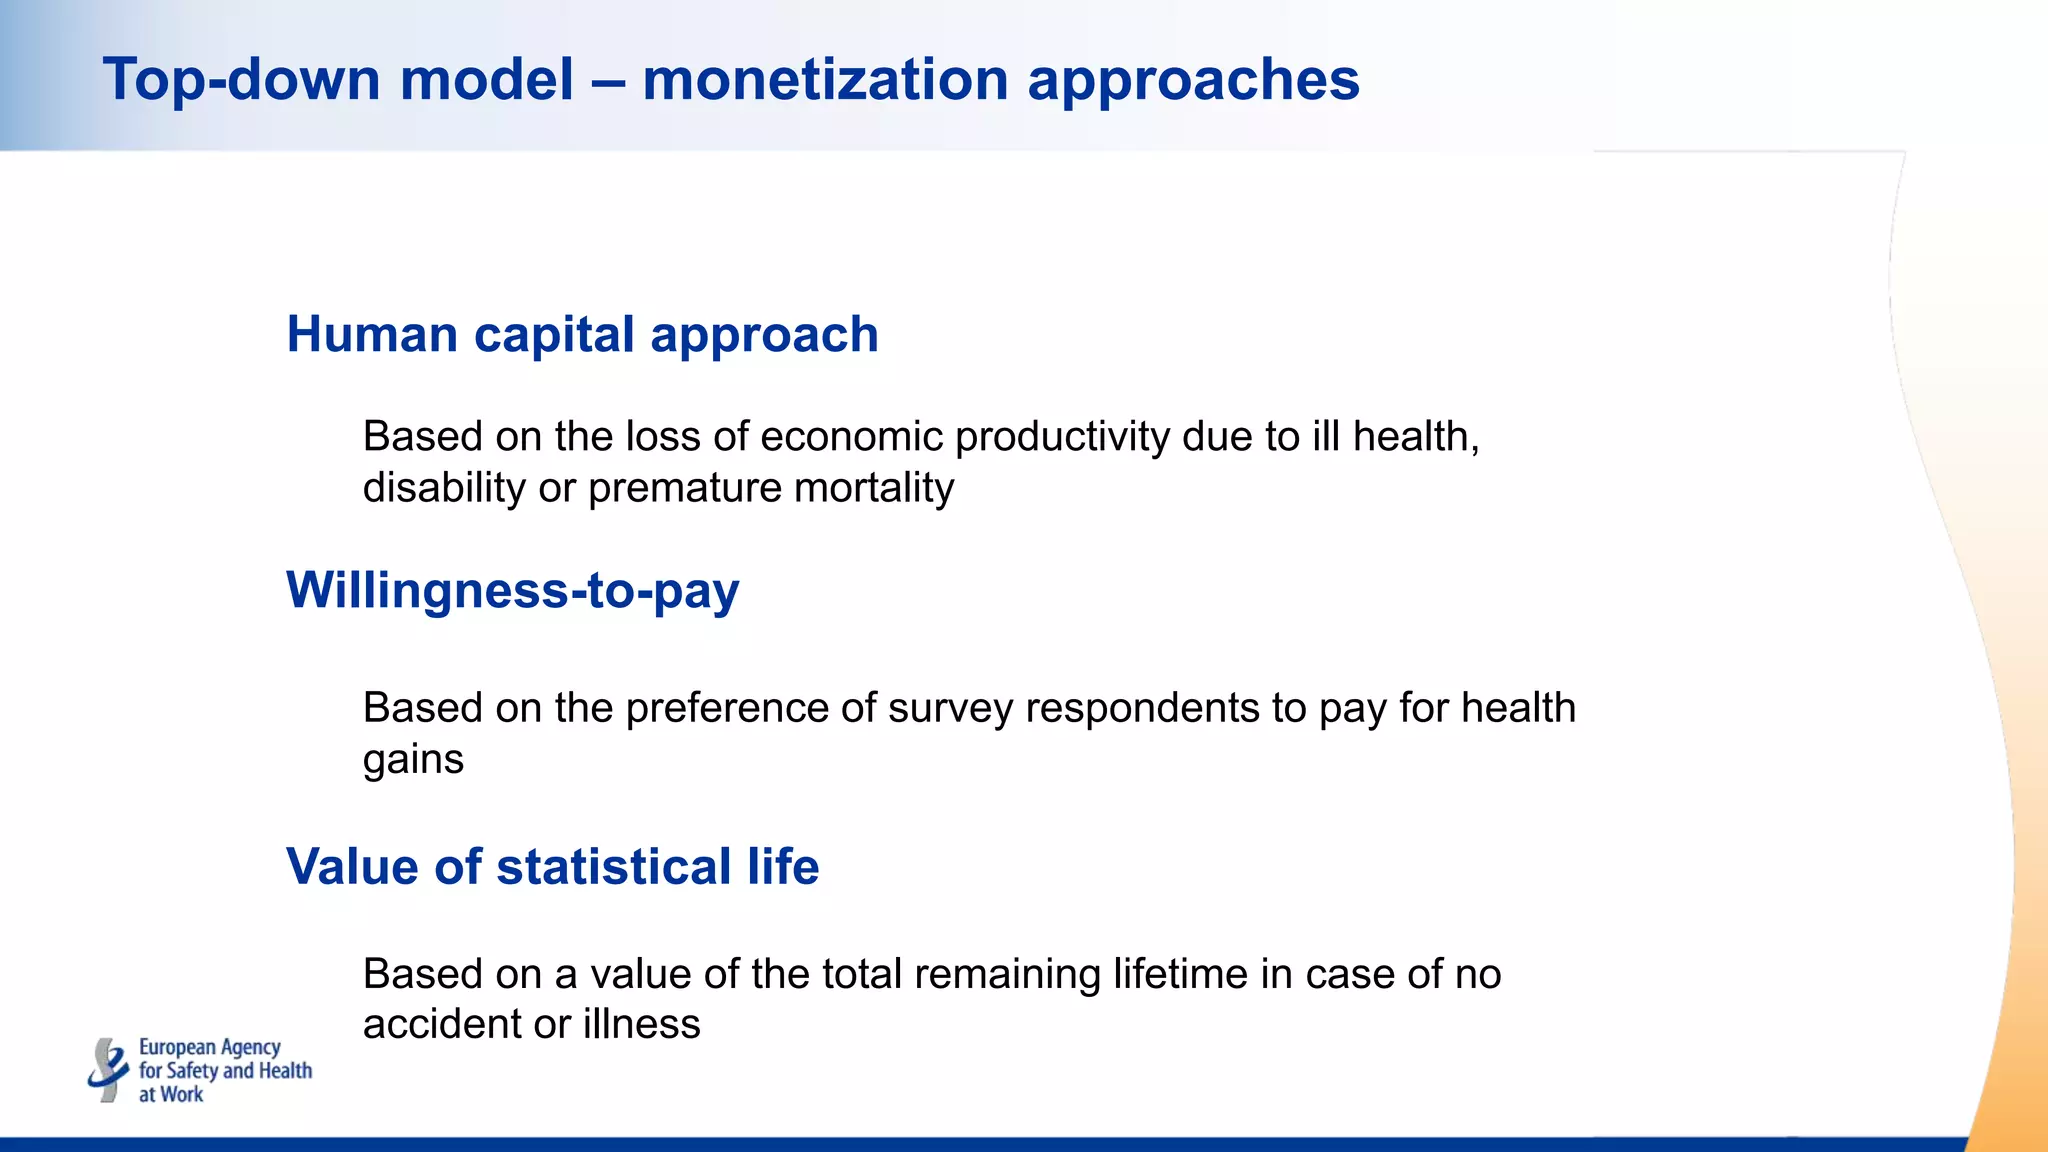
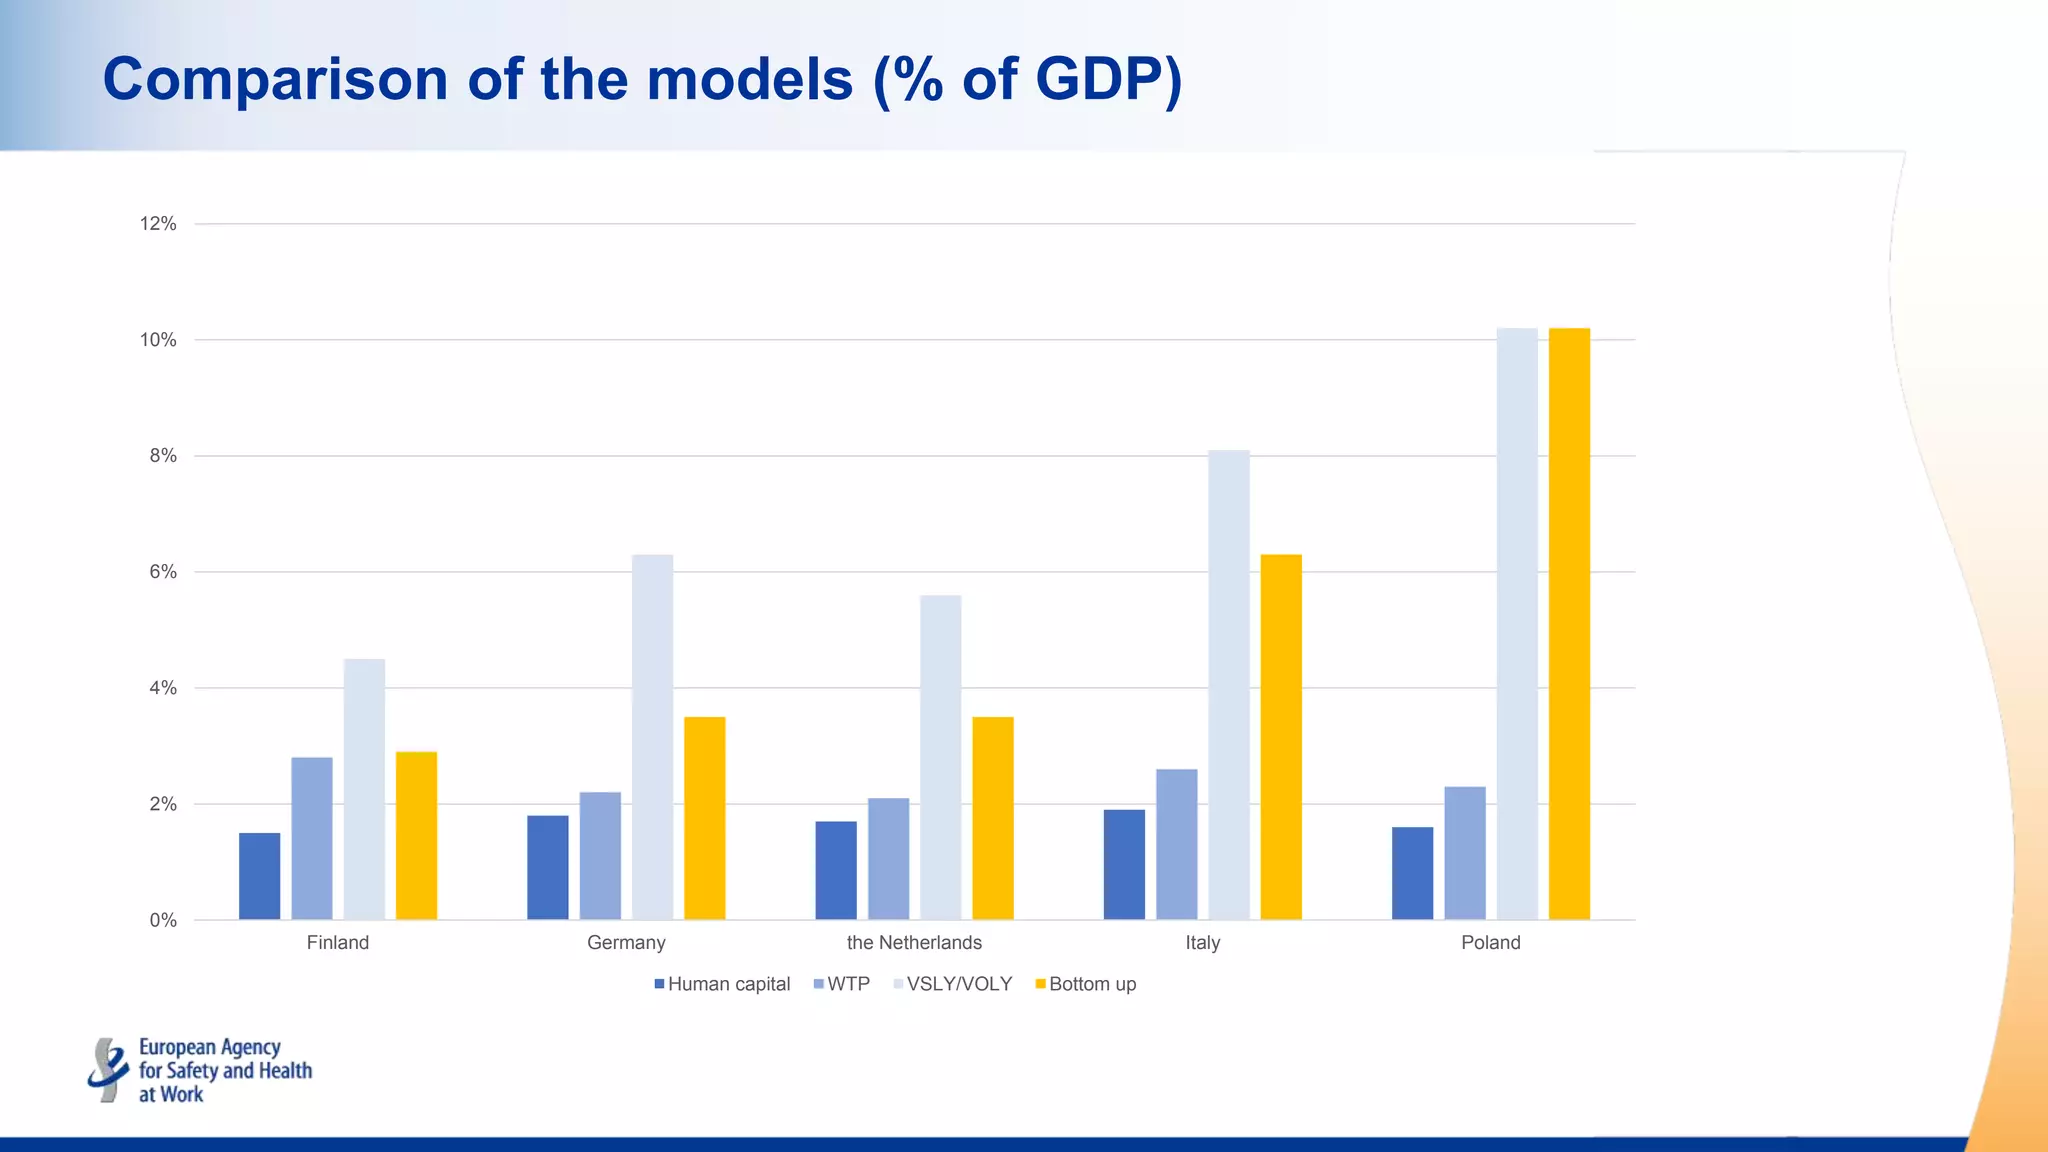
Three approaches for cost estimation: Human capital, willingness-to-pay, and value of statistical life.
Cost estimations in millions € and as a percentage of GDP for countries using various monetization approaches.
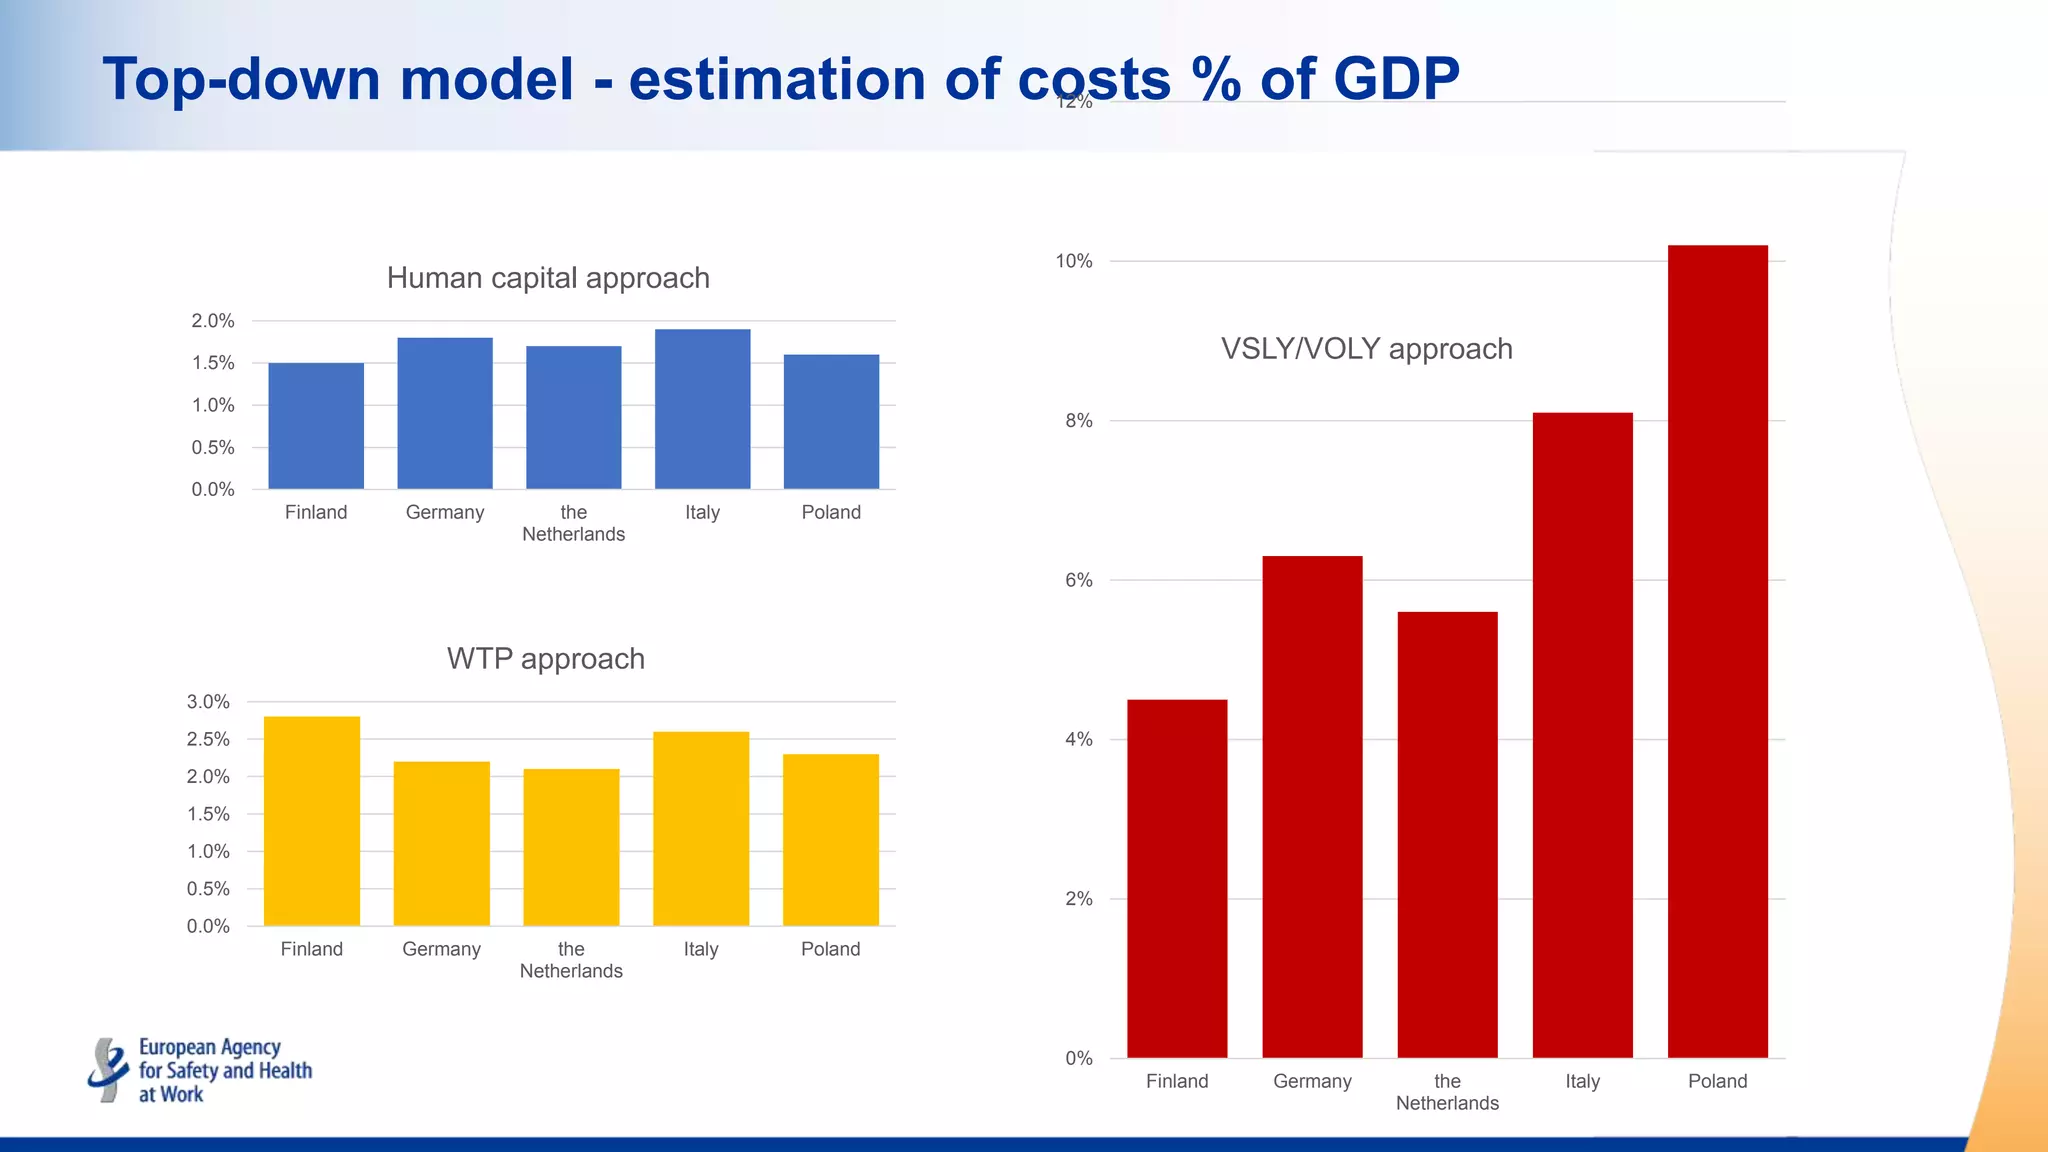
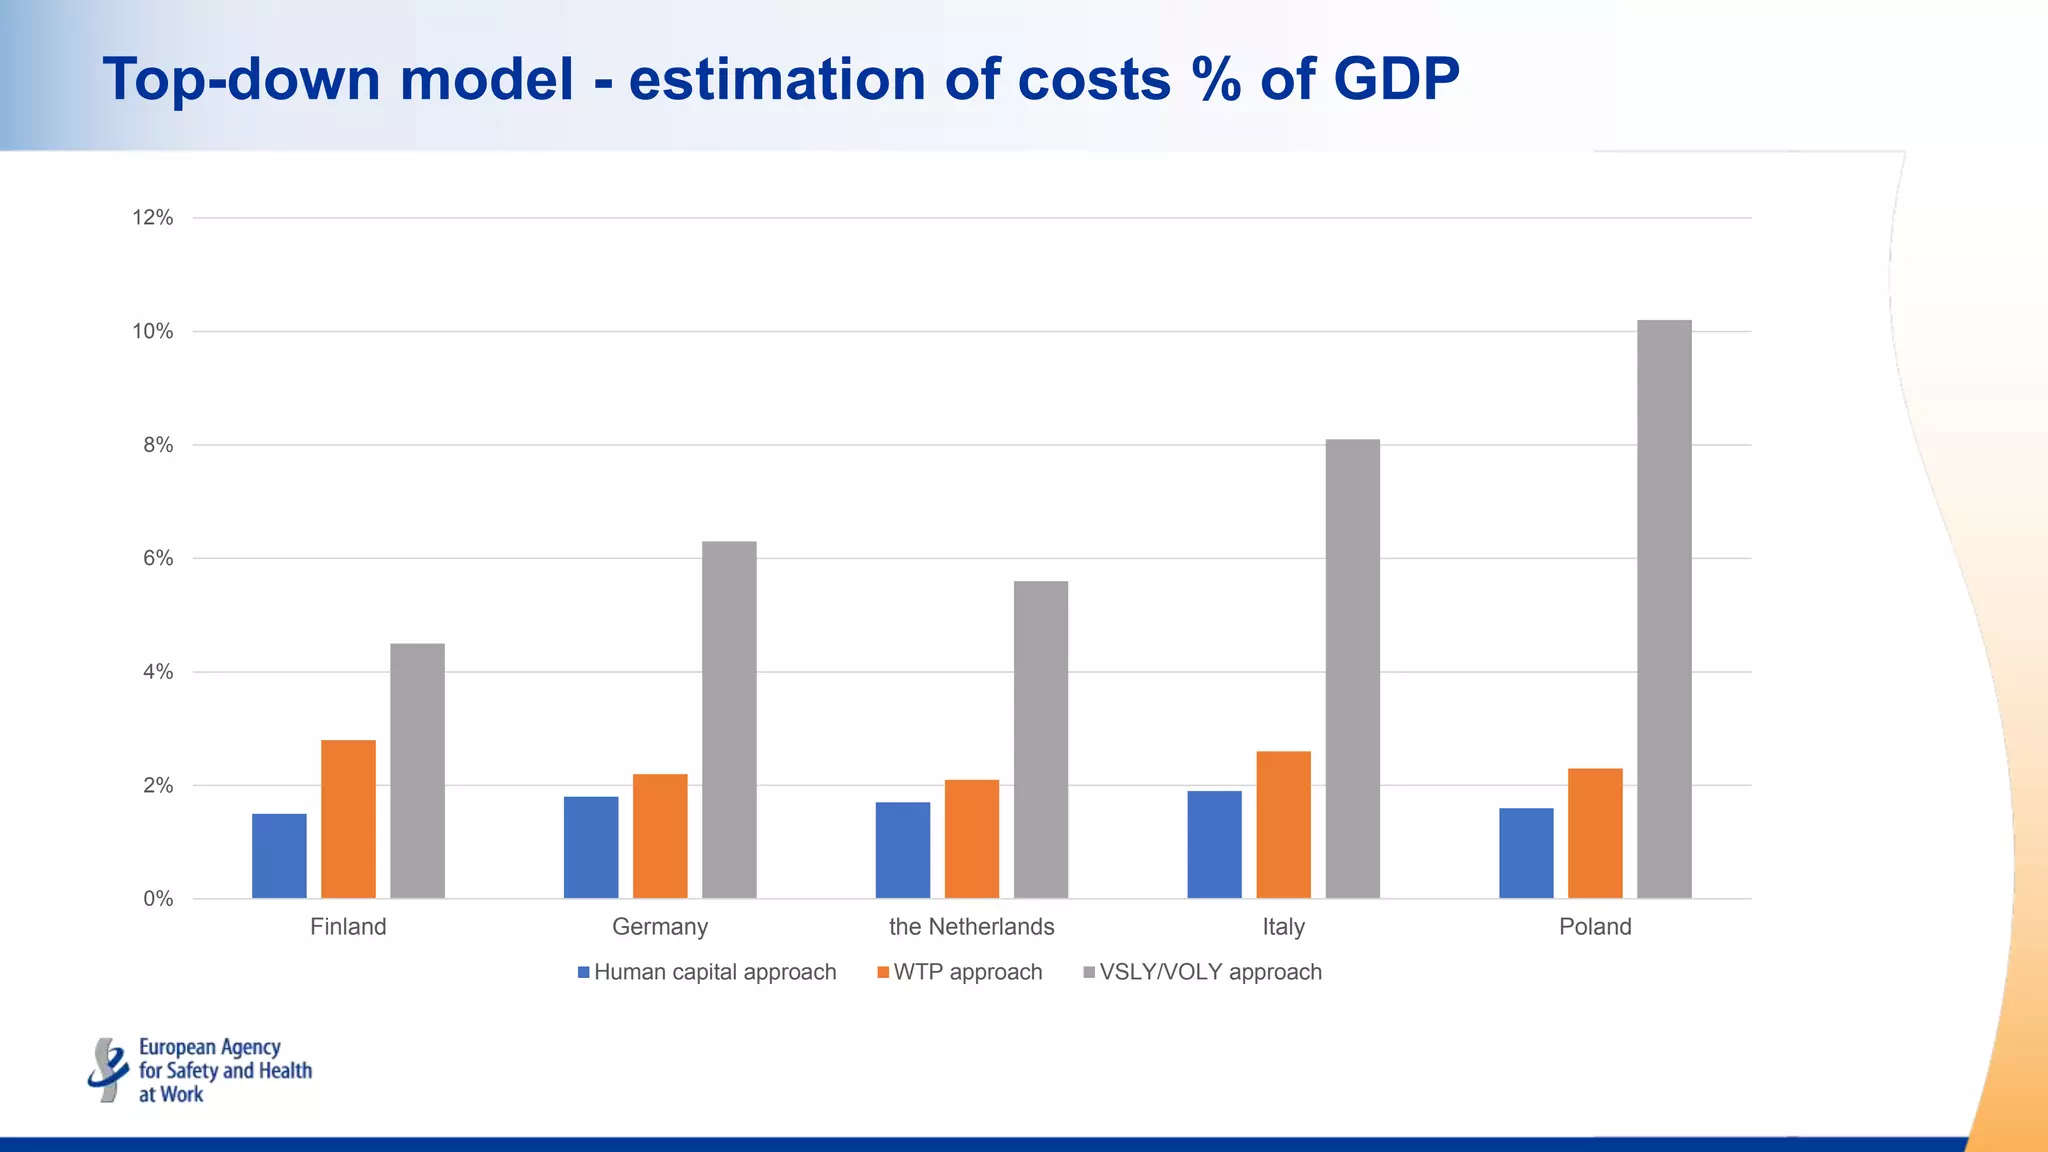
Graphs showing estimations' percentage of GDP for different cost estimation approaches by country.
Summarizes the findings of both models, emphasizing data accuracy and implications for future research.


![[DSC Europe 25] Vid Stimac - Policy Parsimony: Between Oversimplifying and Ov...](https://cdn.slidesharecdn.com/ss_thumbnails/eqlepagzqp2rhg3gbluh-dsc-stimac-251120-251205090438-059e7f54-thumbnail.jpg?width=640&height=640&fit=bounds)
![[DSC Europe 25] Jim Sterne - Adopting Generative AI Capabilities Into the Ent...](https://cdn.slidesharecdn.com/ss_thumbnails/sxhpofuorcagxsaulkmt-3-251204082258-7e66bc48-thumbnail.jpg?width=640&height=640&fit=bounds)


![[DSC Europe 25] Andy Cotgreave - Nothing is new in analytics.pptx](https://cdn.slidesharecdn.com/ss_thumbnails/mba4vzcurvoh5lfrd5zw-6-251205194645-341bbbbe-thumbnail.jpg?width=640&height=640&fit=bounds)


![[DSC Europe 25] Goran Obradovic - The Rise of Sovereign AI: Building the Regi...](https://cdn.slidesharecdn.com/ss_thumbnails/7nw2xxixrxqdxvrb5wca-6-251205085714-ab09a2ac-thumbnail.jpg?width=640&height=640&fit=bounds)


![[DSC Europe 25] Dragana Ilic - AI for Big Data in Astronomy.pptx](https://cdn.slidesharecdn.com/ss_thumbnails/8palya86qaatvjhva1ms-2-dragana-ilic-ai-ilic-251208151906-652b819c-thumbnail.jpg?width=640&height=640&fit=bounds)
![[DSC Europe 25] Boris Perkovic - Lost in performance.pptx](https://cdn.slidesharecdn.com/ss_thumbnails/uq5hrp7vsuahqkxzifux-1-251204082258-fd2ee09d-thumbnail.jpg?width=640&height=640&fit=bounds)
![[DSC Europe 25] Max Talanov - Non digital NNs.pptx](https://cdn.slidesharecdn.com/ss_thumbnails/wif8tr3gtua74qvtopke-non-digital-nns-251205090438-26b0eea6-thumbnail.jpg?width=640&height=640&fit=bounds)
