SlideShare a Scribd company logo
1 of 12
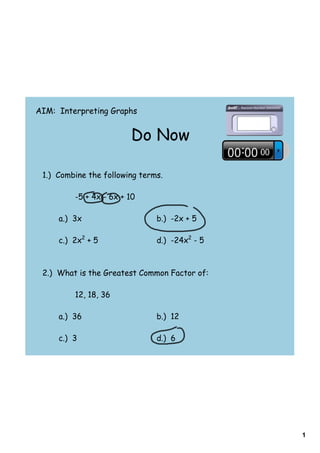
AIM: Interpreting Graphs


                        Do Now

 1.) Combine the following terms.

         -5 + 4x - 6x + 10

     a.) 3x                    b.) -2x + 5

     c.) 2x2 + 5               d.) -24x2 - 5


 2.) What is the Greatest Common Factor of:

         12, 18, 36

     a.) 36                    b.) 12

     c.) 3                     d.) 6


                                               1
Homework: Pages 610-611 #6-15 all, 23, 25, 28, 34


                                                    2
3
Think-Pair-Share Activity:


1.) Jenny takes a trip to the beach. She stays at
the beach all day before driving back home. Which
graph best shows the story? Explain your answer.


                                                    4
2.) Describe the relationship each graph
displays.


        a.) a train


                                           5
2.) Describe the relationship each graph
displays.

    b.) a person riding a bike


                                           6
2.) Describe the relationship each graph
displays.

c.) a ball that is tossed into the air


                                           7
3.) The height of a tree increases over time, but not at a constant
rate. Which graph best shows this? Explain your answer.


                                                                      8
BEFORE YOU LEAVE
Describe a situation that could be represented
by a graph that shows both the x-values and y-
values increasing.


                                                 9
10
Before You Leave Continued
An inventor is testing a new motion detector that graphs the
distance traveled by a person in motion. She walked in front of the
motion detector to create the graph shown. The distance in feet
is that distance the inventor is away from the motion detector.
                             1.) How many feet did the inventor
                             walk during:
                                a.) the first three seconds (0-3 s)?

                                b.) the next three seconds (3-6 s)?

                                c.) the next three seconds (6-9 s)?

                                d.) the final three seconds (9-12 s)?


                             2.) During which interval did she walk
                             fastest and slowest?


3.) Discuss what it means in terms of the inventor‛s speed when
the line is very steep.

4.) Explain what happened between the sixth second and the
ninth second.


                                                                        11
Mr. Tjersland's Math 7


Homework: Pages 614-615 #1, 6, 11, 14, 16, 19-24 all


                                                       12

More Related Content

Similar to Day 7 interpreting graphs

1 theory -_i_imso_08_-_problem_with_answer_final
1 theory -_i_imso_08_-_problem_with_answer_final1 theory -_i_imso_08_-_problem_with_answer_final
1 theory -_i_imso_08_-_problem_with_answer_final
judithtaepodong
 
S1 2005 jan
S1 2005 janS1 2005 jan
S1 2005 jan
panovsky
 
Masters in fashion management NIFT gat Sample paper
Masters in fashion management NIFT gat Sample paperMasters in fashion management NIFT gat Sample paper
Masters in fashion management NIFT gat Sample paper
Academy of Fashion & Design
 
Tcs apti preparation
Tcs apti preparationTcs apti preparation
Tcs apti preparation
Ashu0711
 
Sample touch stone
Sample touch stoneSample touch stone
Sample touch stone
tijeel
 
Tcs 2011with solutions
Tcs 2011with solutionsTcs 2011with solutions
Tcs 2011with solutions
Ashu0711
 
4.1 4.2 Notes A
4.1 4.2 Notes A4.1 4.2 Notes A
4.1 4.2 Notes A
mbetzel
 
4.1 4.2 Notes A
4.1 4.2 Notes A4.1 4.2 Notes A
4.1 4.2 Notes A
mbetzel
 
Final exam review sheet # 3 2015
Final exam review sheet # 3 2015Final exam review sheet # 3 2015
Final exam review sheet # 3 2015
mlabuski
 

Similar to Day 7 interpreting graphs (20)

Testbank
TestbankTestbank
Testbank
 
Graphing Motion
Graphing MotionGraphing Motion
Graphing Motion
 
Class 11hhw
Class 11hhwClass 11hhw
Class 11hhw
 
1 theory -_i_imso_08_-_problem_with_answer_final
1 theory -_i_imso_08_-_problem_with_answer_final1 theory -_i_imso_08_-_problem_with_answer_final
1 theory -_i_imso_08_-_problem_with_answer_final
 
Nift old question paper masters in design gat
Nift old question paper masters in design gatNift old question paper masters in design gat
Nift old question paper masters in design gat
 
S1 2005 jan
S1 2005 janS1 2005 jan
S1 2005 jan
 
Iwb Workshop
Iwb WorkshopIwb Workshop
Iwb Workshop
 
Tests
TestsTests
Tests
 
Masters in fashion management NIFT gat Sample paper
Masters in fashion management NIFT gat Sample paperMasters in fashion management NIFT gat Sample paper
Masters in fashion management NIFT gat Sample paper
 
Tenth class-state syllabus-model paper-em-ap-physical science
Tenth class-state syllabus-model paper-em-ap-physical scienceTenth class-state syllabus-model paper-em-ap-physical science
Tenth class-state syllabus-model paper-em-ap-physical science
 
Tcs apti preparation
Tcs apti preparationTcs apti preparation
Tcs apti preparation
 
Sample touch stone
Sample touch stoneSample touch stone
Sample touch stone
 
Tcs 2011with solutions
Tcs 2011with solutionsTcs 2011with solutions
Tcs 2011with solutions
 
Testbank
TestbankTestbank
Testbank
 
Módulo de reforzamiento fuentes 2021(2)
Módulo de reforzamiento fuentes   2021(2)Módulo de reforzamiento fuentes   2021(2)
Módulo de reforzamiento fuentes 2021(2)
 
4.1 4.2 Notes A
4.1 4.2 Notes A4.1 4.2 Notes A
4.1 4.2 Notes A
 
4.1 4.2 Notes A
4.1 4.2 Notes A4.1 4.2 Notes A
4.1 4.2 Notes A
 
11th Physics, Chemistry, Mathematics paper for school's final Exam 2015
11th Physics, Chemistry, Mathematics paper for school's final Exam 201511th Physics, Chemistry, Mathematics paper for school's final Exam 2015
11th Physics, Chemistry, Mathematics paper for school's final Exam 2015
 
Final exam review sheet # 3 2015
Final exam review sheet # 3 2015Final exam review sheet # 3 2015
Final exam review sheet # 3 2015
 
Algebreviewer
AlgebreviewerAlgebreviewer
Algebreviewer
 

More from Erik Tjersland

Linear equations lesson 8 day 2 graphing linear equations
Linear equations lesson 8 day 2 graphing linear equationsLinear equations lesson 8 day 2 graphing linear equations
Linear equations lesson 8 day 2 graphing linear equations
Erik Tjersland
 
Linear equations lesson 8 day 1 graphing linear equations
Linear equations lesson 8 day 1 graphing linear equationsLinear equations lesson 8 day 1 graphing linear equations
Linear equations lesson 8 day 1 graphing linear equations
Erik Tjersland
 
Linear equations lesson 7 slope formula
Linear equations lesson 7 slope formulaLinear equations lesson 7 slope formula
Linear equations lesson 7 slope formula
Erik Tjersland
 
Module 4.5 lesson 9 computing actual lengths
Module 4.5 lesson 9 computing actual lengthsModule 4.5 lesson 9 computing actual lengths
Module 4.5 lesson 9 computing actual lengths
Erik Tjersland
 
Module 4.5 lesson 7 scale factor as a percent
Module 4.5 lesson 7 scale factor as a percentModule 4.5 lesson 7 scale factor as a percent
Module 4.5 lesson 7 scale factor as a percent
Erik Tjersland
 
Linear equations lesson 5 horizontal and vertical lines
Linear equations lesson 5 horizontal and vertical linesLinear equations lesson 5 horizontal and vertical lines
Linear equations lesson 5 horizontal and vertical lines
Erik Tjersland
 
Module 4.5 lesson 4 scale area problems
Module 4.5 lesson 4 scale area problemsModule 4.5 lesson 4 scale area problems
Module 4.5 lesson 4 scale area problems
Erik Tjersland
 
Module 4.5 lesson 3 computing actual lengths from scale drawings
Module 4.5 lesson 3 computing actual lengths from scale drawingsModule 4.5 lesson 3 computing actual lengths from scale drawings
Module 4.5 lesson 3 computing actual lengths from scale drawings
Erik Tjersland
 
Module 4.5 lesson 2 unit rate as the scale factor
Module 4.5 lesson 2 unit rate as the scale factorModule 4.5 lesson 2 unit rate as the scale factor
Module 4.5 lesson 2 unit rate as the scale factor
Erik Tjersland
 
Linear equations lesson 4 graphing linear equations
Linear equations lesson 4 graphing linear equationsLinear equations lesson 4 graphing linear equations
Linear equations lesson 4 graphing linear equations
Erik Tjersland
 
Module 4.5 lesson 1 scale drawings
Module 4.5 lesson 1 scale drawingsModule 4.5 lesson 1 scale drawings
Module 4.5 lesson 1 scale drawings
Erik Tjersland
 
Linear equations lesson 3 consecutive integers
Linear equations lesson 3 consecutive integersLinear equations lesson 3 consecutive integers
Linear equations lesson 3 consecutive integers
Erik Tjersland
 
14 mixed review with percents with answers
14   mixed review with percents with answers14   mixed review with percents with answers
14 mixed review with percents with answers
Erik Tjersland
 
Module 4 lesson 12 relative error
Module 4 lesson 12 relative errorModule 4 lesson 12 relative error
Module 4 lesson 12 relative error
Erik Tjersland
 
Linear equations lesson 2 geometric word problems
Linear equations lesson 2 geometric word problemsLinear equations lesson 2 geometric word problems
Linear equations lesson 2 geometric word problems
Erik Tjersland
 

More from Erik Tjersland (20)

Linear equations lesson 8 day 2 graphing linear equations
Linear equations lesson 8 day 2 graphing linear equationsLinear equations lesson 8 day 2 graphing linear equations
Linear equations lesson 8 day 2 graphing linear equations
 
Linear equations lesson 8 day 1 graphing linear equations
Linear equations lesson 8 day 1 graphing linear equationsLinear equations lesson 8 day 1 graphing linear equations
Linear equations lesson 8 day 1 graphing linear equations
 
Linear equations lesson 7 slope formula
Linear equations lesson 7 slope formulaLinear equations lesson 7 slope formula
Linear equations lesson 7 slope formula
 
Module 4.5 lesson 10 scale area
Module 4.5 lesson 10 scale areaModule 4.5 lesson 10 scale area
Module 4.5 lesson 10 scale area
 
Module 4.5 lesson 9 computing actual lengths
Module 4.5 lesson 9 computing actual lengthsModule 4.5 lesson 9 computing actual lengths
Module 4.5 lesson 9 computing actual lengths
 
Linear equations lesson 6 slope
Linear equations lesson 6 slopeLinear equations lesson 6 slope
Linear equations lesson 6 slope
 
Module 4.5 lesson 7 scale factor as a percent
Module 4.5 lesson 7 scale factor as a percentModule 4.5 lesson 7 scale factor as a percent
Module 4.5 lesson 7 scale factor as a percent
 
Module 4.5 lesson 6 scale map
Module 4.5 lesson 6 scale mapModule 4.5 lesson 6 scale map
Module 4.5 lesson 6 scale map
 
Linear equations lesson 5 horizontal and vertical lines
Linear equations lesson 5 horizontal and vertical linesLinear equations lesson 5 horizontal and vertical lines
Linear equations lesson 5 horizontal and vertical lines
 
Module 4.5 lesson 4 scale area problems
Module 4.5 lesson 4 scale area problemsModule 4.5 lesson 4 scale area problems
Module 4.5 lesson 4 scale area problems
 
Module 4.5 lesson 3 computing actual lengths from scale drawings
Module 4.5 lesson 3 computing actual lengths from scale drawingsModule 4.5 lesson 3 computing actual lengths from scale drawings
Module 4.5 lesson 3 computing actual lengths from scale drawings
 
Module 4.5 lesson 2 unit rate as the scale factor
Module 4.5 lesson 2 unit rate as the scale factorModule 4.5 lesson 2 unit rate as the scale factor
Module 4.5 lesson 2 unit rate as the scale factor
 
Linear equations lesson 4 graphing linear equations
Linear equations lesson 4 graphing linear equationsLinear equations lesson 4 graphing linear equations
Linear equations lesson 4 graphing linear equations
 
Module 4.5 lesson 1 scale drawings
Module 4.5 lesson 1 scale drawingsModule 4.5 lesson 1 scale drawings
Module 4.5 lesson 1 scale drawings
 
Review for module 4 exam
Review for module 4 examReview for module 4 exam
Review for module 4 exam
 
Linear equations lesson 3 consecutive integers
Linear equations lesson 3 consecutive integersLinear equations lesson 3 consecutive integers
Linear equations lesson 3 consecutive integers
 
14 mixed review with percents with answers
14   mixed review with percents with answers14   mixed review with percents with answers
14 mixed review with percents with answers
 
Module 4 lesson 13
Module 4 lesson 13Module 4 lesson 13
Module 4 lesson 13
 
Module 4 lesson 12 relative error
Module 4 lesson 12 relative errorModule 4 lesson 12 relative error
Module 4 lesson 12 relative error
 
Linear equations lesson 2 geometric word problems
Linear equations lesson 2 geometric word problemsLinear equations lesson 2 geometric word problems
Linear equations lesson 2 geometric word problems
 

Recently uploaded

Jual Obat Aborsi Hongkong ( Asli No.1 ) 085657271886 Obat Penggugur Kandungan...
Jual Obat Aborsi Hongkong ( Asli No.1 ) 085657271886 Obat Penggugur Kandungan...Jual Obat Aborsi Hongkong ( Asli No.1 ) 085657271886 Obat Penggugur Kandungan...
Jual Obat Aborsi Hongkong ( Asli No.1 ) 085657271886 Obat Penggugur Kandungan...
ZurliaSoop
 

Recently uploaded (20)

2024-NATIONAL-LEARNING-CAMP-AND-OTHER.pptx
2024-NATIONAL-LEARNING-CAMP-AND-OTHER.pptx2024-NATIONAL-LEARNING-CAMP-AND-OTHER.pptx
2024-NATIONAL-LEARNING-CAMP-AND-OTHER.pptx
 
How to setup Pycharm environment for Odoo 17.pptx
How to setup Pycharm environment for Odoo 17.pptxHow to setup Pycharm environment for Odoo 17.pptx
How to setup Pycharm environment for Odoo 17.pptx
 
REMIFENTANIL: An Ultra short acting opioid.pptx
REMIFENTANIL: An Ultra short acting opioid.pptxREMIFENTANIL: An Ultra short acting opioid.pptx
REMIFENTANIL: An Ultra short acting opioid.pptx
 
Graduate Outcomes Presentation Slides - English
Graduate Outcomes Presentation Slides - EnglishGraduate Outcomes Presentation Slides - English
Graduate Outcomes Presentation Slides - English
 
How to Create and Manage Wizard in Odoo 17
How to Create and Manage Wizard in Odoo 17How to Create and Manage Wizard in Odoo 17
How to Create and Manage Wizard in Odoo 17
 
This PowerPoint helps students to consider the concept of infinity.
This PowerPoint helps students to consider the concept of infinity.This PowerPoint helps students to consider the concept of infinity.
This PowerPoint helps students to consider the concept of infinity.
 
Kodo Millet PPT made by Ghanshyam bairwa college of Agriculture kumher bhara...
Kodo Millet  PPT made by Ghanshyam bairwa college of Agriculture kumher bhara...Kodo Millet  PPT made by Ghanshyam bairwa college of Agriculture kumher bhara...
Kodo Millet PPT made by Ghanshyam bairwa college of Agriculture kumher bhara...
 
On_Translating_a_Tamil_Poem_by_A_K_Ramanujan.pptx
On_Translating_a_Tamil_Poem_by_A_K_Ramanujan.pptxOn_Translating_a_Tamil_Poem_by_A_K_Ramanujan.pptx
On_Translating_a_Tamil_Poem_by_A_K_Ramanujan.pptx
 
Jual Obat Aborsi Hongkong ( Asli No.1 ) 085657271886 Obat Penggugur Kandungan...
Jual Obat Aborsi Hongkong ( Asli No.1 ) 085657271886 Obat Penggugur Kandungan...Jual Obat Aborsi Hongkong ( Asli No.1 ) 085657271886 Obat Penggugur Kandungan...
Jual Obat Aborsi Hongkong ( Asli No.1 ) 085657271886 Obat Penggugur Kandungan...
 
80 ĐỀ THI THỬ TUYỂN SINH TIẾNG ANH VÀO 10 SỞ GD – ĐT THÀNH PHỐ HỒ CHÍ MINH NĂ...
80 ĐỀ THI THỬ TUYỂN SINH TIẾNG ANH VÀO 10 SỞ GD – ĐT THÀNH PHỐ HỒ CHÍ MINH NĂ...80 ĐỀ THI THỬ TUYỂN SINH TIẾNG ANH VÀO 10 SỞ GD – ĐT THÀNH PHỐ HỒ CHÍ MINH NĂ...
80 ĐỀ THI THỬ TUYỂN SINH TIẾNG ANH VÀO 10 SỞ GD – ĐT THÀNH PHỐ HỒ CHÍ MINH NĂ...
 
Understanding Accommodations and Modifications
Understanding  Accommodations and ModificationsUnderstanding  Accommodations and Modifications
Understanding Accommodations and Modifications
 
Accessible Digital Futures project (20/03/2024)
Accessible Digital Futures project (20/03/2024)Accessible Digital Futures project (20/03/2024)
Accessible Digital Futures project (20/03/2024)
 
How to Manage Global Discount in Odoo 17 POS
How to Manage Global Discount in Odoo 17 POSHow to Manage Global Discount in Odoo 17 POS
How to Manage Global Discount in Odoo 17 POS
 
Beyond_Borders_Understanding_Anime_and_Manga_Fandom_A_Comprehensive_Audience_...
Beyond_Borders_Understanding_Anime_and_Manga_Fandom_A_Comprehensive_Audience_...Beyond_Borders_Understanding_Anime_and_Manga_Fandom_A_Comprehensive_Audience_...
Beyond_Borders_Understanding_Anime_and_Manga_Fandom_A_Comprehensive_Audience_...
 
Application orientated numerical on hev.ppt
Application orientated numerical on hev.pptApplication orientated numerical on hev.ppt
Application orientated numerical on hev.ppt
 
Google Gemini An AI Revolution in Education.pptx
Google Gemini An AI Revolution in Education.pptxGoogle Gemini An AI Revolution in Education.pptx
Google Gemini An AI Revolution in Education.pptx
 
SOC 101 Demonstration of Learning Presentation
SOC 101 Demonstration of Learning PresentationSOC 101 Demonstration of Learning Presentation
SOC 101 Demonstration of Learning Presentation
 
Holdier Curriculum Vitae (April 2024).pdf
Holdier Curriculum Vitae (April 2024).pdfHoldier Curriculum Vitae (April 2024).pdf
Holdier Curriculum Vitae (April 2024).pdf
 
Python Notes for mca i year students osmania university.docx
Python Notes for mca i year students osmania university.docxPython Notes for mca i year students osmania university.docx
Python Notes for mca i year students osmania university.docx
 
Plant propagation: Sexual and Asexual propapagation.pptx
Plant propagation: Sexual and Asexual propapagation.pptxPlant propagation: Sexual and Asexual propapagation.pptx
Plant propagation: Sexual and Asexual propapagation.pptx
 

Day 7 interpreting graphs

  • 1. AIM: Interpreting Graphs Do Now 1.) Combine the following terms. -5 + 4x - 6x + 10 a.) 3x b.) -2x + 5 c.) 2x2 + 5 d.) -24x2 - 5 2.) What is the Greatest Common Factor of: 12, 18, 36 a.) 36 b.) 12 c.) 3 d.) 6 1
  • 2. Homework: Pages 610-611 #6-15 all, 23, 25, 28, 34 2
  • 3. 3
  • 4. Think-Pair-Share Activity: 1.) Jenny takes a trip to the beach. She stays at the beach all day before driving back home. Which graph best shows the story? Explain your answer. 4
  • 5. 2.) Describe the relationship each graph displays. a.) a train 5
  • 6. 2.) Describe the relationship each graph displays. b.) a person riding a bike 6
  • 7. 2.) Describe the relationship each graph displays. c.) a ball that is tossed into the air 7
  • 8. 3.) The height of a tree increases over time, but not at a constant rate. Which graph best shows this? Explain your answer. 8
  • 9. BEFORE YOU LEAVE Describe a situation that could be represented by a graph that shows both the x-values and y- values increasing. 9
  • 10. 10
  • 11. Before You Leave Continued An inventor is testing a new motion detector that graphs the distance traveled by a person in motion. She walked in front of the motion detector to create the graph shown. The distance in feet is that distance the inventor is away from the motion detector. 1.) How many feet did the inventor walk during: a.) the first three seconds (0-3 s)? b.) the next three seconds (3-6 s)? c.) the next three seconds (6-9 s)? d.) the final three seconds (9-12 s)? 2.) During which interval did she walk fastest and slowest? 3.) Discuss what it means in terms of the inventor‛s speed when the line is very steep. 4.) Explain what happened between the sixth second and the ninth second. 11
  • 12. Mr. Tjersland's Math 7 Homework: Pages 614-615 #1, 6, 11, 14, 16, 19-24 all 12