1. GraphingMotionwithNumbers
PART 1
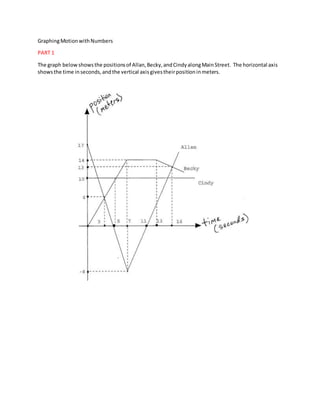
The graph belowshowsthe positionsof Allan,Becky,andCindyalongMainStreet. The horizontal axis
showsthe time inseconds,andthe vertical axisgivestheirpositioninmeters.
3. 1) FindAllan’sposition:
a. 3 secondsafterthe motionbegan
b. 7 secondsafterthe motionbegan
2) FindBecky’sposition:
a. 3 secondsafterthe motion began
b. 10 secondsafterthe motionbegan
3) FindBecky’spositionatthe momentswhen:
a. Allan’spositionis17 m
b. Allan’spositionis -8m
4) At whattime(s) isBecky’sposition:
a. 6 m?
b. 14 m?
5) Findthe distance Allancovered:
a. Between0secondsand7 seconds
b. Between0secondsand11 seconds
6) Findthe distance Beckycovered:
a. Between5secondsand7 seconds
b. Between5secondsand16 seconds
7) At whattimesandlocations,if any,dothese runnersmeet?
a. AllanandBecky
b. Beckyand Cindy
8)
a. Doesany studenteverstop? If so, who andwhen?
b. Doesany studenteverchange the directionof motion? Explain.
9)
a. DoesAllan’sspeedchange between0and 5 seconds? Explain.
b. DoesAllan’sspeedchange between5and 11 seconds? Explain.
10)
a. Who ismovingfaster:Allanbetween7and10 secondsor Beckybetween14and 16
seconds? Explainclearly.
b. Calculate Allan’saveragespeedbetween5and 7 seconds.
4. PART 2
In thispart youwill be developingyourowncurves. Thinkof twodifferentpeopleontwodifferent
paths. On the grid belowsketch twodifferentcurvesrepresentingthe positionof yourpeople over
time. Label eachcurve witha name of your choosing. Asyougraph, please considerthe following
requirements:
1) Please use straightlinesonly(usingastraightedge)
2) Since itis a function,eachcurve mustpass the vertical line test
3) For eachcurve youmust have 1 or 2 x-intercepts
4) For eachcurve there mustbe one sectionof the graph that ispositive andone thatis negative
5) For eachcurve there mustbe at leastone sectionof the graph that isincreasing,atleastone
that isdecreasing,andat leastone thatis constant
6) For eachcurve there mustbe exactlyone y-intercept
7) You musthave at least4 differentline segmentsonyourgraph
8) Do NOT place numbersonthe axes. Label the x-axisastime andy-axisasposition.
5. PART 3
Look at the graph that wasgivento you(createdbya classmate). Choose one of the two
people(curves). Highlightthe curve youchose. Your task isto write a scenariothatwould resultinthat
exactpath. Thisshouldbe a couple paragraphsinlength.
1) Write your scenarioinparagraphform thatdescribesthe pathof the personthatyou chose:
2) Label and scale the x andy axisto correspondwithyourstory.
3) State and explain the x-intercept(s) andy-interceptwithinthe contextof the scenario.
x-intercept(s):___________________
Explain:
y-intercept: _____________________
Explain:
3) Betweenwhichtimesisyourpersonmovingthe fastest? Whatistheir speedorrate of change?
4) State the intervalswhere the curve isnegative. Explainwhatthismeansinthe contextof your
story.